
Graphs Settings
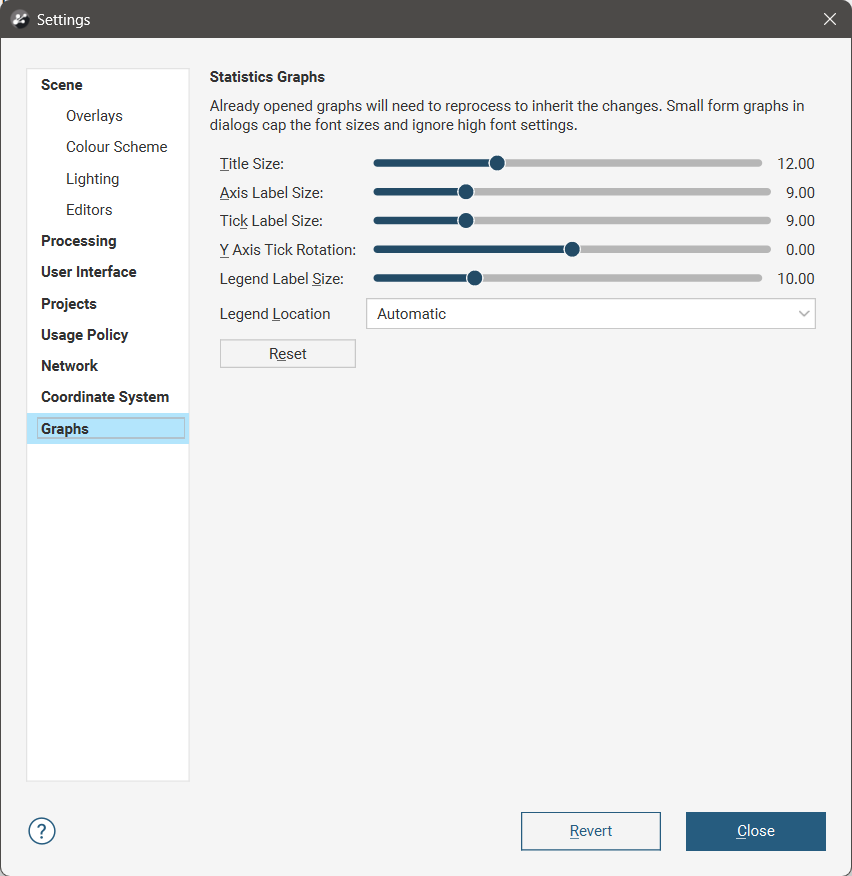
The Graphs tab in the Settings window contains global preferences for elements of graphs such as the title and axis label font size:
To see the changes made to the visual elements in this dialog, position the dialog over a chart so you can see display parameters for the chart, then make a change to the display parameters in the chart, such as turning an option on and off. This will refresh the chart so you can see the effect of the visual element adjustments made in the dialog.
Each of these global settings can be overridden locally in windows display graphs.
Legend Location controls where the legend will appear on a chart. This is a common control for local customisation on specific charts, ensuring the legend does not obscure a feature of the chart. The Automatic option will attempt to automatically ensure nothing is obscured, and should be the preferred option for the global settings. The location it selects can be overridden on any specific chart if it has not achieved the placement desired.
The Reset button will return the parameters back to the default settings.
The Revert button will return the parameters back to the settings as they were when the dialog was opened.