
Table of Statistics
For many data tables, you can view a table of statistics for multiple attributes. If the table has one or more category columns, data can, optionally, be grouped by category. To open a table of statistics, right-click on a data table then select Statistics. In the window that appears, select the Table of Statistics option.
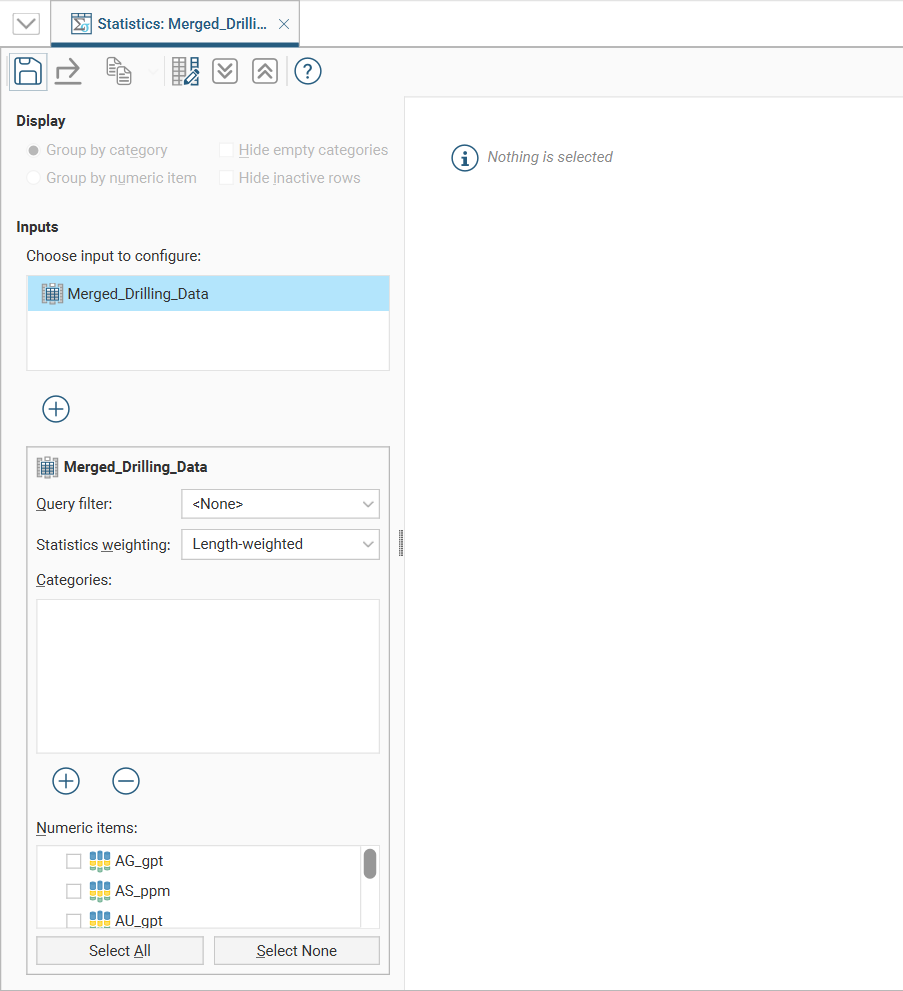
In this example, we have the initial table of statistics for a merged table with both category and numeric columns. However, nothing is displayed in the table because data columns have not yet been selected.
The input data selected in the project tree is already present in the Inputs list, and additional inputs can be added by clicking the Add button (![]() ) below the Inputs list, then moving inputs from Available Inputs to Selected Inputs.
) below the Inputs list, then moving inputs from Available Inputs to Selected Inputs.
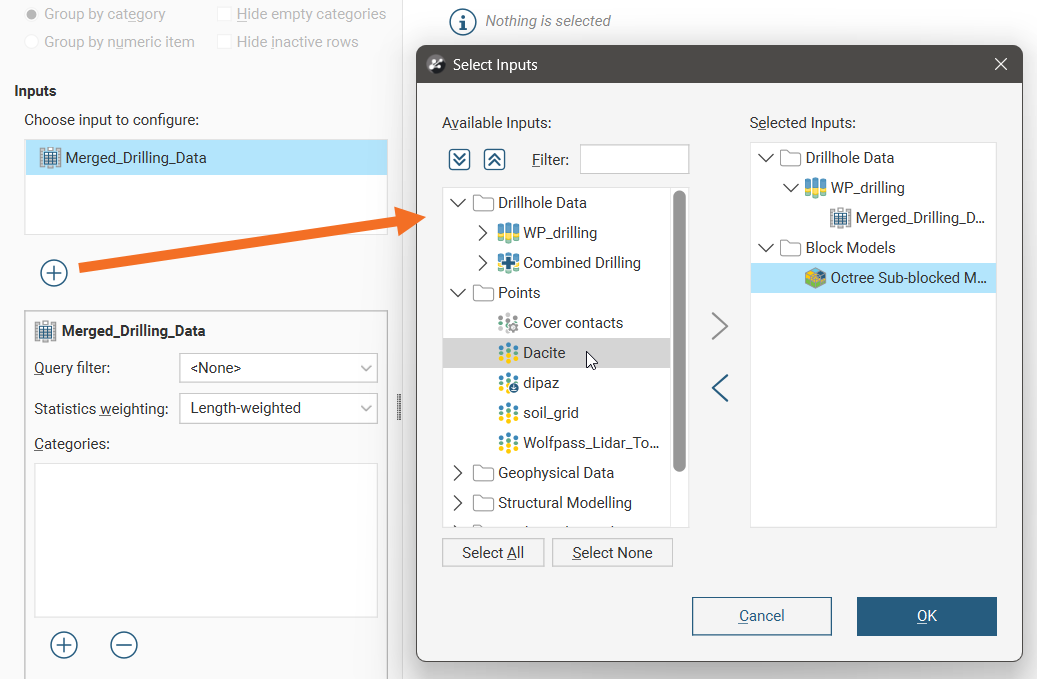
Note: when inputs are added to the selected inputs list and the OK button is clicked, a new copy of the table of statistics with the selected inputs will be created and automatically saved to the Saved Statistics folder.
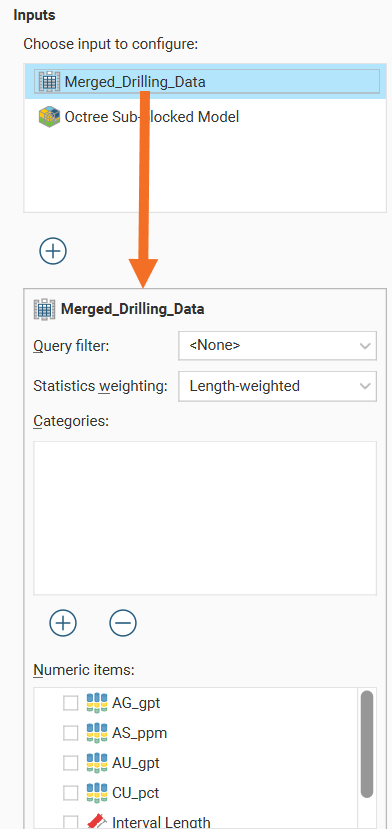
The input selected in the input list will affect the category and numeric data shown below the input list.
The input data used in the table of statistics can be filtered using a Query filter. See the topic Creating a Query Filter for information on creating query filters.
If you wish to remove an input from the Inputs list, click the Add button (![]() ) below the Inputs list and move inputs from Selected Inputs to Available Inputs.
) below the Inputs list and move inputs from Selected Inputs to Available Inputs.
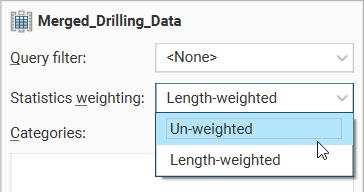
The Statistics weighting dropdown list will contain different options depending on the object being inspected. For this merged table example, the options are Un-weighted and Length-weighted.
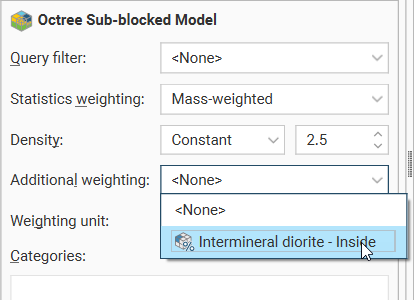
For a block model, the options are Un-weighted, Volume-weighted and Mass-weighted. When Mass-weighted is selected, you can also specify the Density as a constant number or by referencing a data column that contains density information. There is also an Additional weighting column which allows the selection of another numeric column to use for scaling. This is especially useful for selecting a stored proportion as illustrated here:
For columns other than stored proportions, you will need to specify the Weighting unit as Decimal or Percentage depending on the content of the data column.
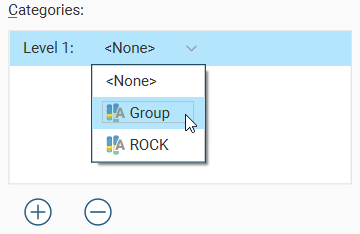
Click the Add button below the Categories list to select from the category columns available in the input table. An entry will be added to the Categories list. Open the dropdown list to select from the available category columns:
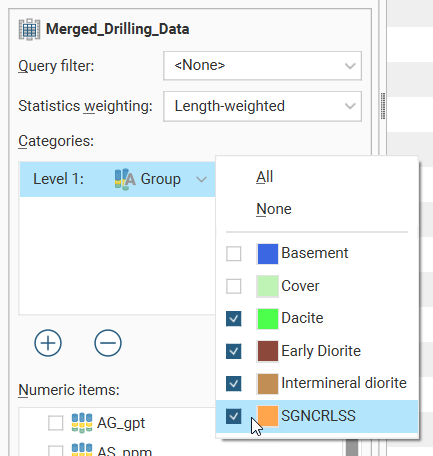
An additional dropdown list will be added, where individual categories of interest can be selected. There are All and None options to provide alternate starting points for category selection.
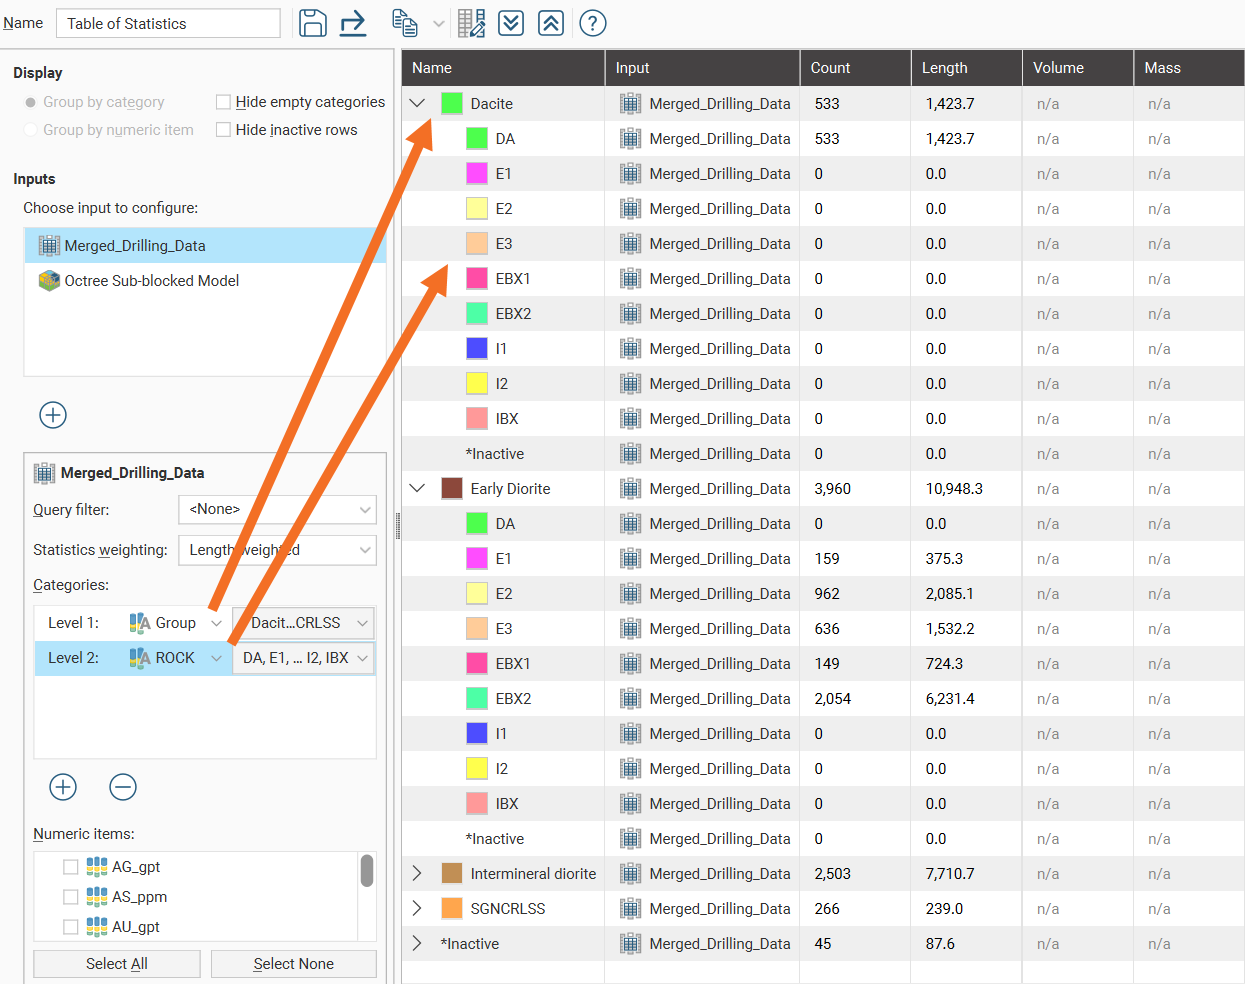
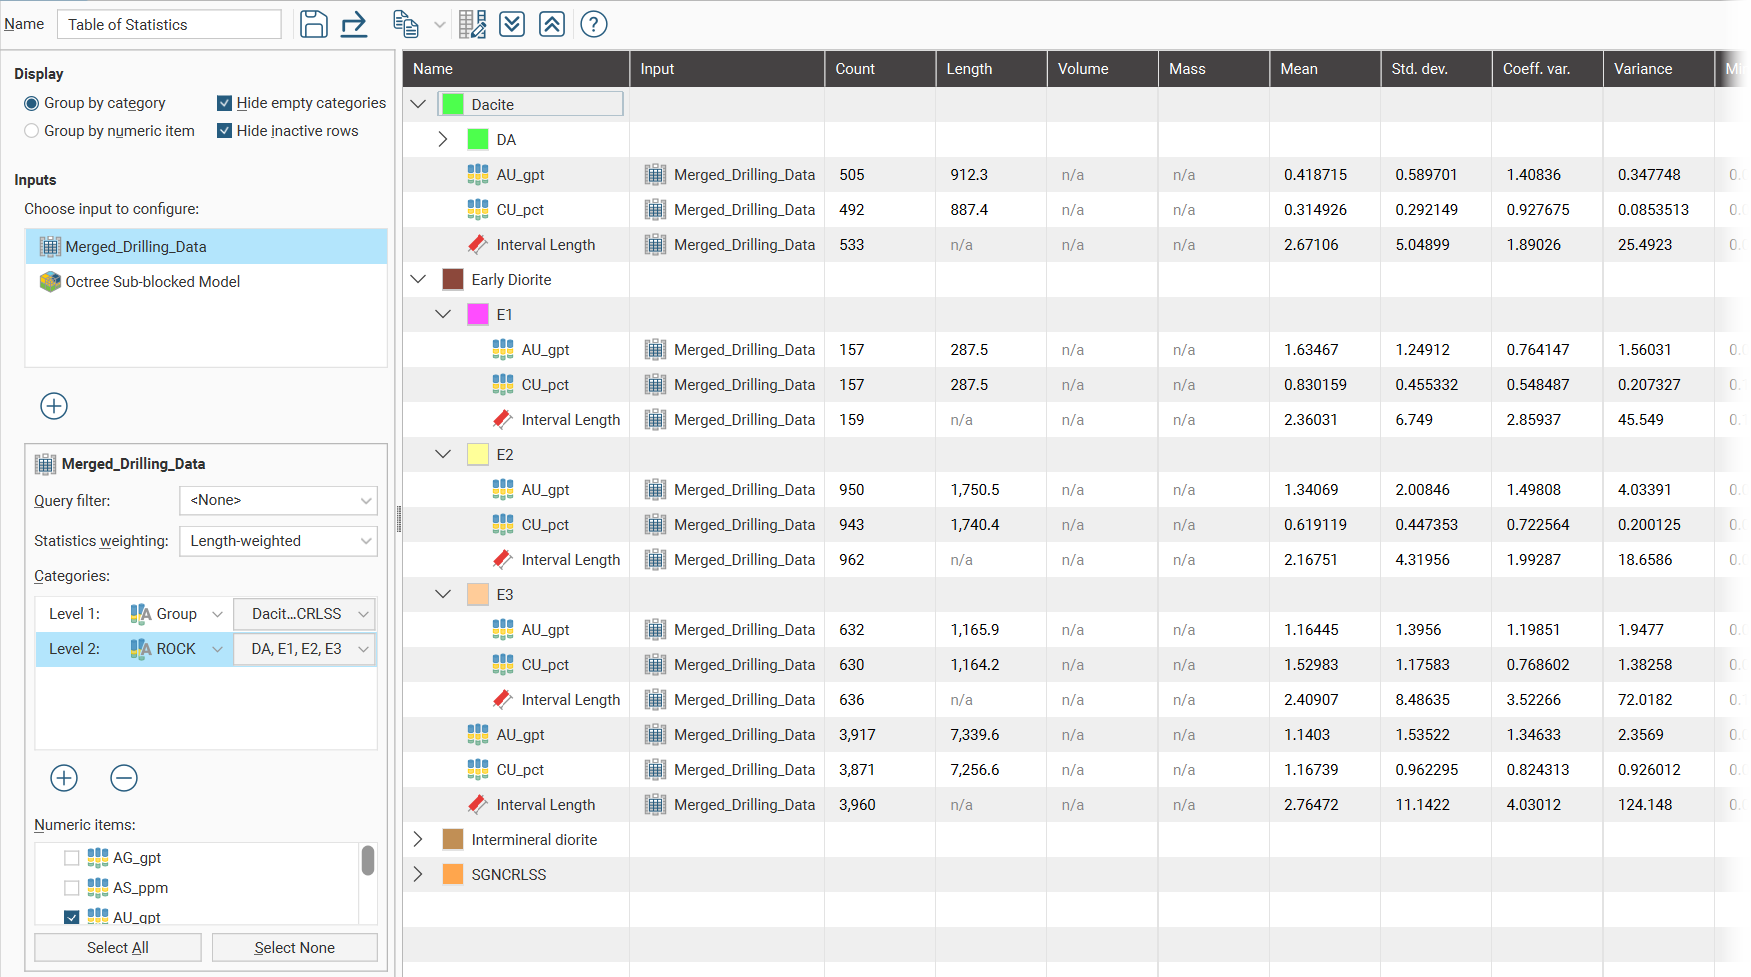
When additional category columns are added to the Categories list, the Level 2 category column will be nested below the Level 1 category column in the table of statistics.
To reorder the levels for the category columns, it is necessary to delete and re-add the category columns in the preferred order.
Select from the Numeric items available for the table.
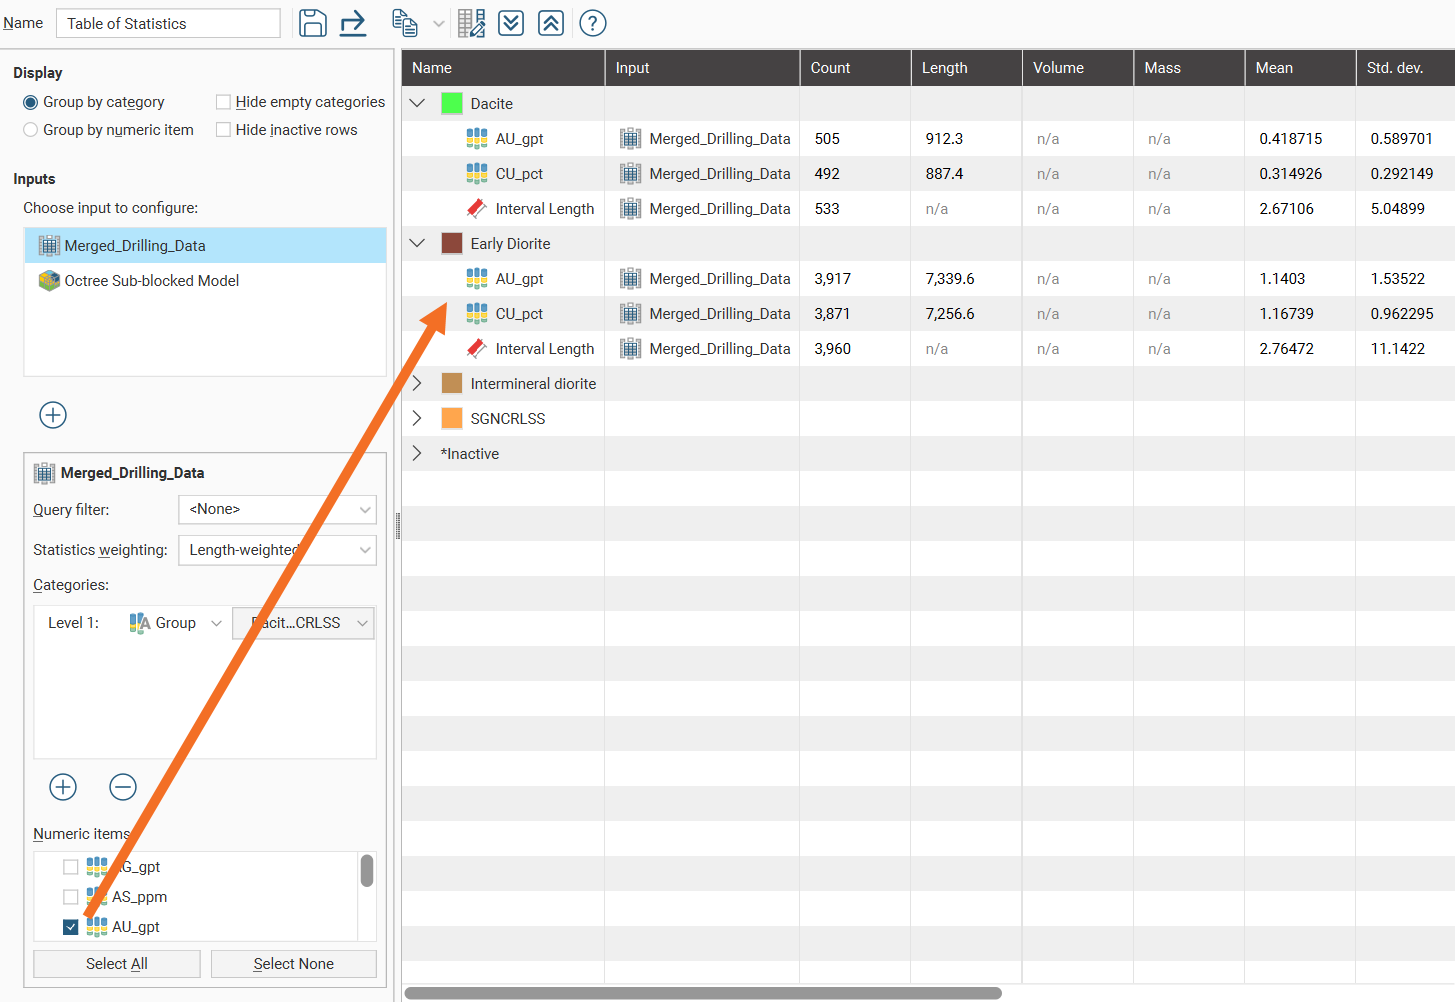
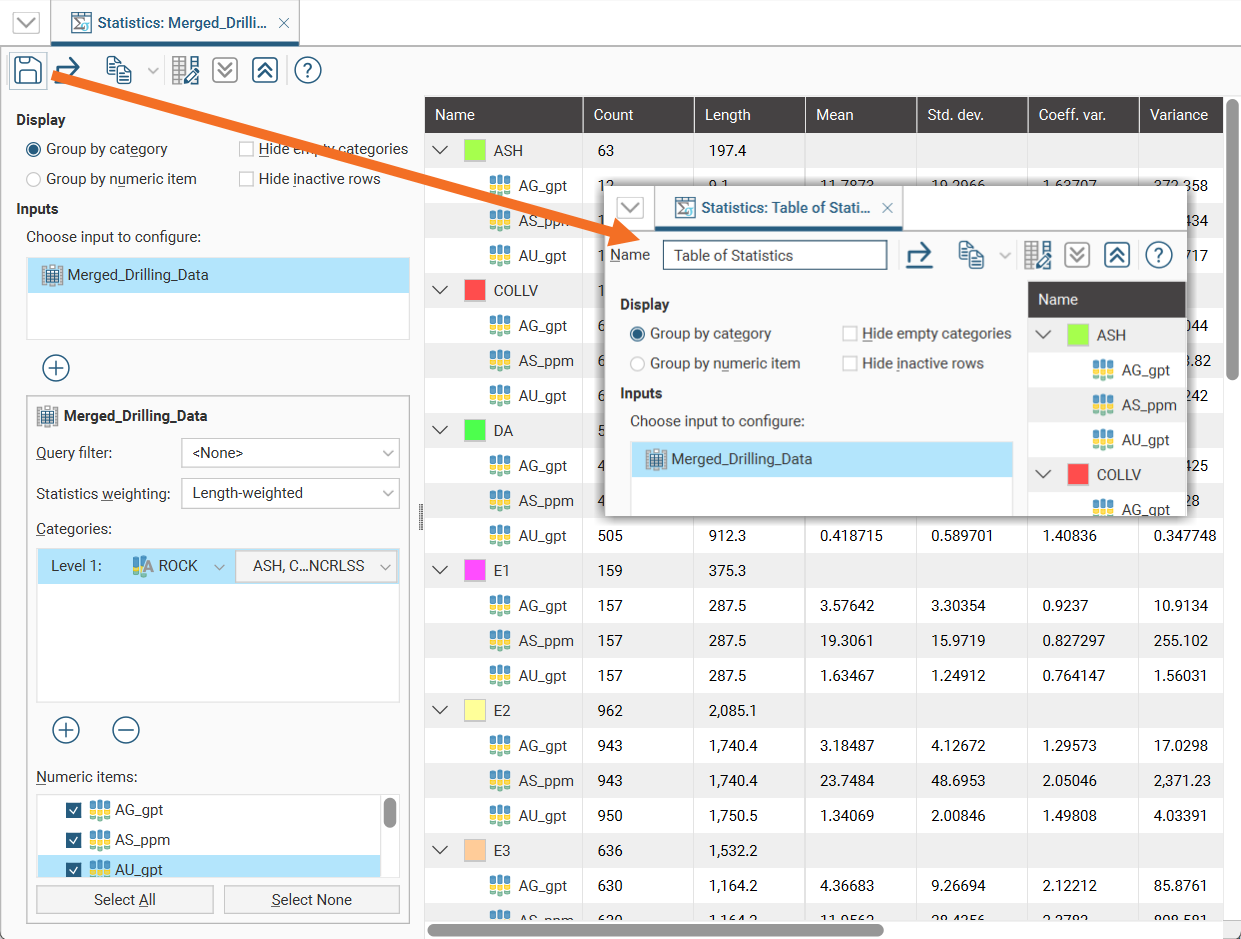
Once Numeric items have been selected, a complete table of statistics will be available:
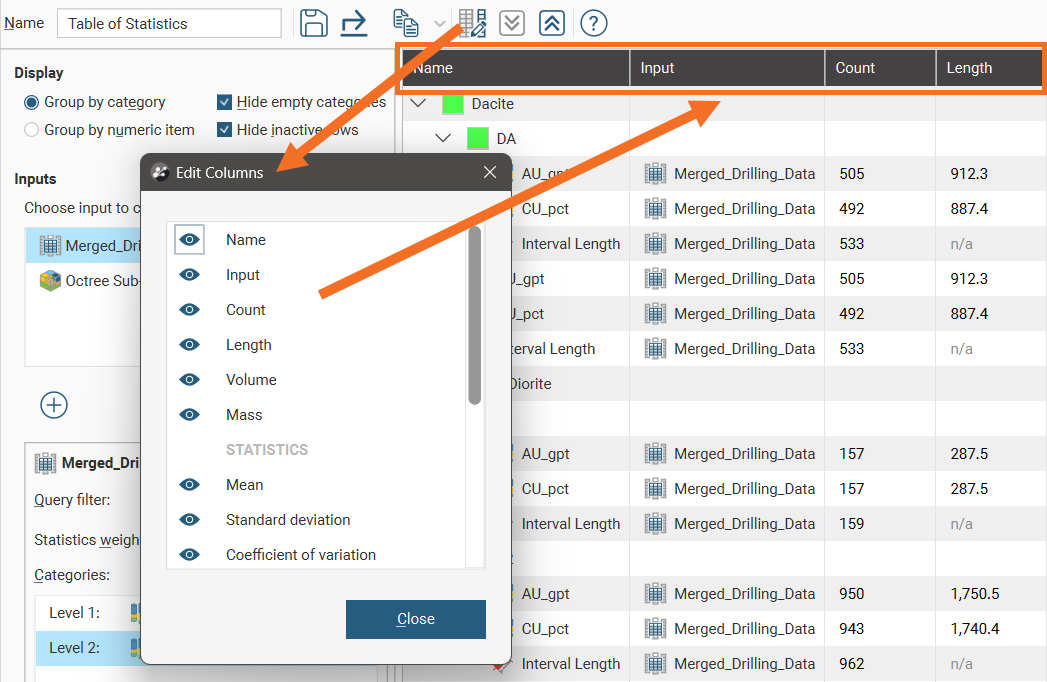
Change the columns displayed in the table by clicking on the Edit table columns button (![]() ):
):
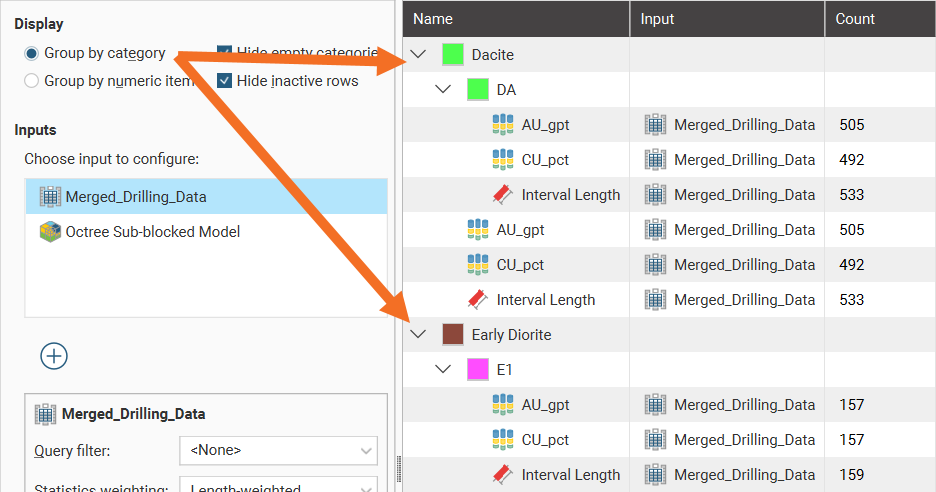
Group by category and Group by numeric item provide further options for the table organisation. Here the Group by category option has been selected, resulting in the numeric rows appearing for each category:
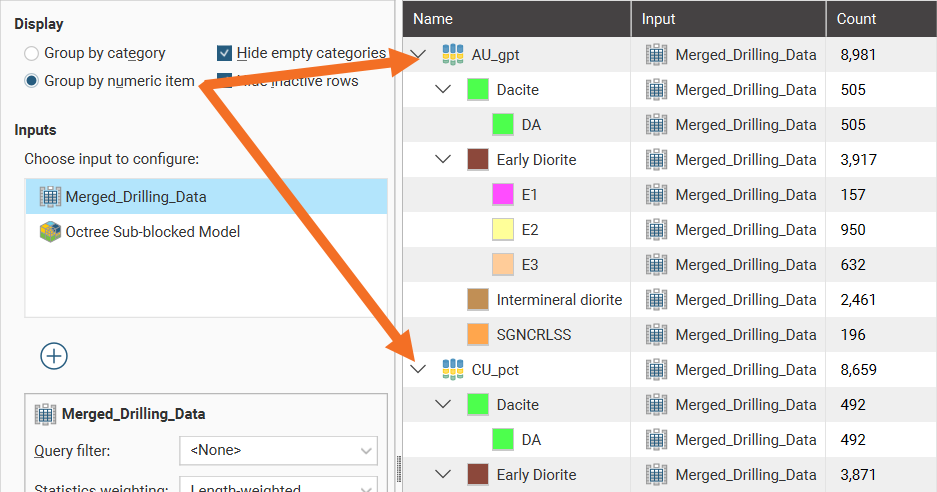
When Group by numeric item is selected, category rows appear for each numeric data column:
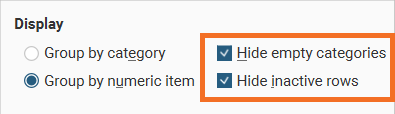
You can also hide empty categories (those with a count of zero) and inactive rows:
The arrow buttons quickly expand (![]() ) or collapse (
) or collapse (![]() ) rows.
) rows.
Saving a Table of Statistics
Click the Save button (![]() ) to add the table of statistics to the Saved Statistics folder.
) to add the table of statistics to the Saved Statistics folder.
This will create a copy of the table of statistics with a default name. You can then modify the name of the table so you can more easily find it in the Saved Statistics folder. You can also switch back to the original table of statistics and make further changes, then save additional versions of the table to the Saved Statistics folder.
Once saved to the Saved Statistics folder, subsequent changes to the table are automatically saved.
Exporting a Table of Statistics
Tables of statistics can be exported as CSV files. Click the Export button (![]() ), then specify a filename.
), then specify a filename.
Alternatively, click rows to select them, and select multiple rows by holding down the Shift or Ctrl key while clicking rows. You can then copy rows of data to the clipboard by clicking the Copy button (![]() ), then selecting Copy Selected Rows. There is also a Select All option available. Once a selection has been copied to the clipboard, you can then paste the data into another application.
), then selecting Copy Selected Rows. There is also a Select All option available. Once a selection has been copied to the clipboard, you can then paste the data into another application.