
Evaluated Columns and Evaluated Interval Columns
Evaluated columns and evaluated interval columns combine information from different sources.
An evaluated column adds data to a table from another source within the project, often integrating some information generated from your analysis activities back onto some source data tables (back-flagging). You can draw category information from a geological model or a grouped mesh, and use it to add a new column to an interval table, survey table, merged table, composite table, downhole points table or downhole structural data table. Using an evaluated column classifies intervals according to which model volume they “belong” in. The resulting column can be used elsewhere in Leapfrog Energy wherever a category column can be used. The evaluated column will be linked to the model, and changes in the model will be updated in the evaluated column.
An evaluated interval column adds data to downhole points tables, survey tables or structural data tables from interval tables. You can draw either numeric or category information from drilling data interval tables.
Adding an Evaluated Column to a Table
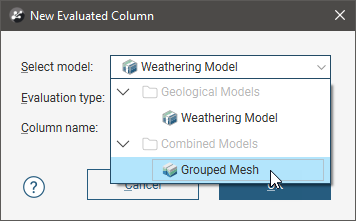
To add an evaluated column to a table, right-click on the table and select New Column > Evaluated Column. In the New Evaluated Column window, select the model you want evaluated onto the interval table. The Select model field organises the available models into the sections. Both category and numeric column data options will be listed.
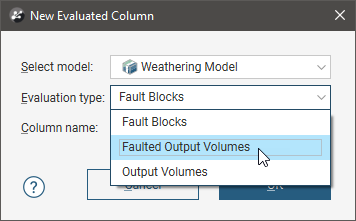
When the selected model is a faulted model, the Evaluation Type setting determines whether the model’s output volumes, faulted output volumes or fault blocks are evaluated.
Give the new evaluated column a name in the Column name field, then click OK.
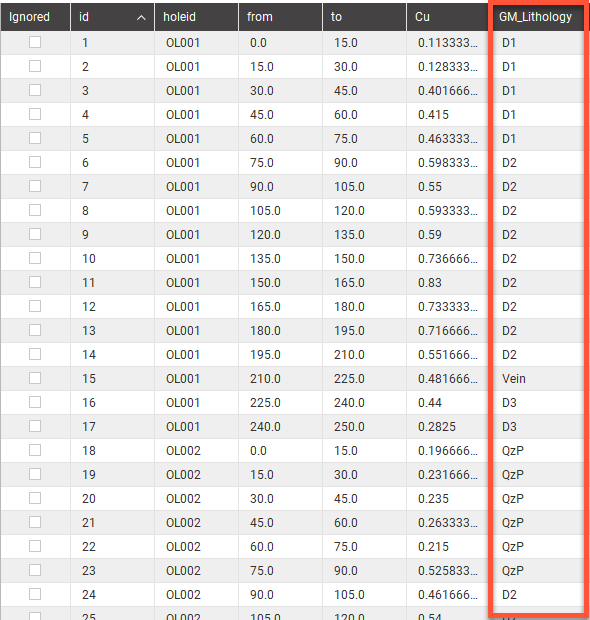
A column will be added to the interval table, with each existing interval receiving a category or numeric evaluation based on where the midpoint of the interval is located in relation to the corresponding input model.
Adding an Evaluated Interval Column
The survey table, downhole points and downhole structural data points can have a new column added from either category or numeric information sourced from drilling data tables.
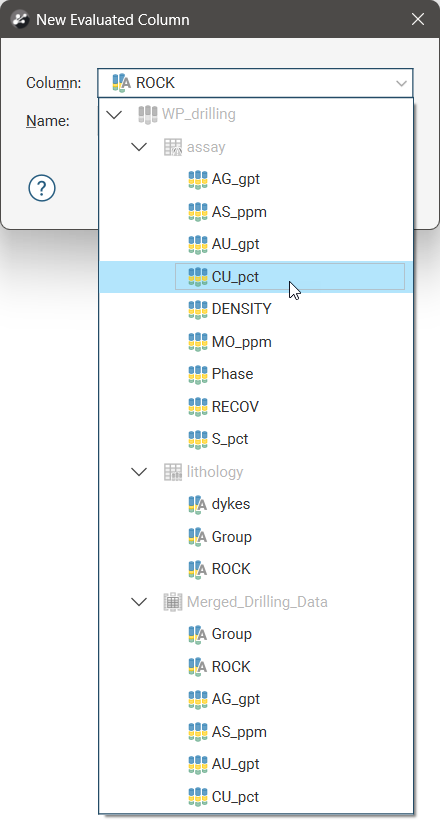
When adding a new column from drilling data, right-click on the survey table, downhole points and downhole structural data points object in the project tree and select New Column > Evaluated Intervals Column. In the New Evaluated Column window, open the Column dropdown list and select the column you want to add from those available.
Give the new evaluated column a Name, then click OK.
A column will be added to the table, with each existing entry receiving a category evaluation based on where the downhole location is relative to the interval category data. If the depth is greater than or equal to the category column’s interval ‘from’ depth, and less than the interval’s ‘to’ depth, the location will be assigned the code or value of that interval.
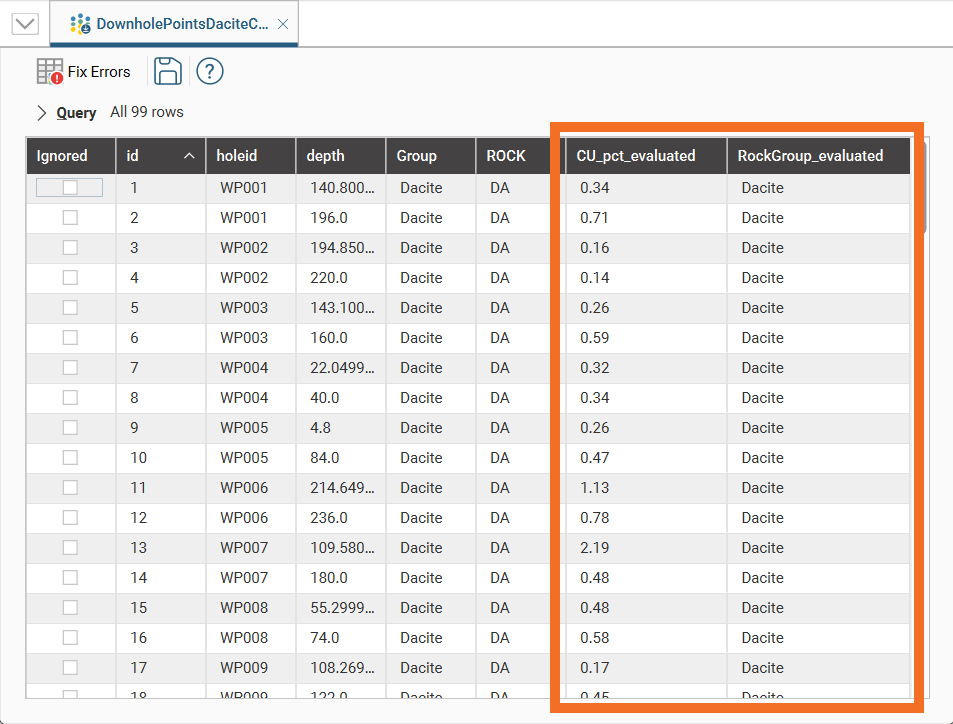
Evaluated Column From Geological Model
Evaluated Columns are an alternative workflow to creating back-flagged drilling data using a merged table from an interval table and a geological model’s evaluation table. The advantage provided by using evaluated columns is due to the data intervals not being split into two at the geological model volume boundaries, which can cause issues when assays are split in potentially illogical ways.
This scene view shows wells with the radius sized proportionally to the assay value, and coloured according to lithology, once the lithology information was added as an evaluated column to the assay table. A vein volume is shown in transparent blue to show the relationship between the geological model volume and the evaluation at the interval mid-points.
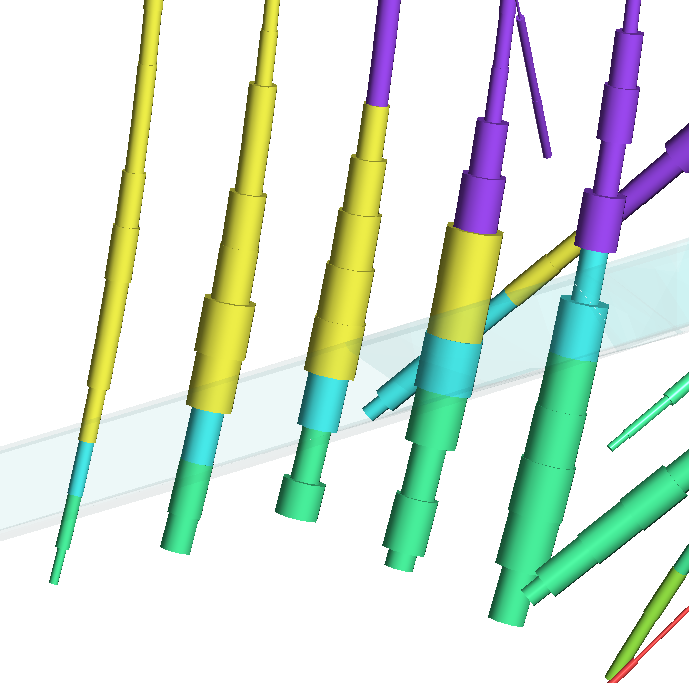
Evaluated Columns From Grouped Meshes
The categories assigned to each object in a Grouped Mesh can be evaluated onto intervals in an interval table as a new evaluated column.
This scene view shows grouped mesh volumes with a slice through the middle. Unsliced wells are also shown coloured to represent lithological volumes according to the new column that has been added to the OL_assay table from the grouped mesh.
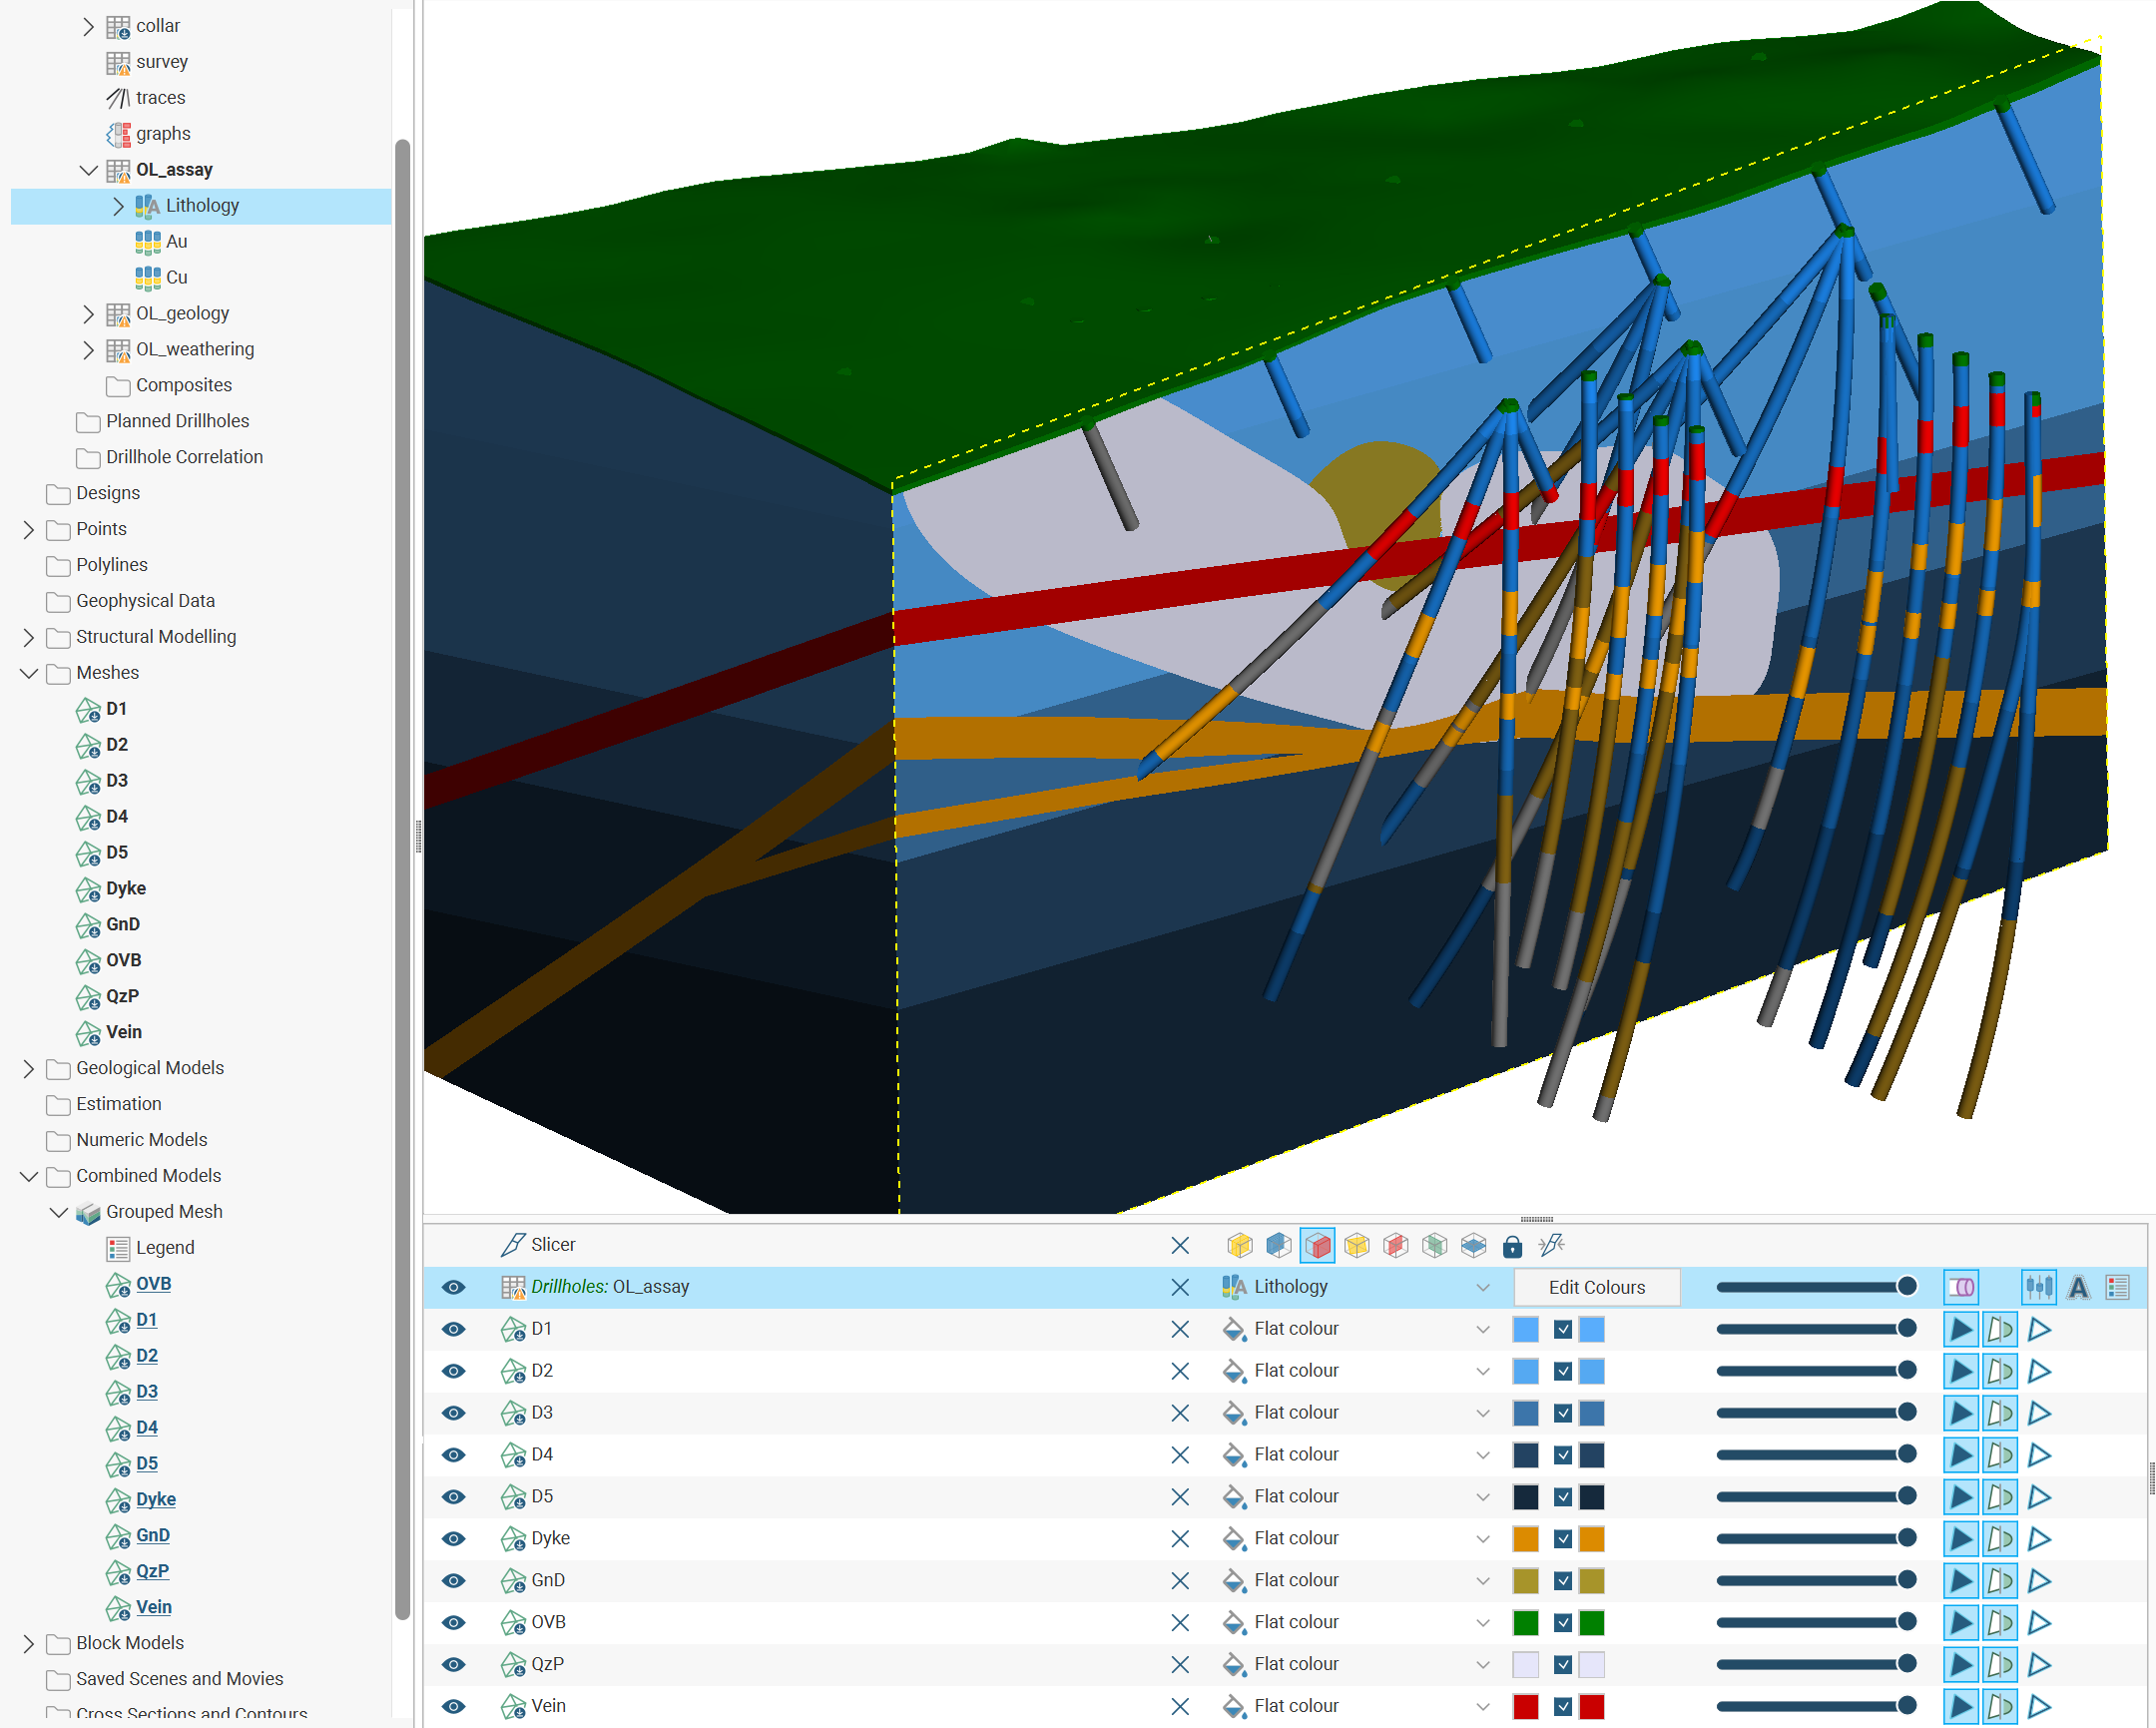
Evaluated Columns From Block Models
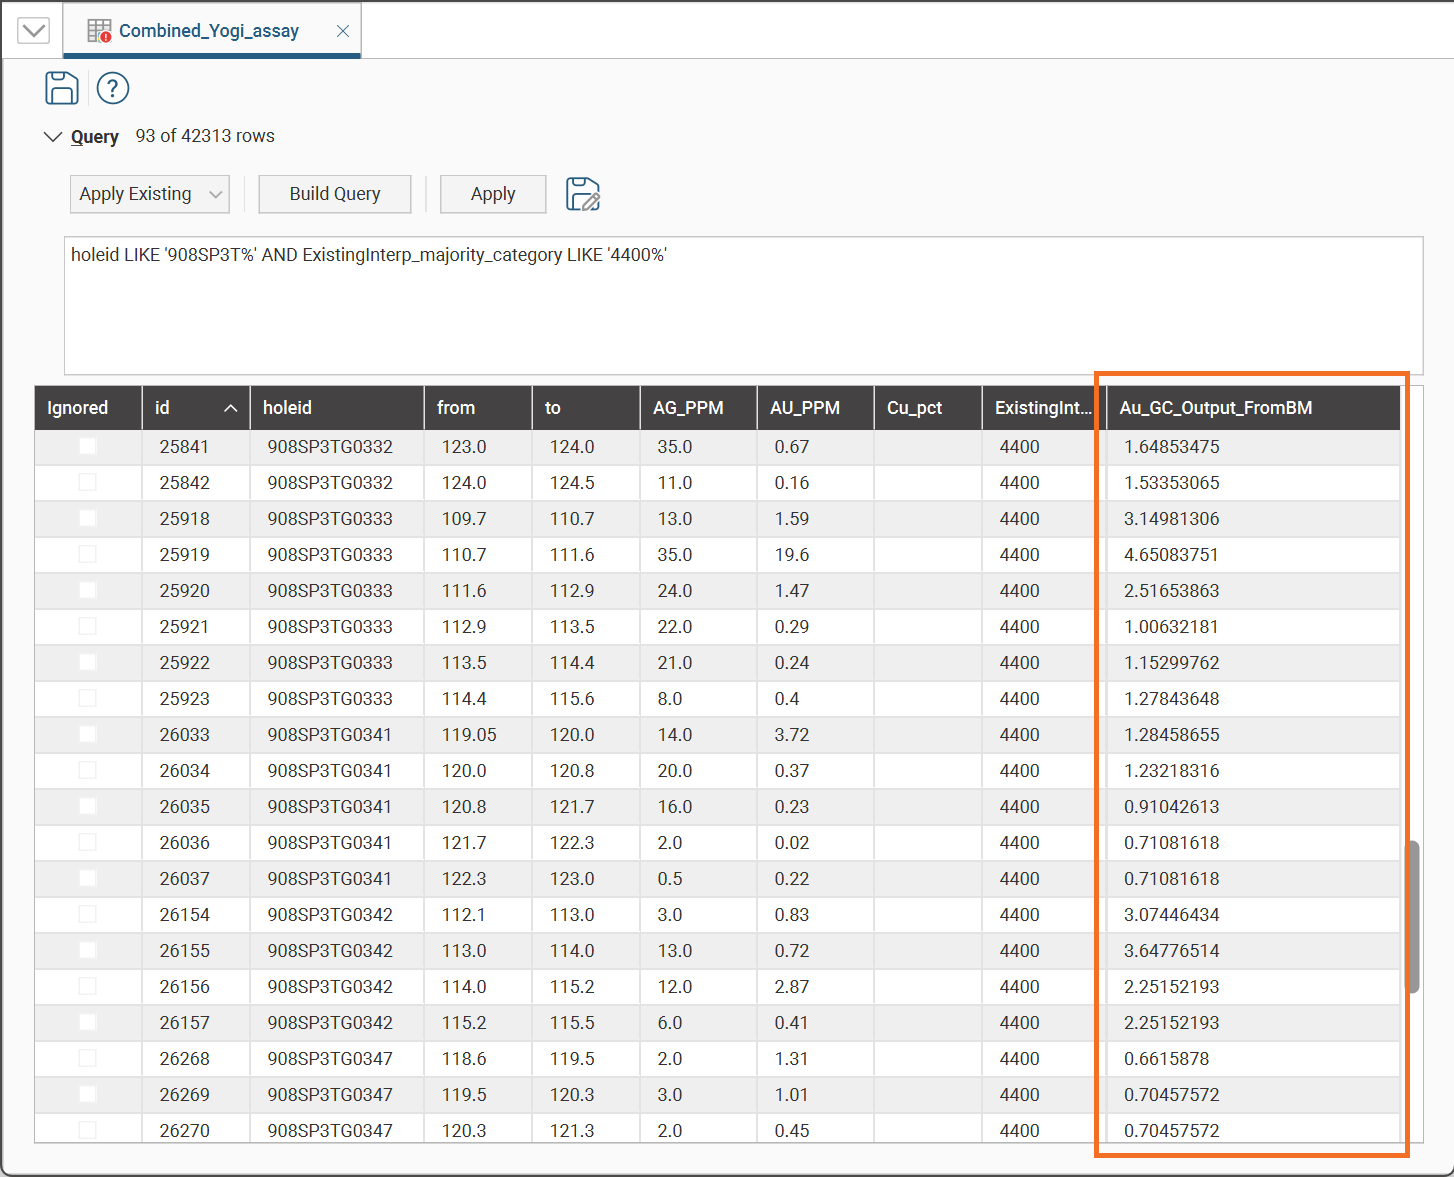
Category and numeric data from block models can be evaluated onto intervals in an interval table as a new evaluated column. Right-click on the interval table in the project tree, then select New Column > Evaluated Column. Find a block model and choose a data column from the block model evaluations. Specify a Column name then click OK.
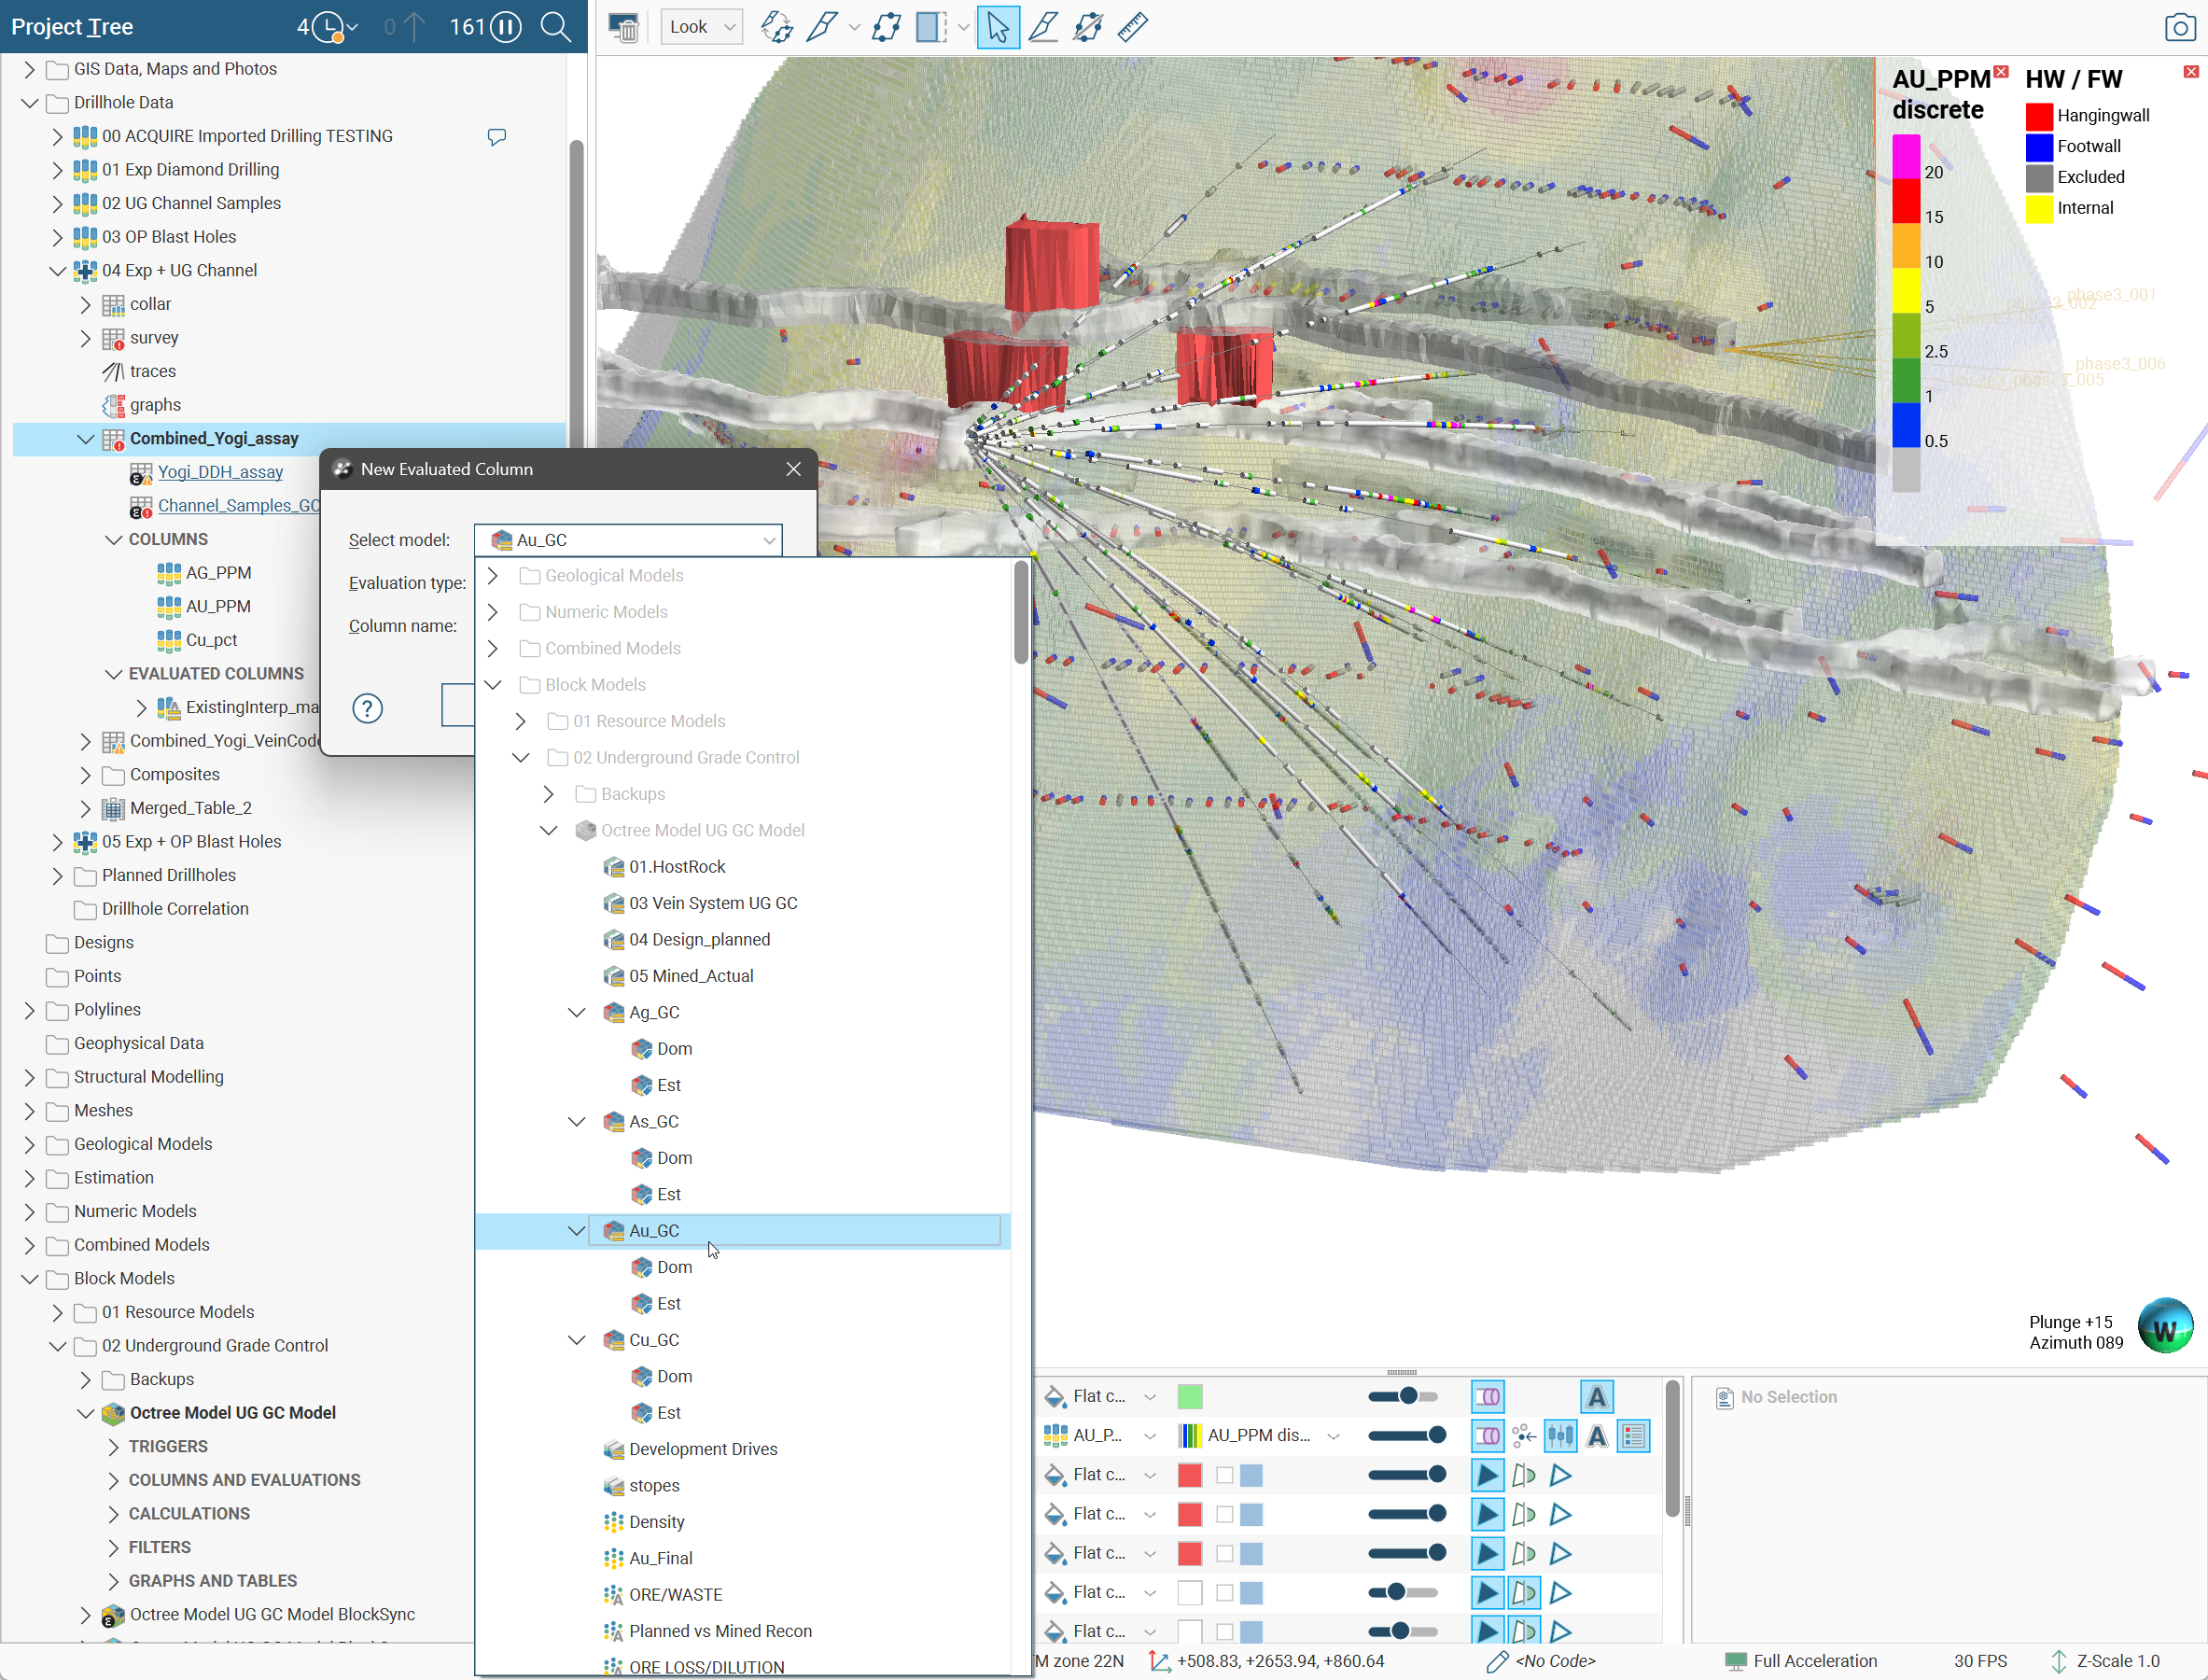
The interval table will get a new data column with the name you provided, and each interval in the interval table will get a value evaluated from the source block model.
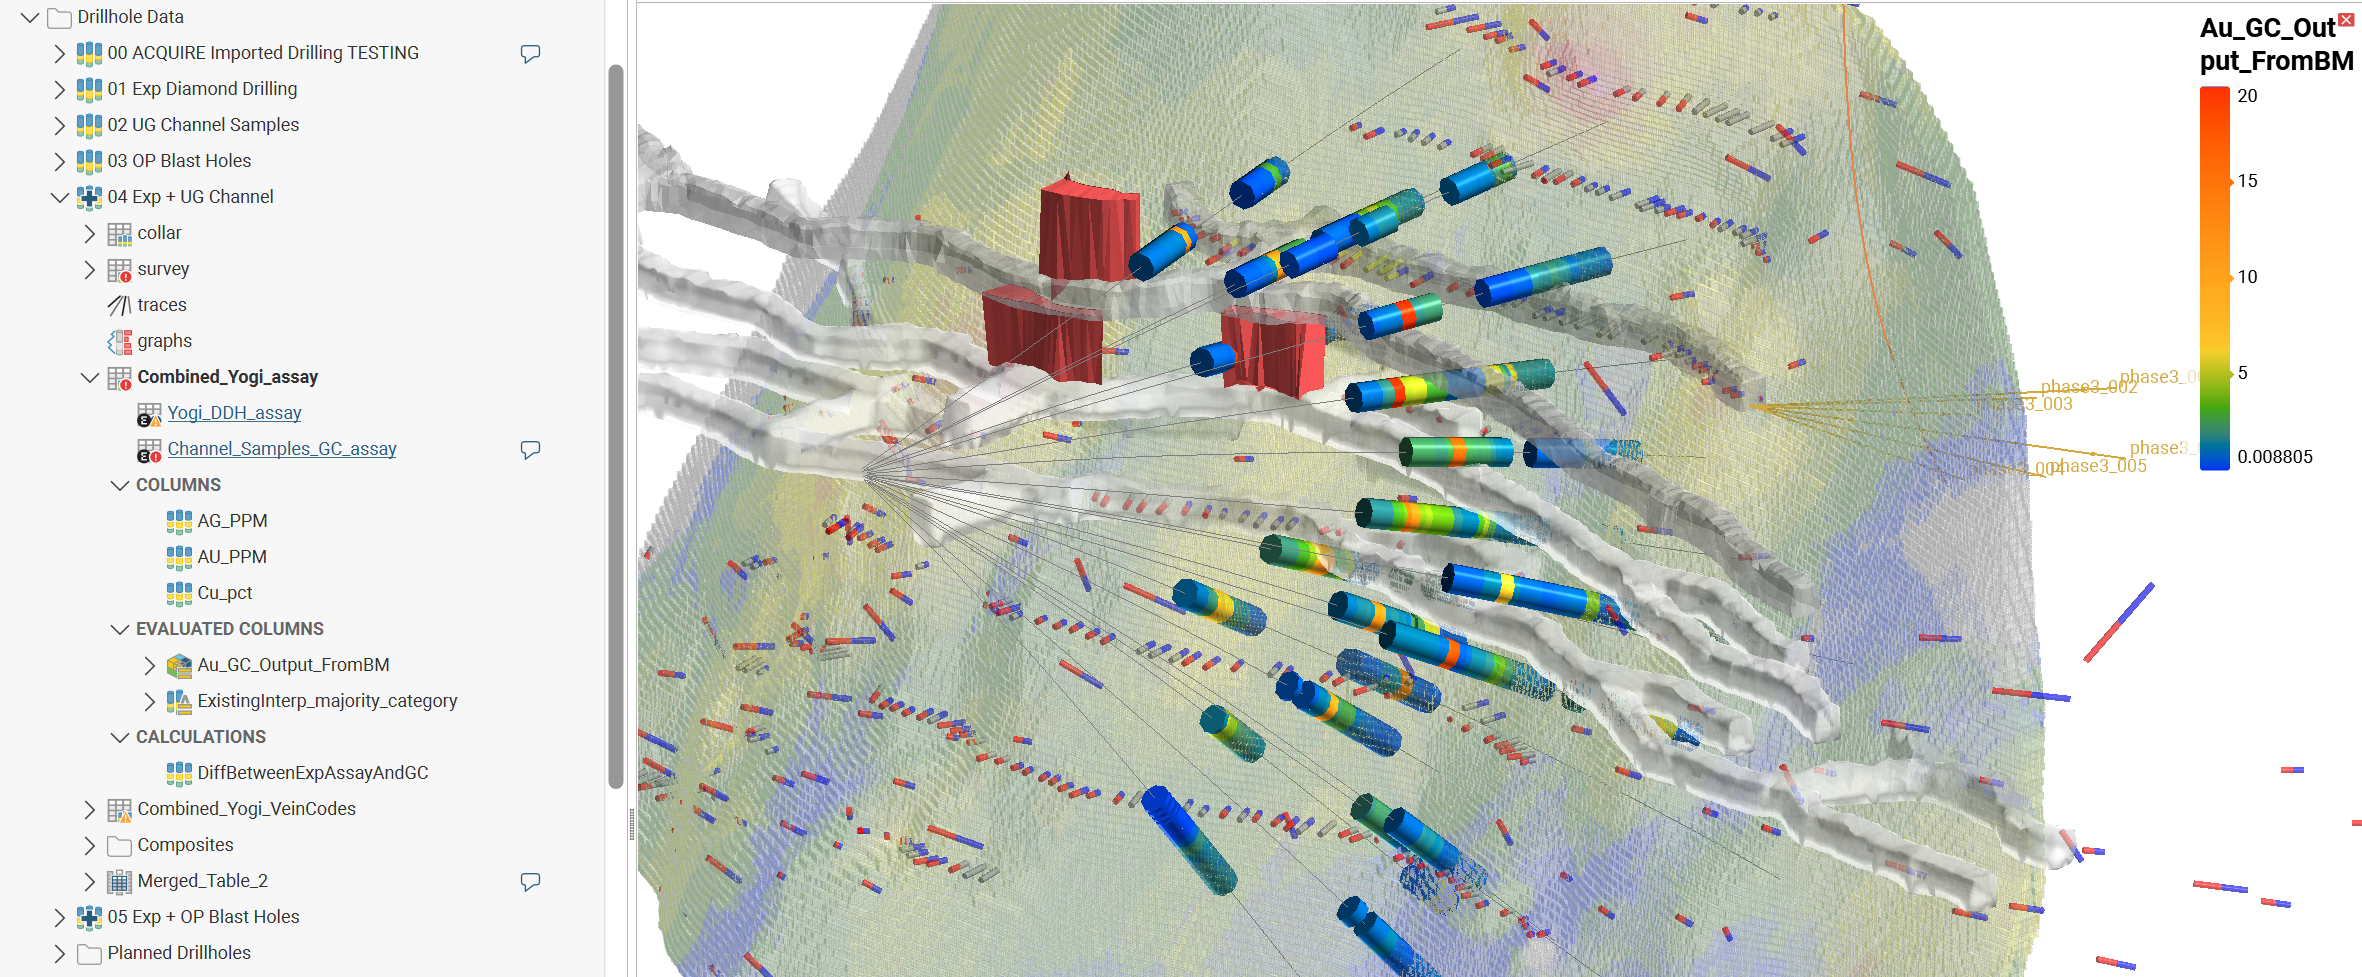
This scene view shows the same scene as above, but with the fan drilling now showing the new column evaluation from the selected block model.
Evaluated Columns in Estimation Workflows
Evaluated columns can be utilised to move estimation domain analysis and compositing from the domained estimation object up to the drilling data. This takes advantage of the comparative statistical tools available on interval tables, such as table of statistics and box plots.
Such a modified workflow would follow these steps:
- Build geological model domains
- Create a new evaluated column on the assay table to add a category value designating the geological model volume for each interval
- Composite the drilling data in a subset of codes
- Perform statistical analysis and domain comparisons to identify domains for estimation
- Create domained estimations using the composited data table as an input