Adding and Styling Wells and Planned Wells
The Wells folder contains all wells and planned wells that have been added to the section layout. To add wells to the section, right-click on the Wells object and select either Add Wells or Add Planned Wells.
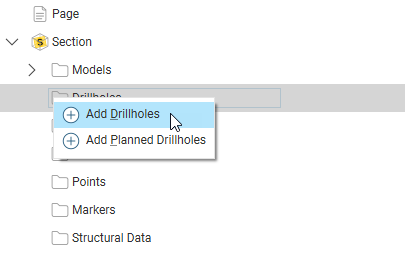
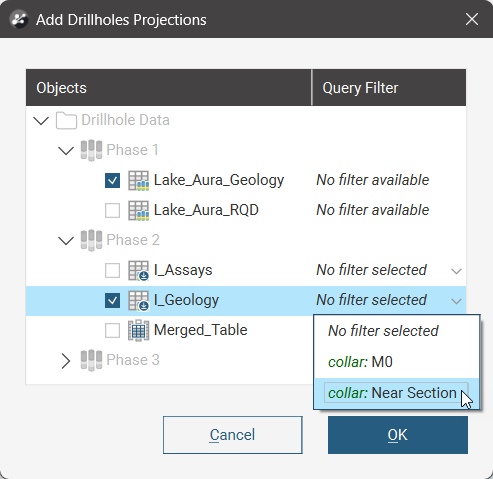
When adding a well or planned well projection, you will be prompted for the interval tables to display; more than one can be selected. When available, filters can be selected to constrain the data in the selected table. Each selected table will be added as a separate item below the Wells folder.
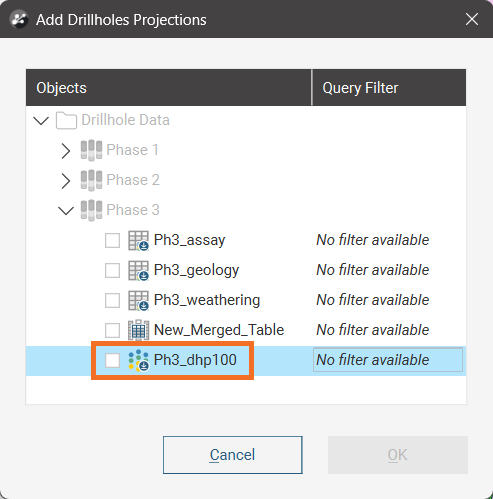
Downhole points tables will also appear in the list when adding drillhole projections:
When you click OK, the wells are added to the layout tree. They will be flagged with No Selection.
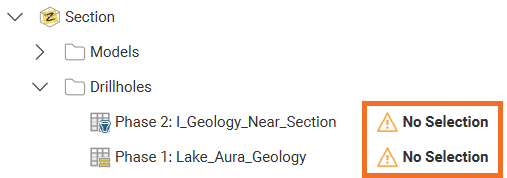
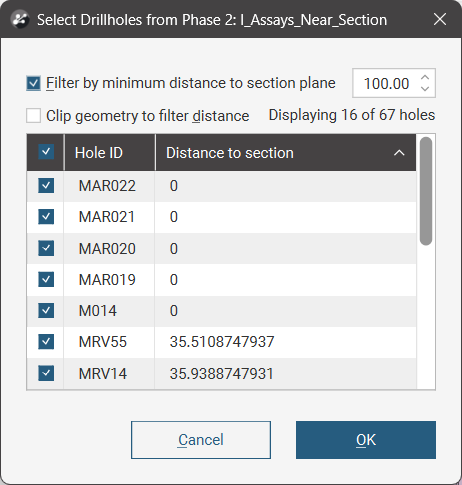
If you add a single well table, the Select Wellwindow will automatically appear to prompt the selection of at least one well. Otherwise, double-click on a well object to open the Select Wellwindow.
This window can also be opened by right-clicking on the wells object and selecting Projection settings.
Enabling the Filter by minimum distance to section plane value determines the limit for the projection of the wells onto the section based on the minimum distance from any point on the well trace to the section plane.
Use the check boxes next to each well in the list to determine which should be projected. The check box next to Hole ID will enable or disable all of the wells.
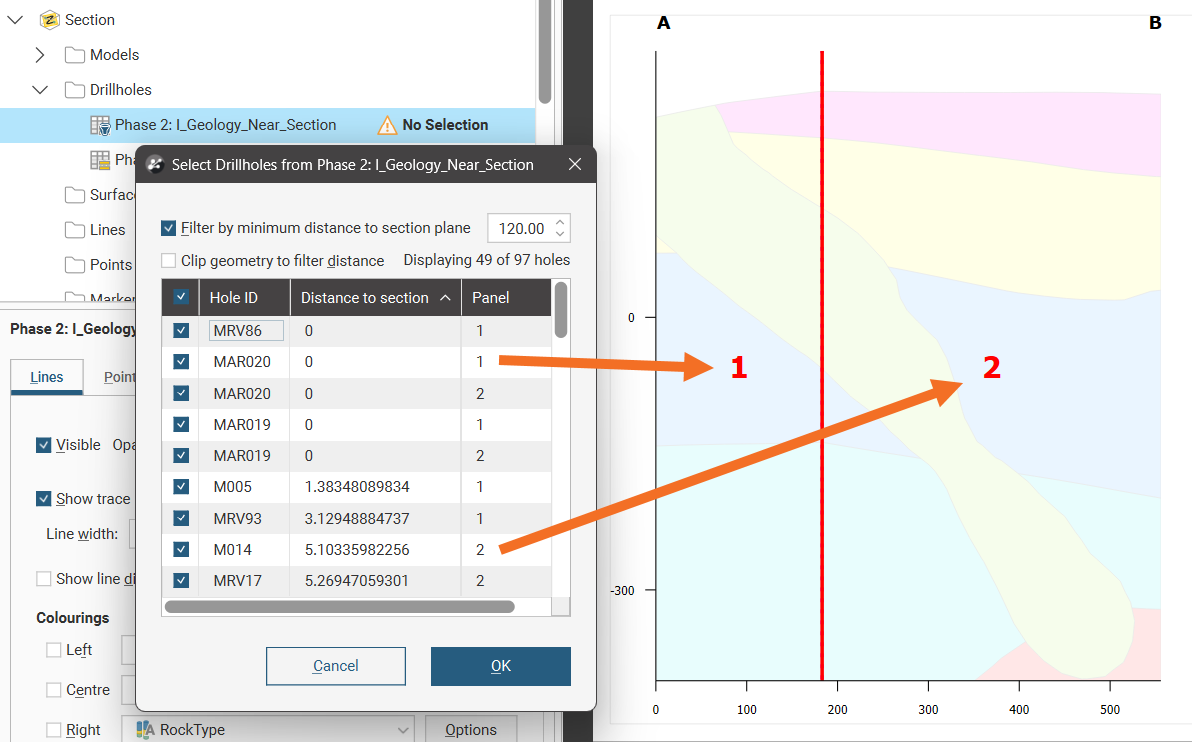
If projecting a well onto a curved long section, there will be an additional Panel column in the table. Because a long section can be bent such that a well could be projected onto more than one section panel, this allows control over which section panel(s) the well will be projected on.
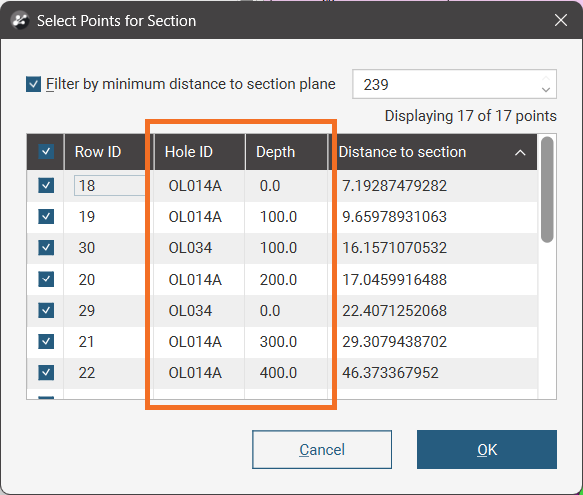
If projecting downhole points onto a section, the Select Points for Section window will include Hole ID and Depth columns for ease of identifying which points you want to enable or disable when managing point visibility selections:
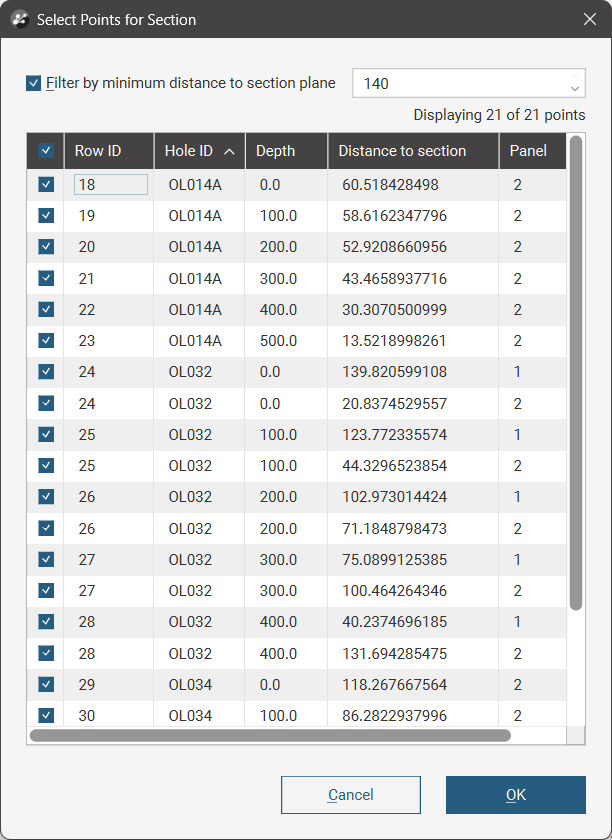
If projecting downhole points onto a curved long section, there will be Hole ID, Depth and Panel columns:
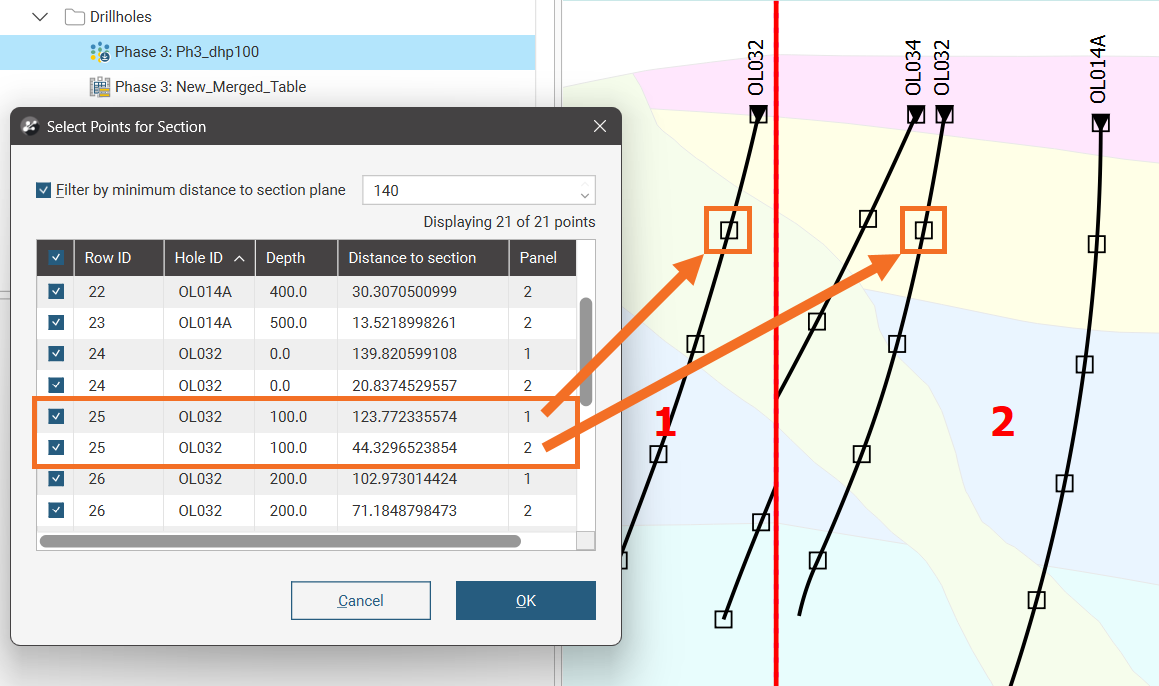
Like most tables, you can sort these projection settings table by clicking one of the column headers. You can cascade these table sorts; if you want to have the sort by Hole ID, then Depth, then Panel, work backwards. Click the Panel header, then the Depth header, then the Hole ID header:
For more on how wells, planned wells and downhole points are projected onto a long section in either Illustrative or Orthogonal modes, see Projection Algorithm.
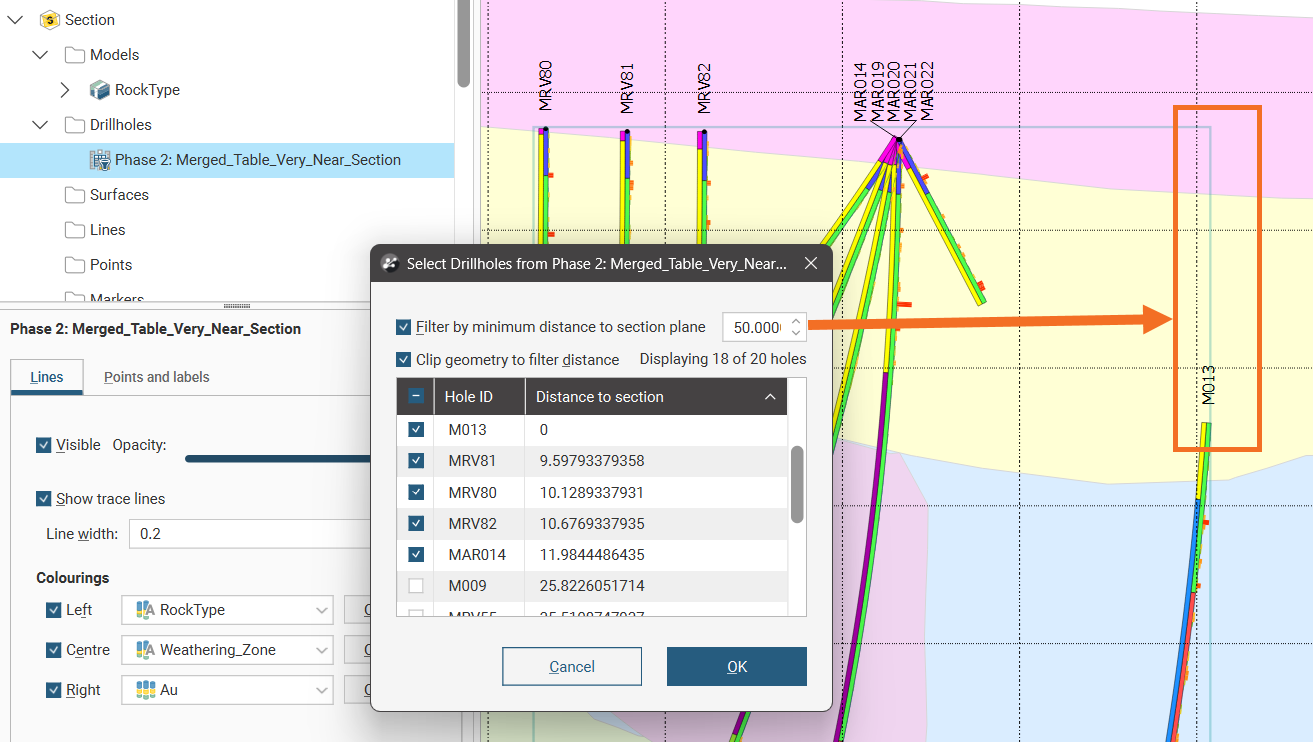
The Clip geometry to filter distance option limits the projection of a well to only the parts of wells that are within the specified distance.
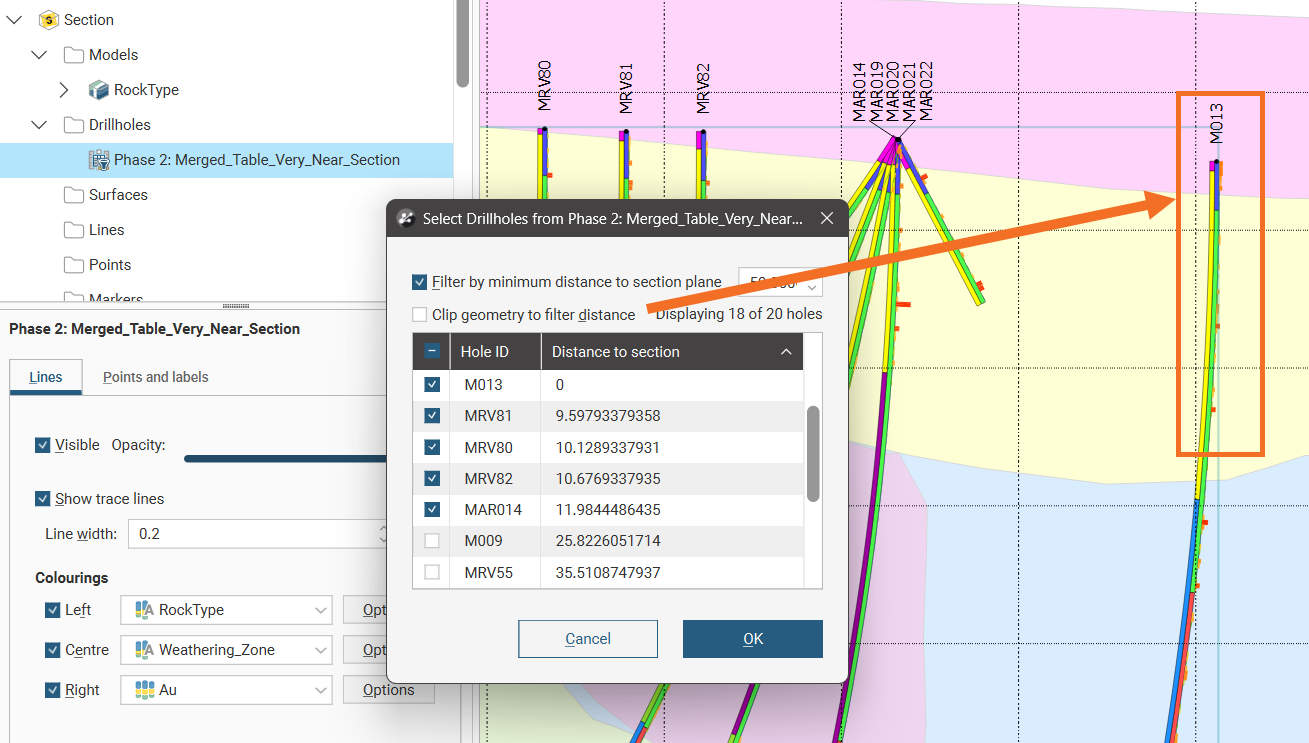
With Clip geometry to filter distance unchecked, if part of a well is within the minimum distance specified, the whole well will be projected onto the section.
When a long section is updated, well evaluations are updated. If there are multiple instances of a well evaluation, how they appear on the section may change when the section is updated:
- If all instances of a well evaluation have been enabled, then all remain enabled when the section is updated.
- If all instances of a well evaluation have been disabled, then all will remain disabled when the section is updated.
- If only some instances of a well evaluation have been enabled, then all instances will be enabled when the section is updated.
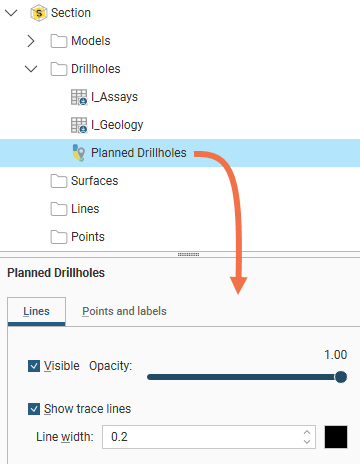
Select an item under the Wells in the layout tree to see the properties to make the objects visible and to change their opacity and line width.
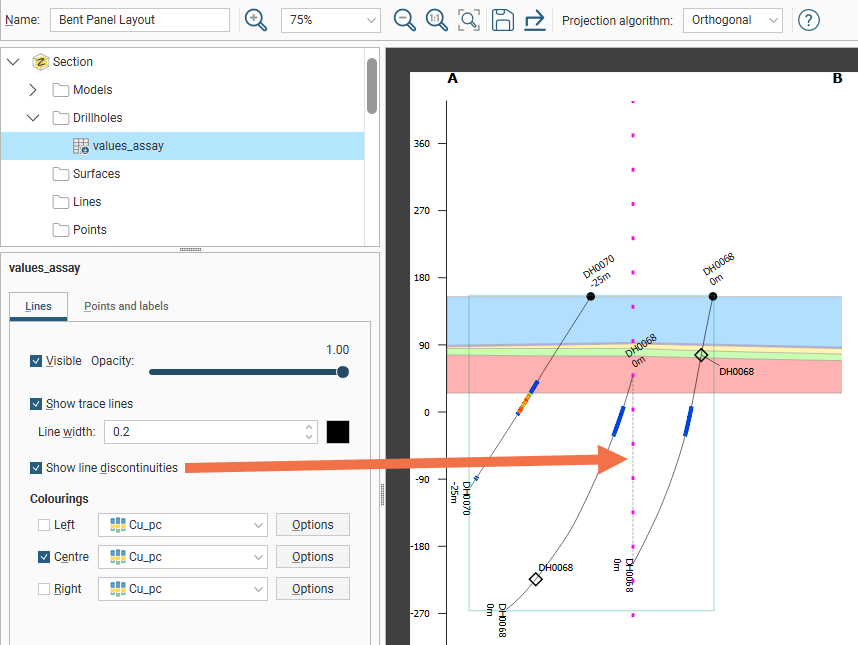
Long sections using the orthogonal projection algorithm have an additional option to Show line discontinuities, which adds a dotted line to connect wells that appear “broken” across panel folds due to a curve or angle in a polyline being flattened onto a section.
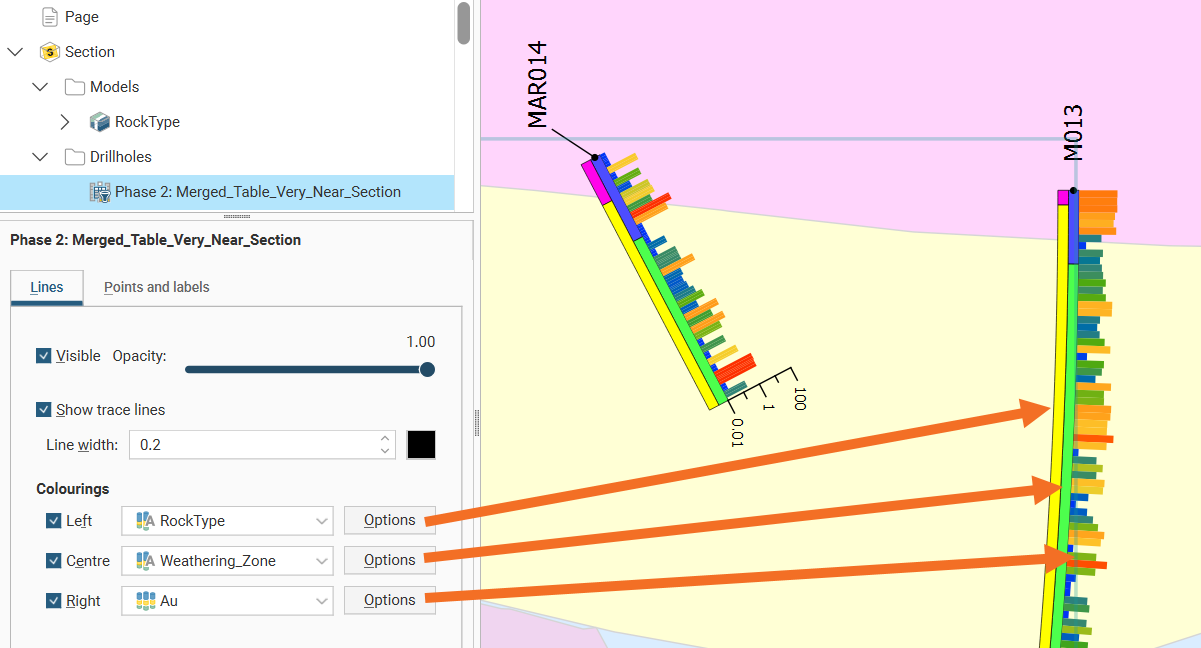
If you select an object populated with drilling data, you will have additional options. Up to three columns of data can be displayed as stripes down the well, and numeric data can even be displayed as a graph. Tick either the Left, Centre or Right positions for the boreholes to enable the visualisation and assign a Colouring according to an interval data selection.
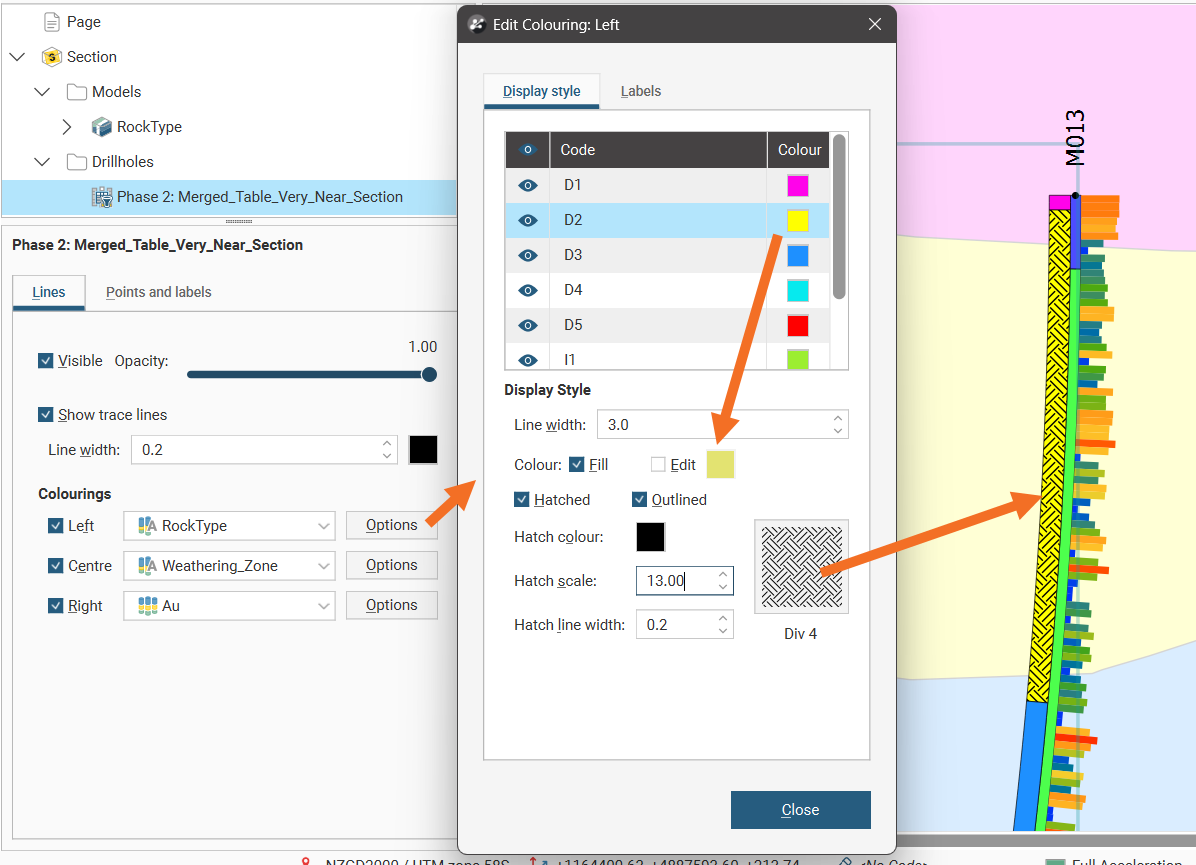
Next to each Colouring, the Options button opens a properties dialog for customisation for each set of interval data. The Line width can be set for each stripe down the well.
For category data, the visibility of each category can be controlled and the colour fill for each category can be overridden by clicking Edit, clicking the colour tile and selecting a new colour using the colour picker. Hatching can be added to the colour or used instead of colour. Click Hatched then the hatching sample to select a hatch style. There are different categories of hatching, including designs intended for specific mineralisations. A search box is provided to make it easier to find specific hatch styles. Note that the Hatch colour, Hatch scale and Hatch line width can all be customised.
For numeric data, a Value filter can be used to restrict the range of data shown in the well stripe.
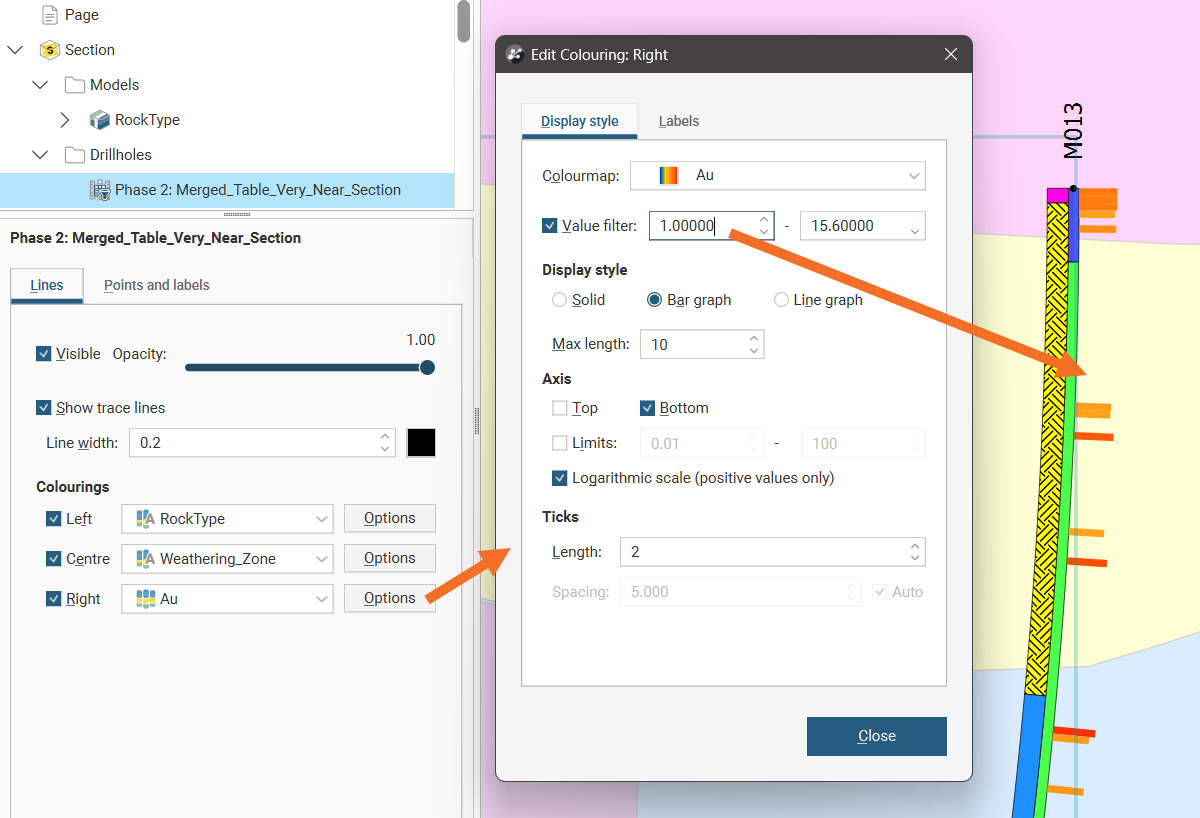
For numeric data, the Display style options are:
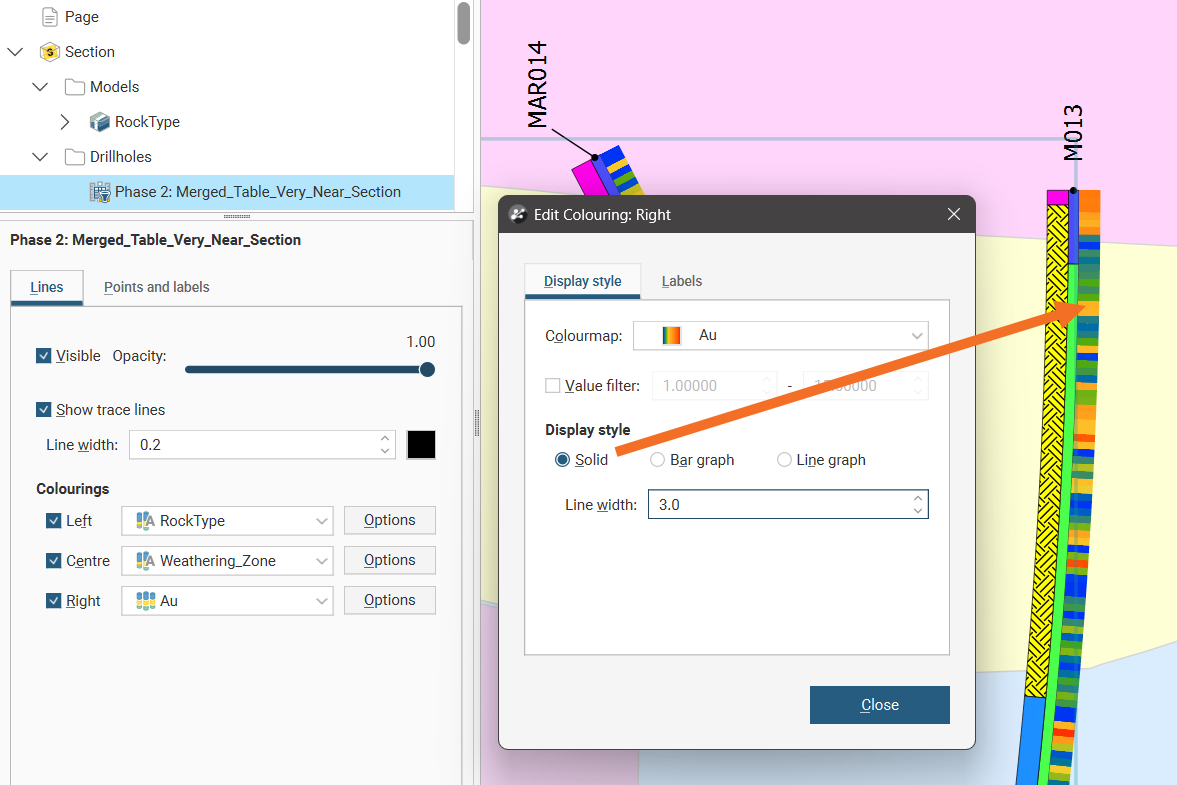
- Solid for a fixed Line width stripe with downhole sample values being indicated by the Colourmap colouring:
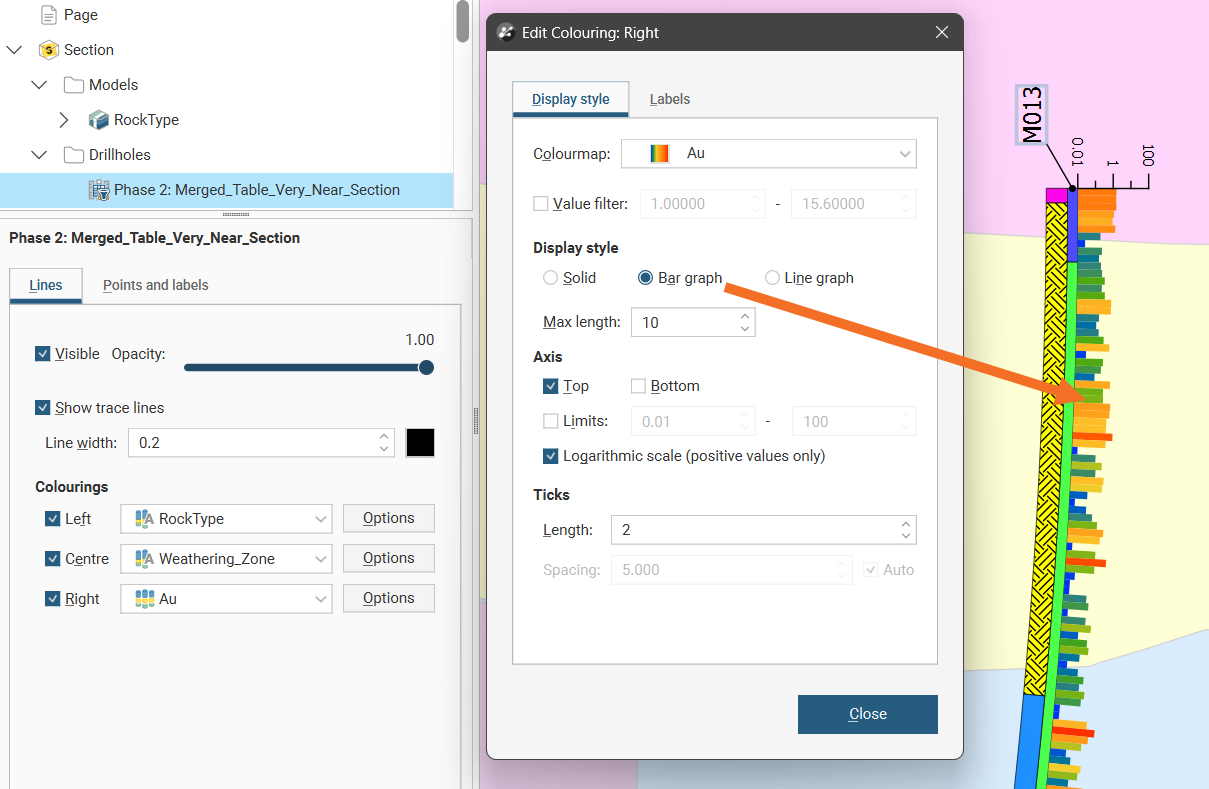
- Bar graph which adds a variable width to create a bar graph running down the well with downhole sample values being indicated by the Colourmap colouring:
- Line graph which changes the visualisation to a line indicating the sample data values:
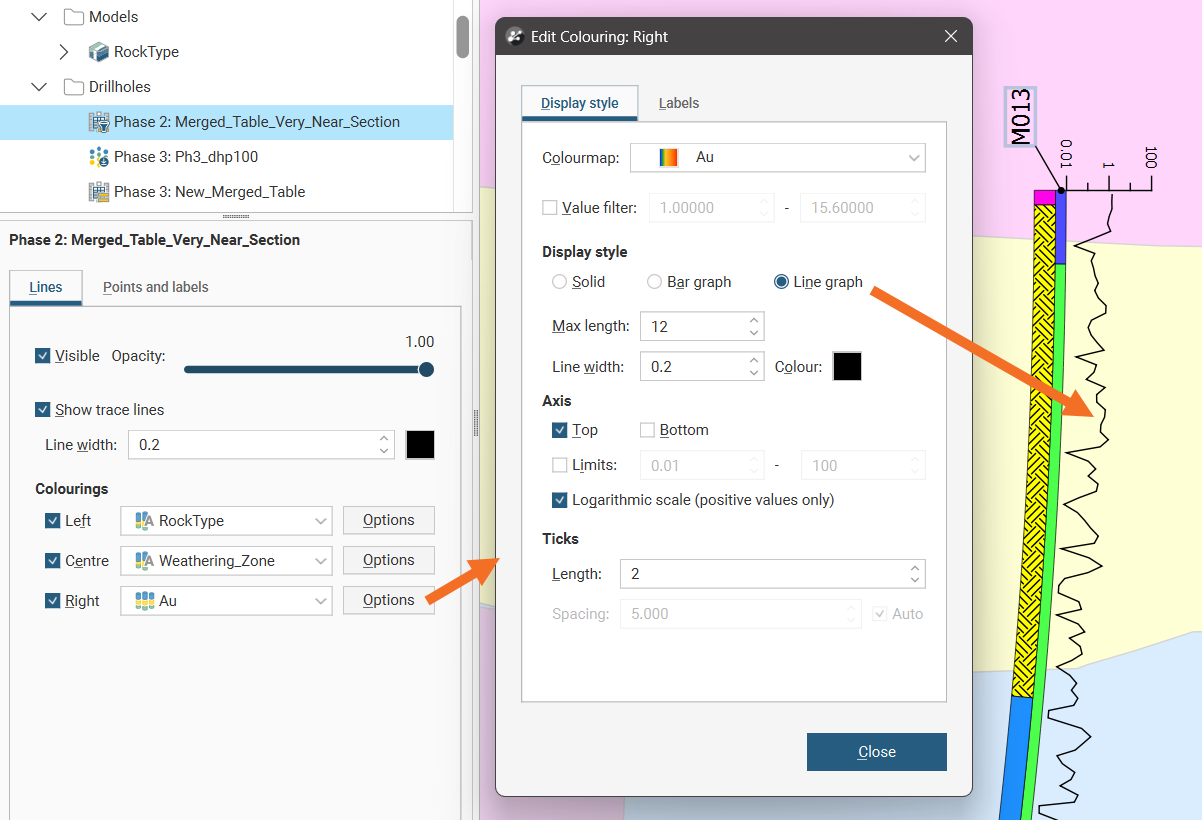
Both bar graph and line graph selections have the option to display an axis at the top or bottom to provide a value scale to the plot. The axis Limits can also be set to a min and max range. Note the parenthetic comment if a Logarithmic scale is enabled: when ticked, only positive values are displayed in the plot. The axis scale can have the Length of the Ticks adjusted. The Spacing can be adjusted when a Logarithmic scale is not being used.
The bar and line graph options are not available for the centre of the well, although the solid option can be used.
Bar graph and Line graph extend out from the well to a specified Max length. Select a Max length that means that displayed data does not interfere with other wells or data displayed on the section layout.
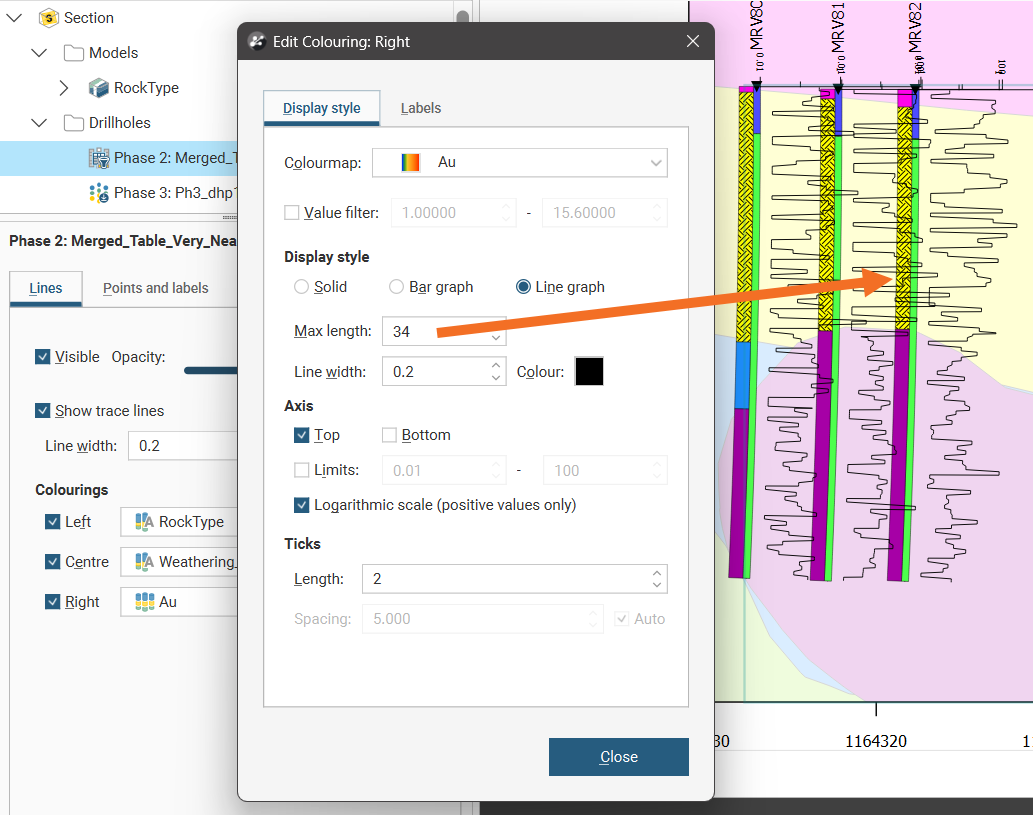
This is especially relevant when two graphs are displayed per well.
The line graph option provides the ability to specify the Line width and Colour of the line. Click the colour tile and select a new colour using the colour picker.
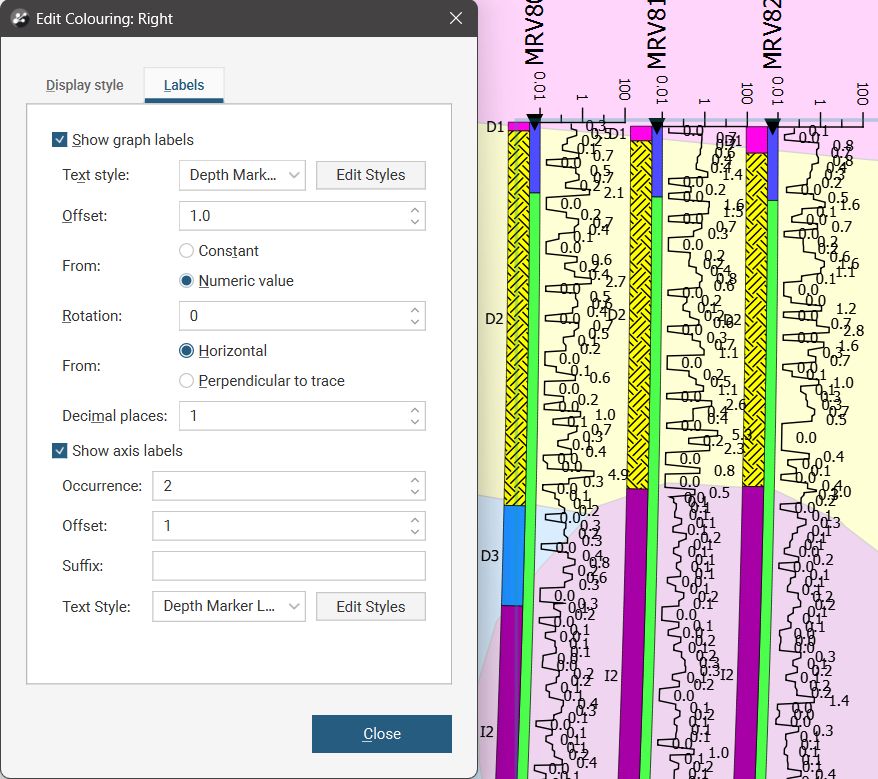
Both category and numeric data Options windows also have a Labels tab. Labels can be shown or hidden using the Show graph labels tickbox and the Text style can be selected from one of the text styles provided and modified using the Edit styles button. The Offset specifies the distance from the well the label will appear. Numeric data labels also add the option of making this offset a Constant distance or adding the Numeric value to the Offset to stagger the labelling according to the data values. The Rotation of the label can be specified so they appear at a tilted angle from the well, and this angle can be specified to be with reference to the Horizontal if the labels should all be parallel, or Perpendicular to trace if the labels should follow the curve of the well.
Numeric labels also have the option to specify the number of Decimal places in the labels. They also have a Show axis label section where the axis can be further adjusted. The Occurrence value controls how often labels will appear. Choose 1 for the label to appear on every tick, 2 for a label to appear on every second tick, and so on. Increasing Offset will move the axis labels away from the axis line, and Suffix can be used to add units alongside the axis label values. You can use the text style selector and the Edit Styles button to customize the axis label characters.
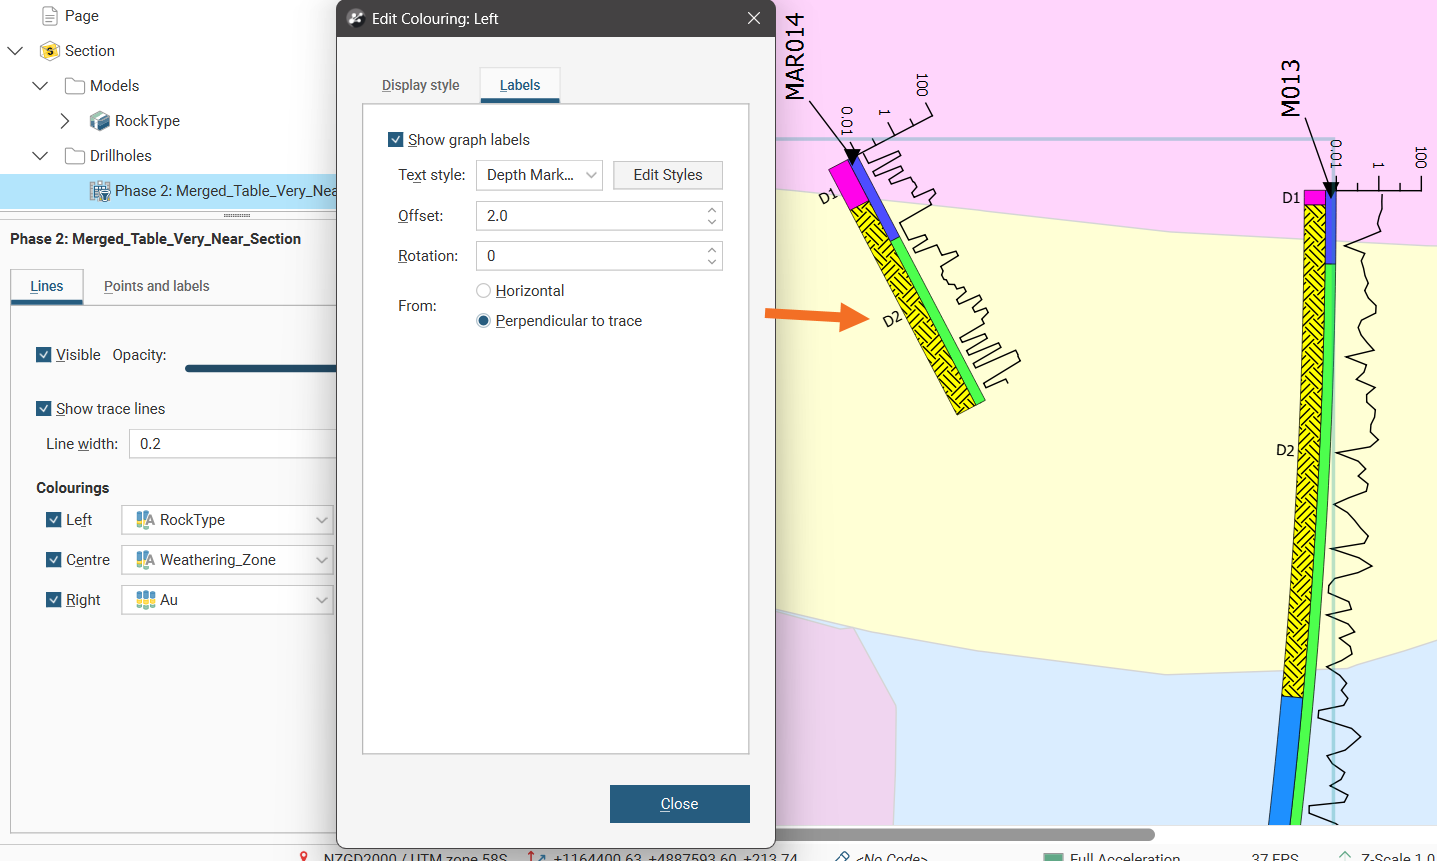
Labelling numeric data values works best for numeric datasets with sparse data sampling because when data samples are close together it can lead to cluttered and overlapping labelling, even when reducing the size of the font used for labelling.
Besides the labels associated with interval data described above, you can also have the following types of labels at different points along the well trace:
- Top labels
- Intercept labels
- Bottom labels
- Depth markers
Additionally, the following points and markers can be customised:
- Collar points
- Intercept points
- Depth markers
An intercept point is where the well intersects the section plane.
Select either a well object or planned well from the Wells folder in the layer tree, then select the Points and labels tab.
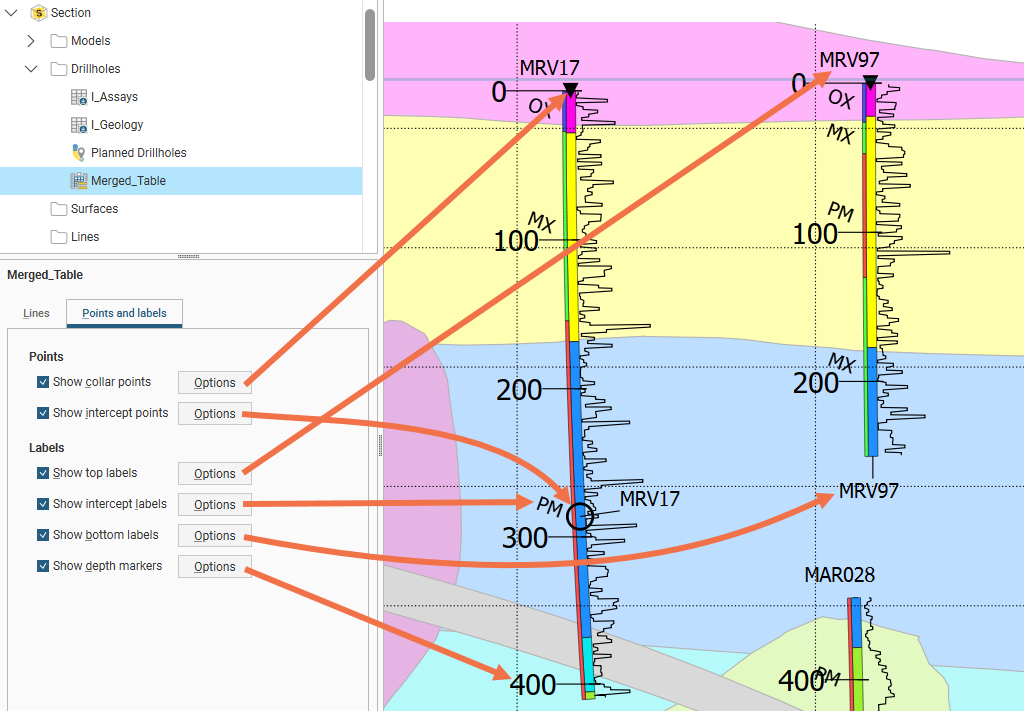
Click Options to change how the labels or points are displayed.
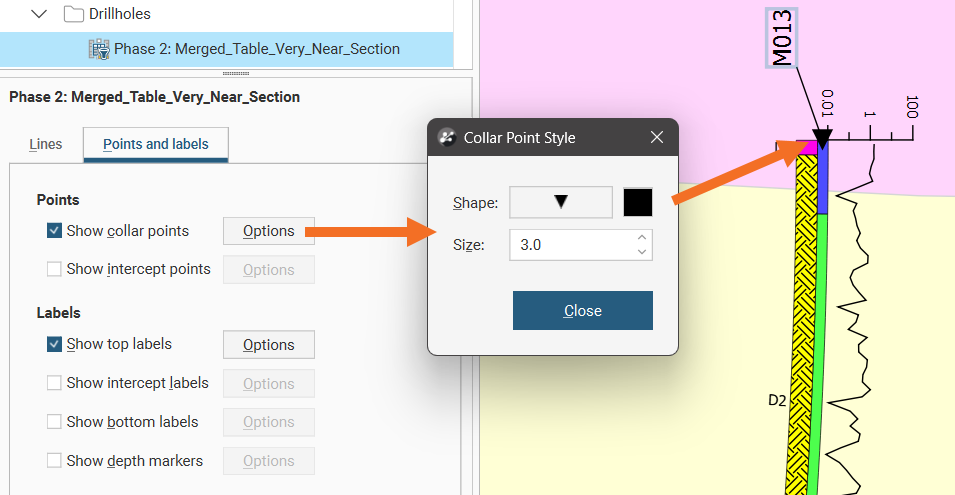
Collar points and intercept points can have the Shape, Size and colour modified. Click the Shape symbol to open a window with 60 different symbol options. Click the colour tile to open a colour picker window.
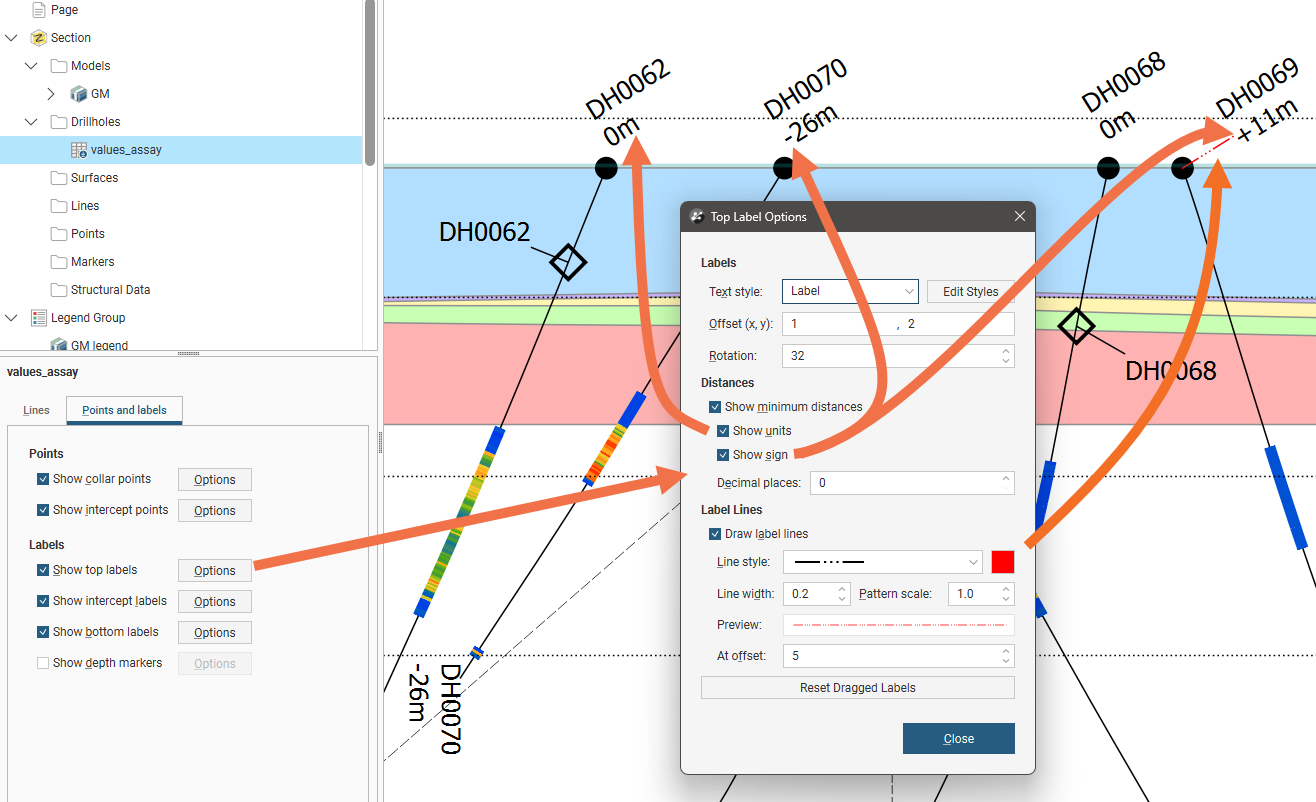
Top, bottom and intercept labels can have the Text style selected from the available styles, or you can click Edit Styles to customise the style. Offset (x, y) positions the label a specified distance away from the point it is referencing. Rotation will put an angle on the label, useful when labels are close together. Top and bottom labels have the option to Show minimum distances for the well from the section plane. You can also choose to Show units and specify the number of Decimal places to show. When enabled, Show sign will add a + in front of the minimum distance if the well is behind the section, and a - in front of the minimum distance if the well is in front of the section. Wells that pass through a section will have a minimum distance of 0 and no sign will be shown.
Labels on sections can be selected and dragged into a new position to avoid overlapping with adjacent items on the section. Click the Reset Dragged Labels button to restore them to the default position.
Labels can have a line connecting them to the point they refer to, if Draw label lines is ticked and once the label is more than the At offset length away from the point. The Line style, Line width, Pattern scale and colour can be customised. A Preview shows what the line will look like on the section.
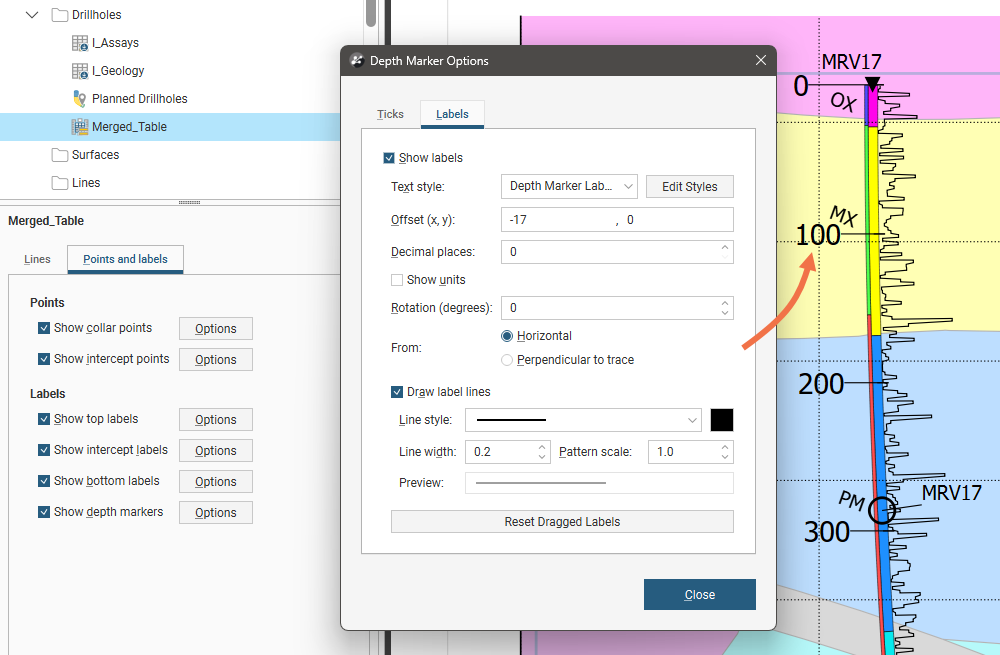
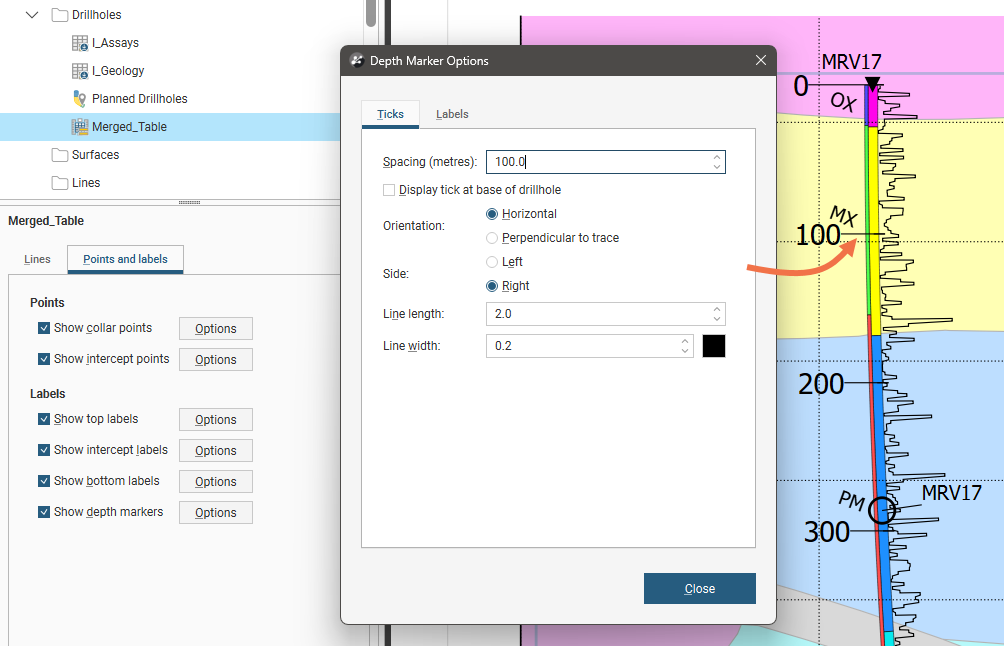
Depth markers display ticks down the length of wells with optional distance labels. On the Ticks tab, the tick Spacing can be specified, and you can choose to optionally Display tick at base ofwell. The Orientation of the tick can be Horizontal to display all the ticks in parallel, or Perpendicular to trace to have the tick orientation follow the curve of the wells. The Side of the well centreline the tick extends from can be specified as Left or Right. The Line length specifies how far from the well centreline the tick extends, and the Line width determines how thick the tick is.
On the depth marker Labels tab, the labels can be enabled using the Show labels tickbox and customised in the same way as other labels using the Text style selector and the Edit Styles button. Offset (x, y) positions the label a specified distance away from the tick it is referencing. Rotation will put an angle on the label. You can also choose to Show units and specify the number of Decimal places to show. Labels can have a line connecting them to the point they refer to, if Draw label lines is ticked. The Line style, Line width, Pattern scale and colour can be customised. A Preview shows what the line will look like on the section. Depth marker labels can be selected and dragged into a new position to avoid overlapping with adjacent items on the section. Click the Reset Dragged Labels button to restore them to the default position.