
Setting the Section Extents and Position
To change the layout’s section properties, click on the Section object in the layout tree. In the Section tab, you can change the scale and units used in the layout and the amount of Vertical Exaggeration:
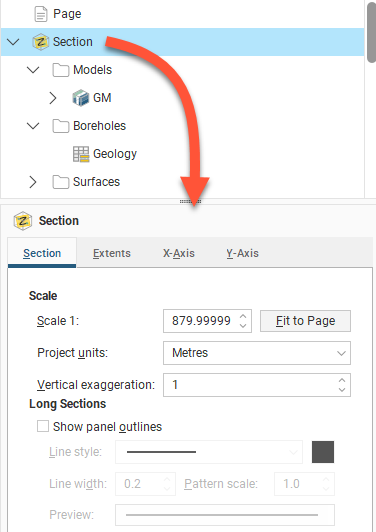
For the Scale, you can enter a specific value to use in displaying the section on the page, or, if you want a specific page size, select Fit to Page to set a scale that best fits the page width.
If you want to change the page size and the margins used, click on the Page object.
In this tab, long sections add further options with a tickbox to Show panel outlines with controls for the Line style, Line width and Pattern scale. Click the colour chip to open a colour picker window. A preview of the panel outline style specified using these fields is displayed below them.
The Extents tab controls some of the details around the section on the section layout, as well as providing section extent constraint options.
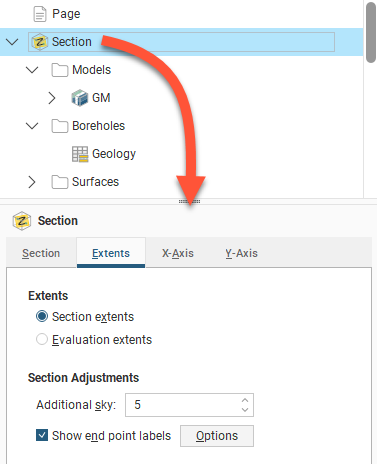
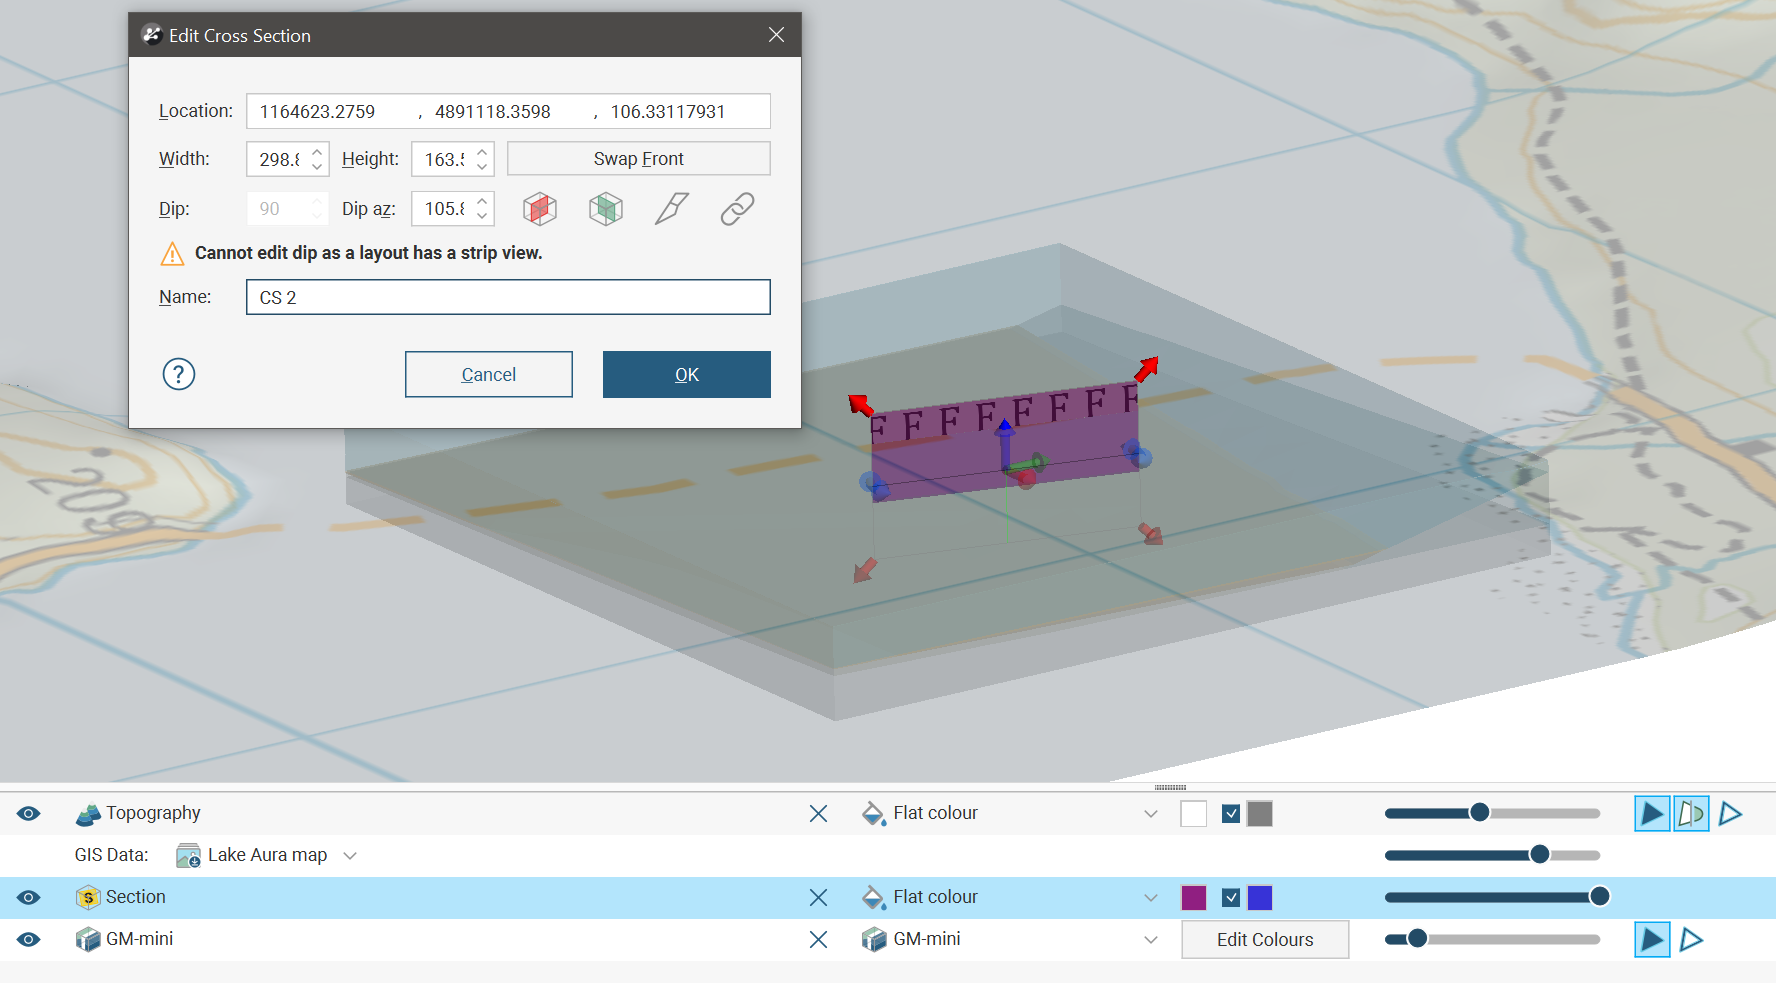
When choosing Section extents, the resulting section will reflect the size of the section extents defined when the section was created:
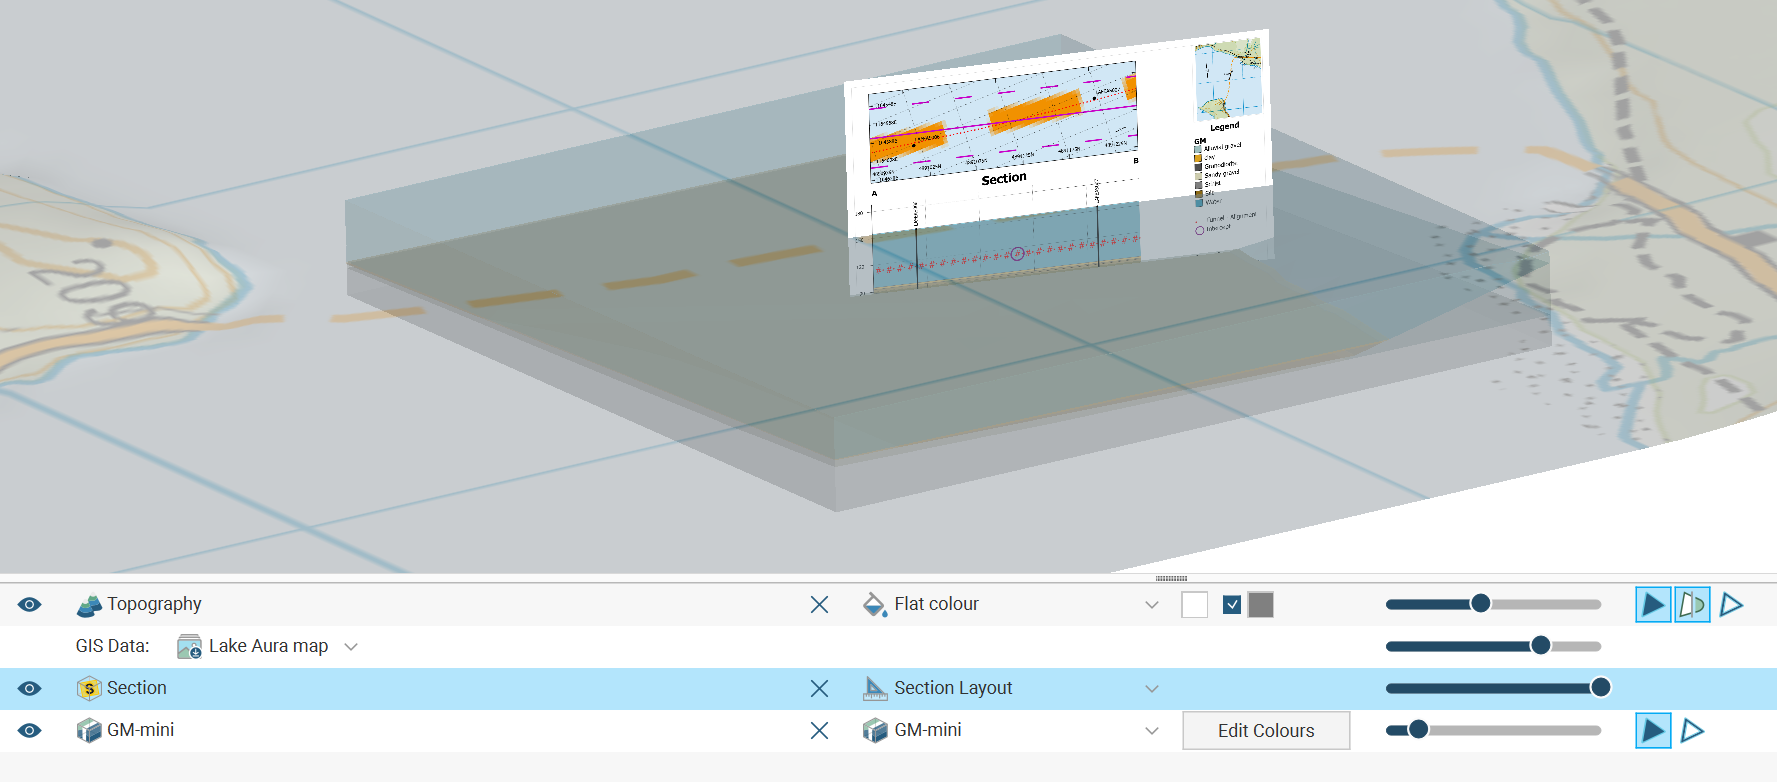
The resulting section displayed on the section layout will match the defined extents for the section.
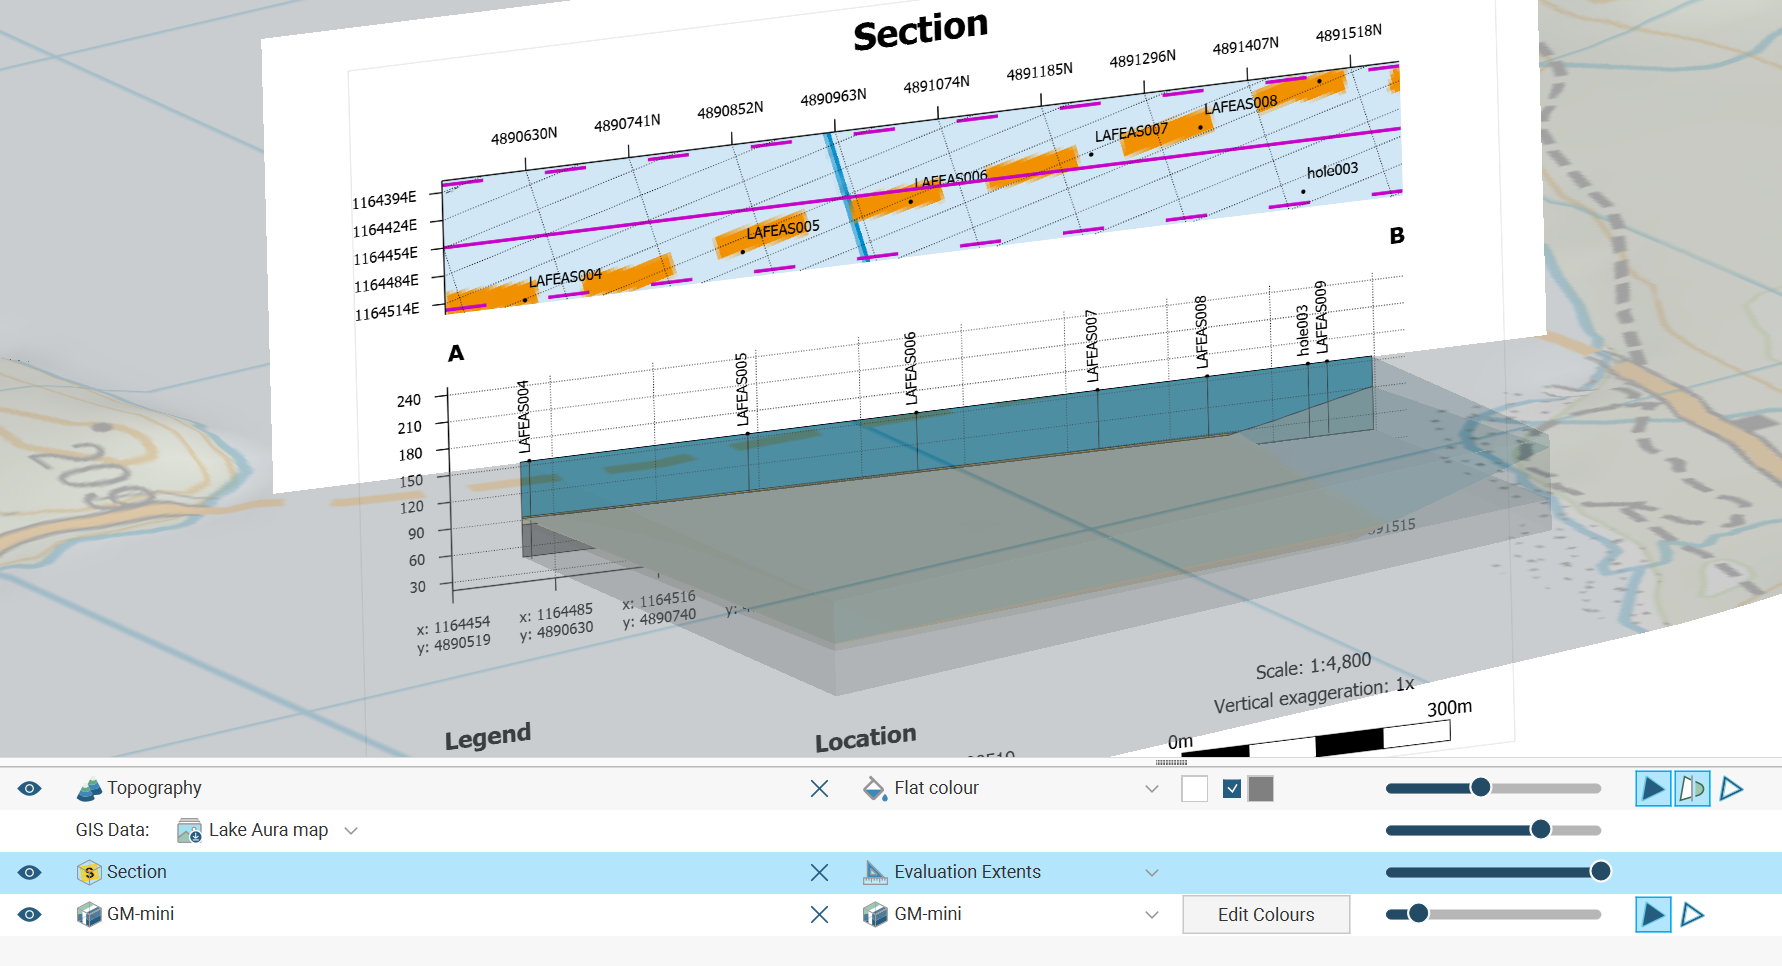
When choosing Evaluation extents, the section will expand out in the plane of the defined section as far as the evaluated objects projected onto the section go. Here the section is stretching out as far as the limits of the geological model allow:
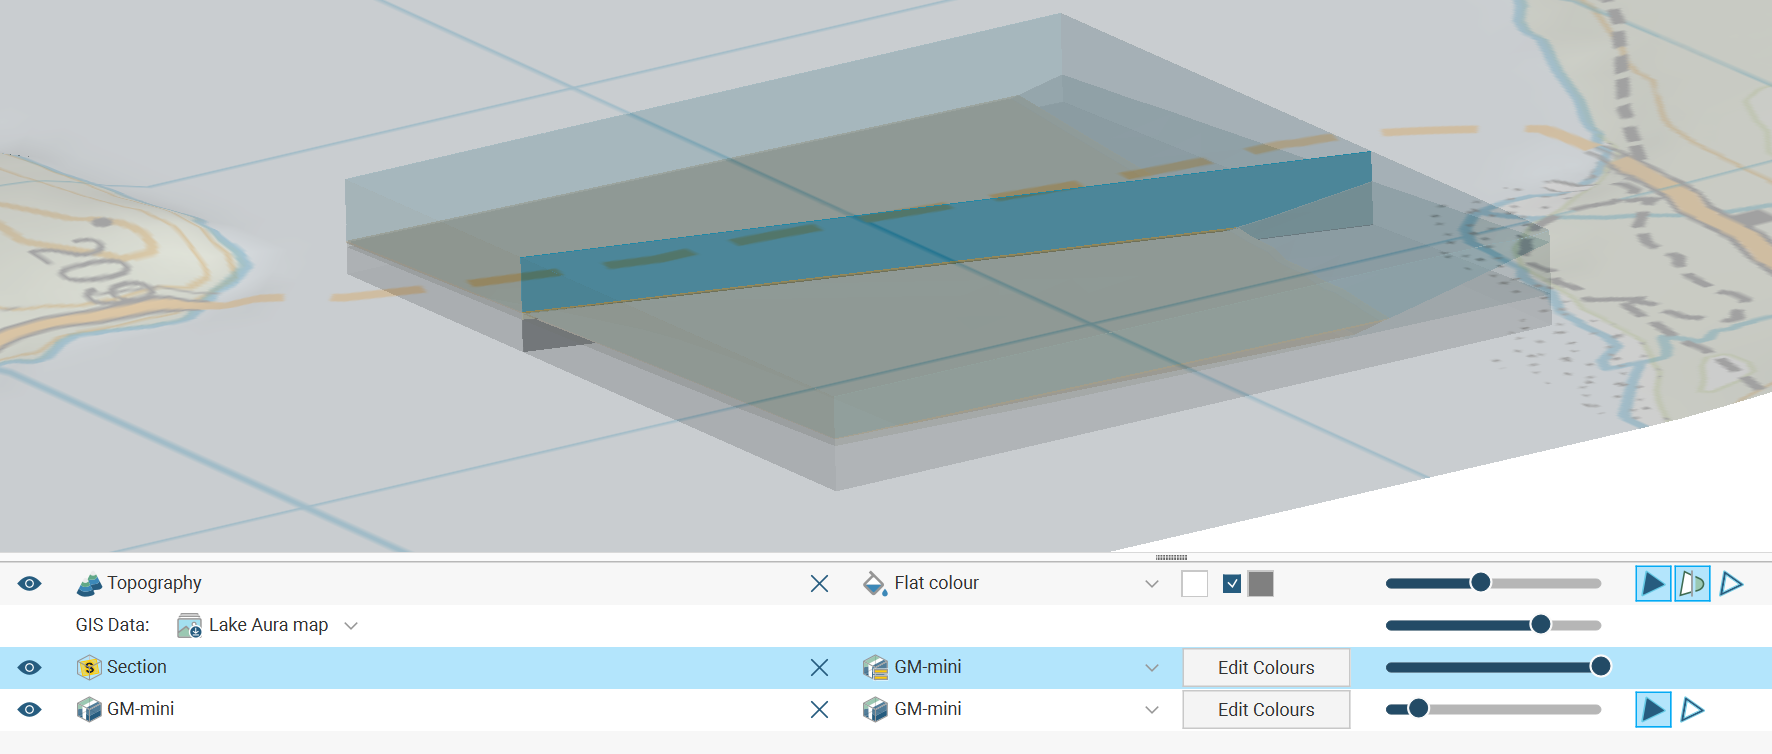
As a result, the section layout, for what is actually the same section definition, needs to be quite different, mostly due to the different size and proportions of the section depending on the Section extents or Evaluation extents selection. Often each option will require the use of a different section layout to cater for the differences.
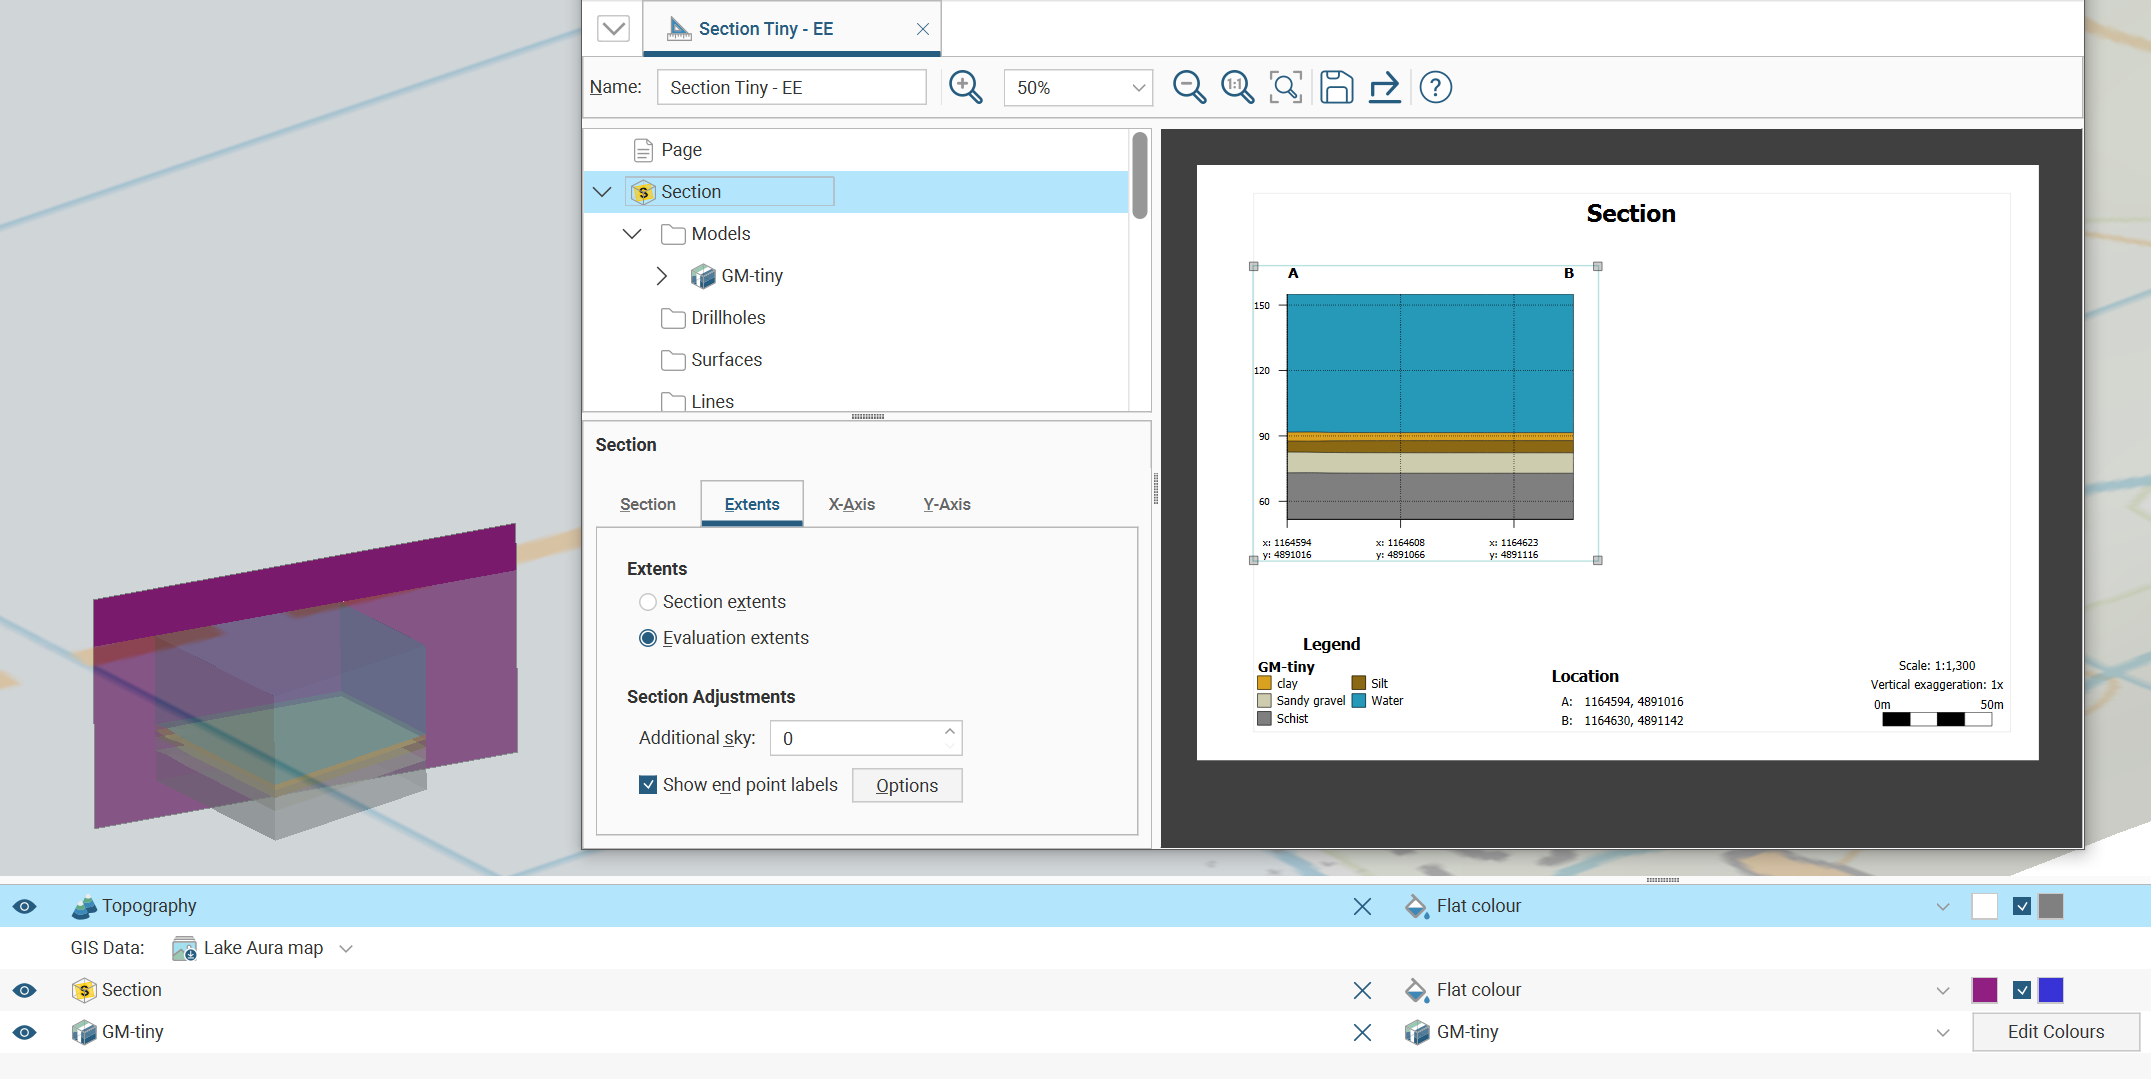
When the evaluations span a region smaller than the defined section extents, the section displayed on the layout is constrained to the smaller area when Evaluation extents is selected:
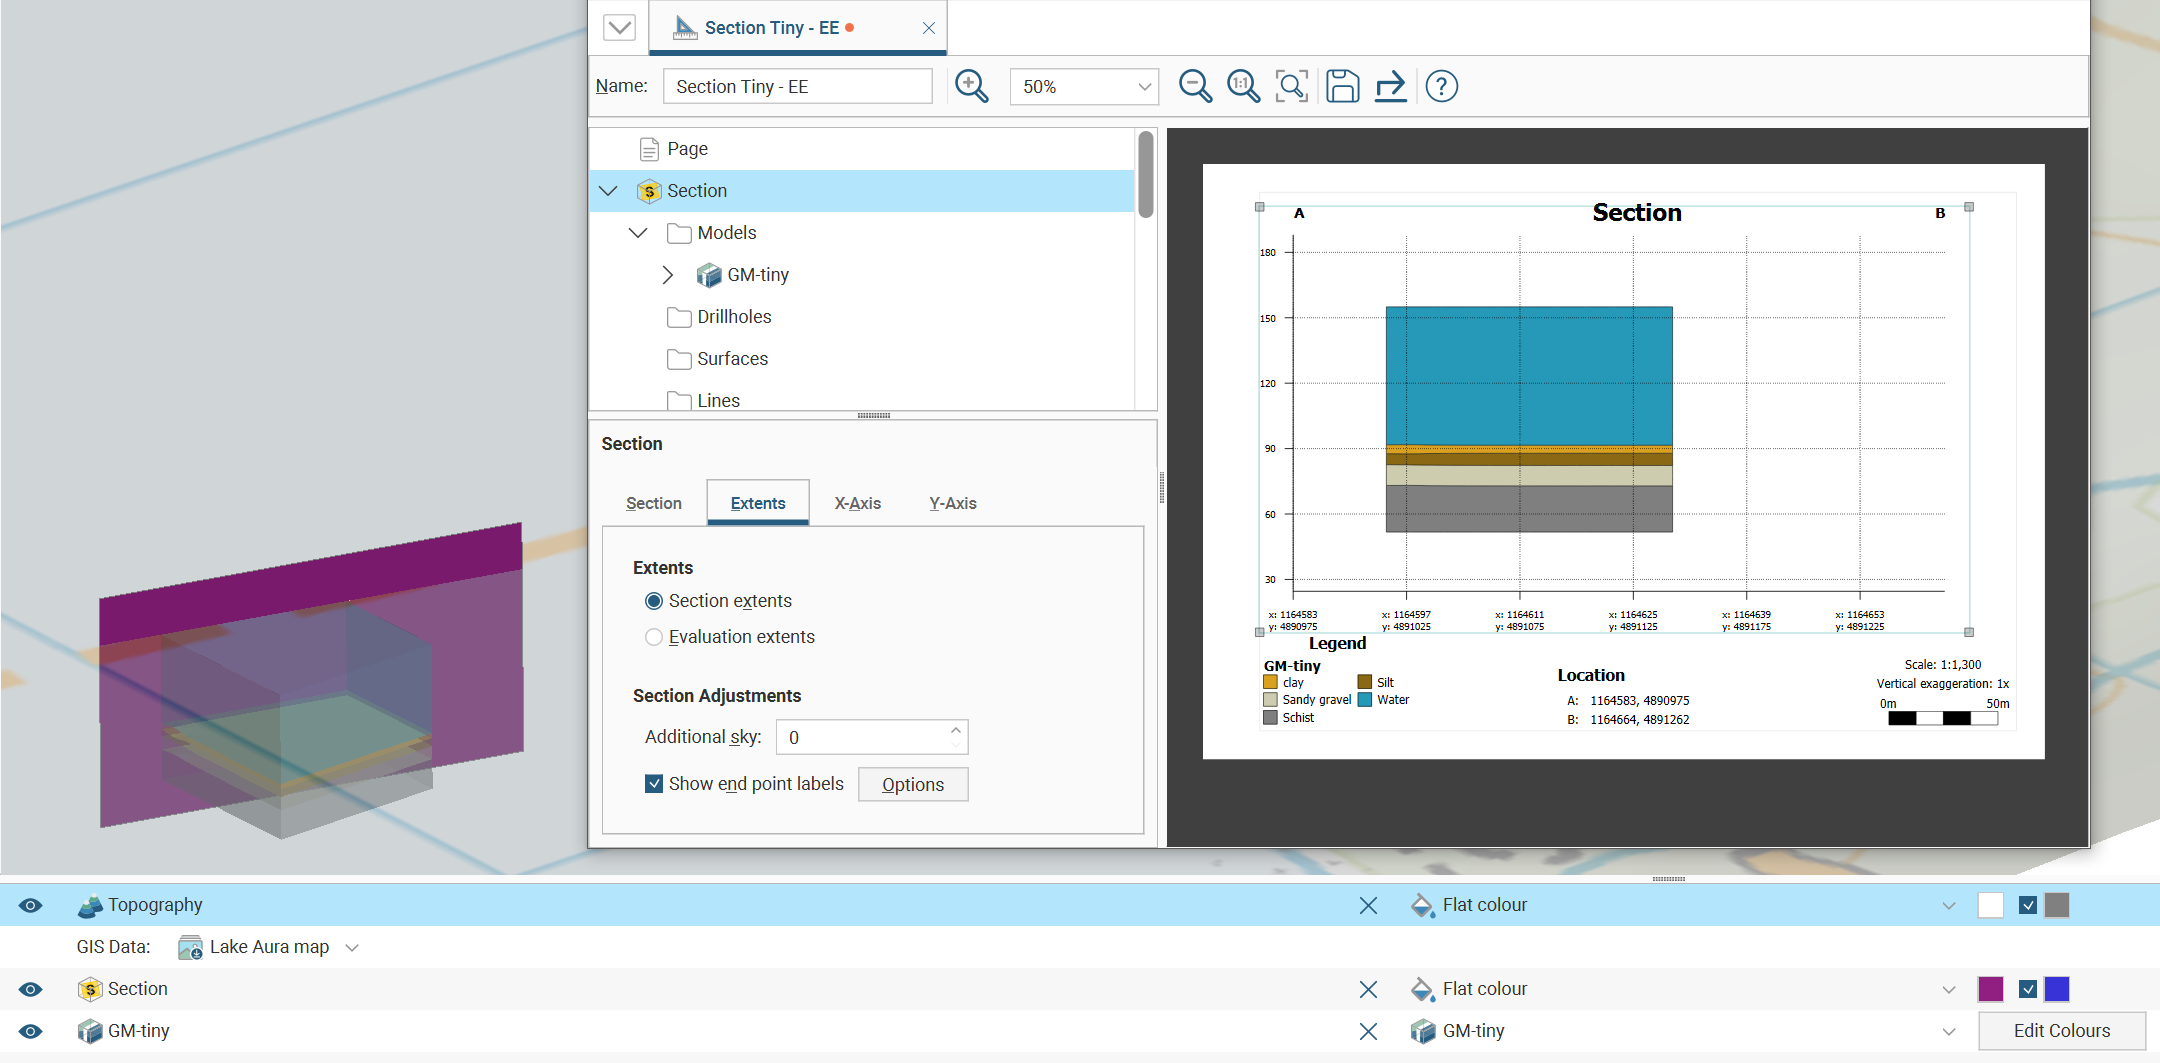
However, if Section extents is selected, the whole section is displayed on the layout, even if the evaluations do not fill the entire section:
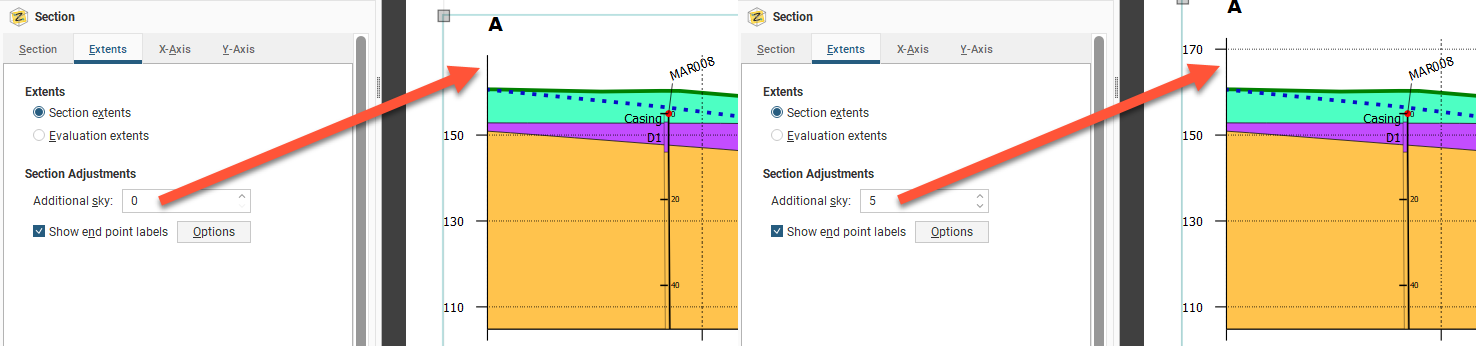
You may wish to add more space above the section, especially if you will be adding wells to the section and need extra space for the collar labels. To do this, change the Additional sky setting. These images show the effects of two different Additional sky settings:
Enable Show end point labels to display the section’s end points as text:
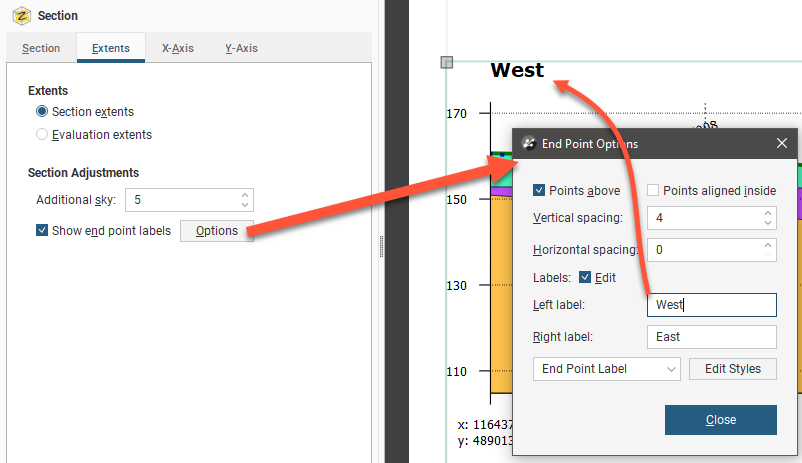
Click Options to change how the end points are displayed relative to the section’s axes.
Edit the text used to display the end points by enabling the Edit box and then changing the text. You can edit the style used for displaying the labels by clicking Edit Styles to change the style or by selecting a different style from the dropdown list.
If you have added a Strip View and/or Plan View to a section layout and you edit the left and right end point labels marking section extents, the end point labels will change on the strip view and plan view also.
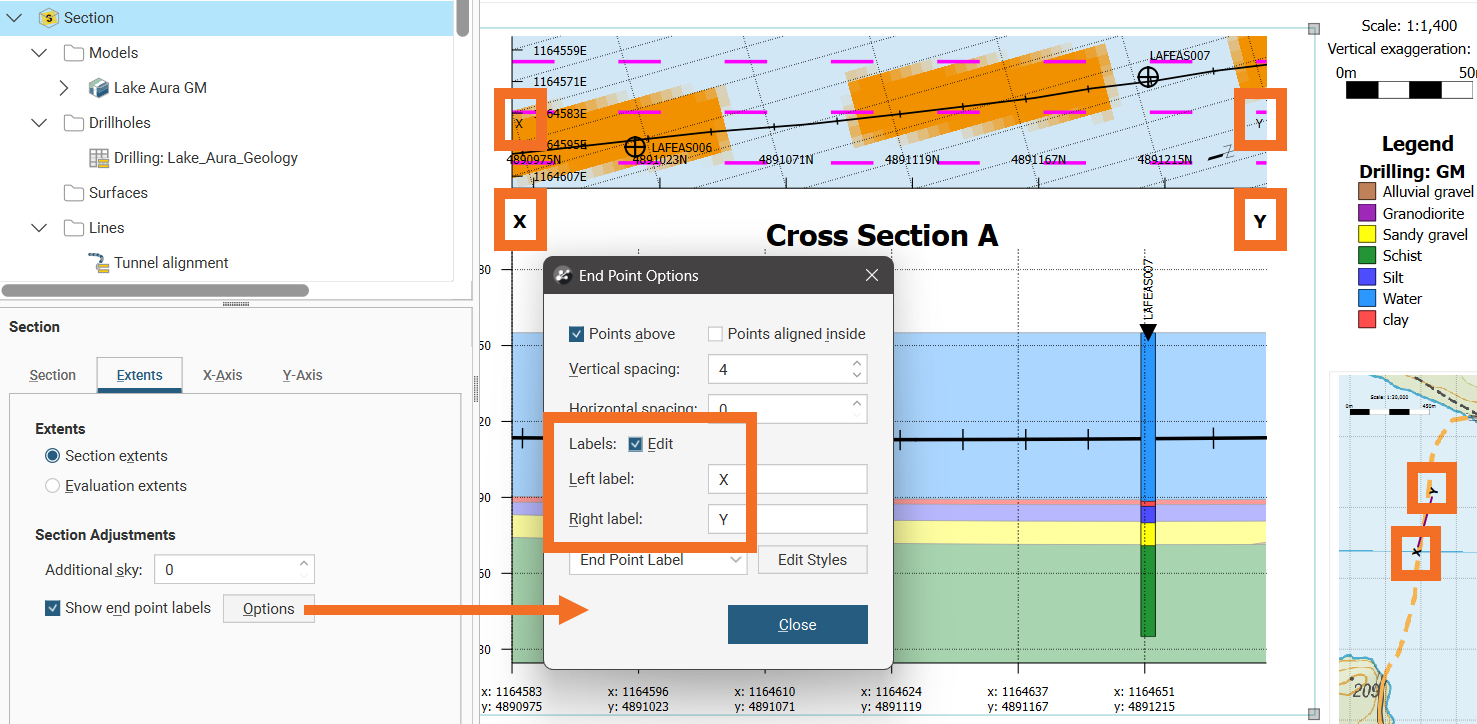
If you change the end point labels using the Plan Views > Strip View > Section Line > Labels > Options or Plan Views > Plan Layout > Section Line > Labels > Options those will only have effects local to the modified setting and the changes will not ripple through to the other labelled objects. Additionally, if you use the plan view layout editor to add a section line to the plan view layout, that object would not be automatically updated by editing the section extents label options in the section layout editor. It is not necessary to add the section line in the plan view layout editor as that object will automatically be added to the plan view when the plan view is added to the section layout.
There are two options that control where the end points are displayed, Points above and Points aligned inside. The Points above setting determines whether the end points are displayed above or beneath the axes. Note here the difference between Points above being disabled and enabled:
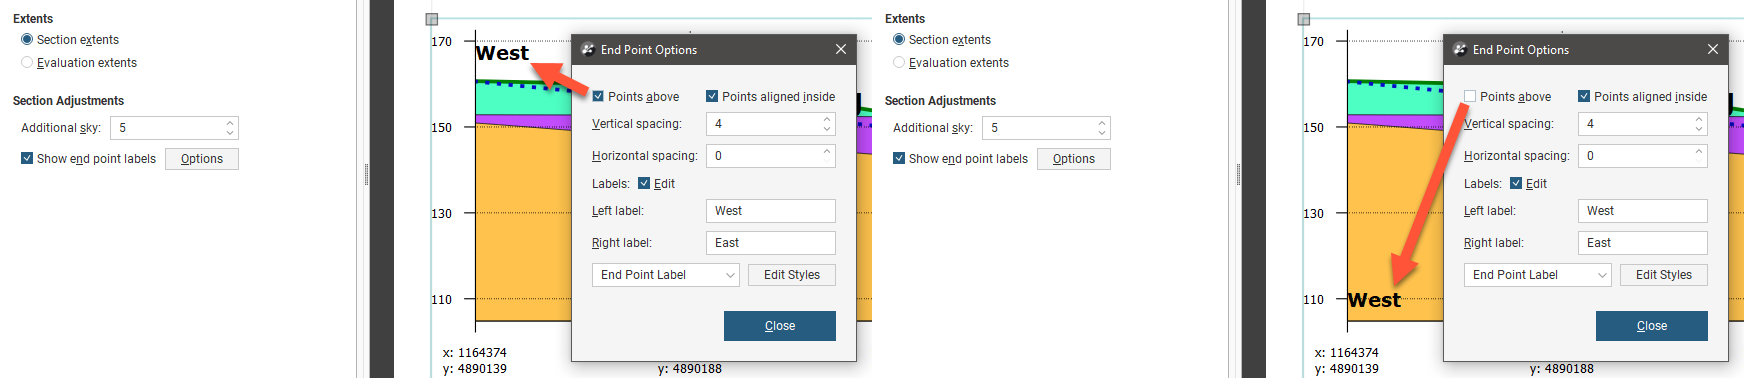
The Points aligned inside setting determines whether the end points are displayed inside or outside the section’s axes:
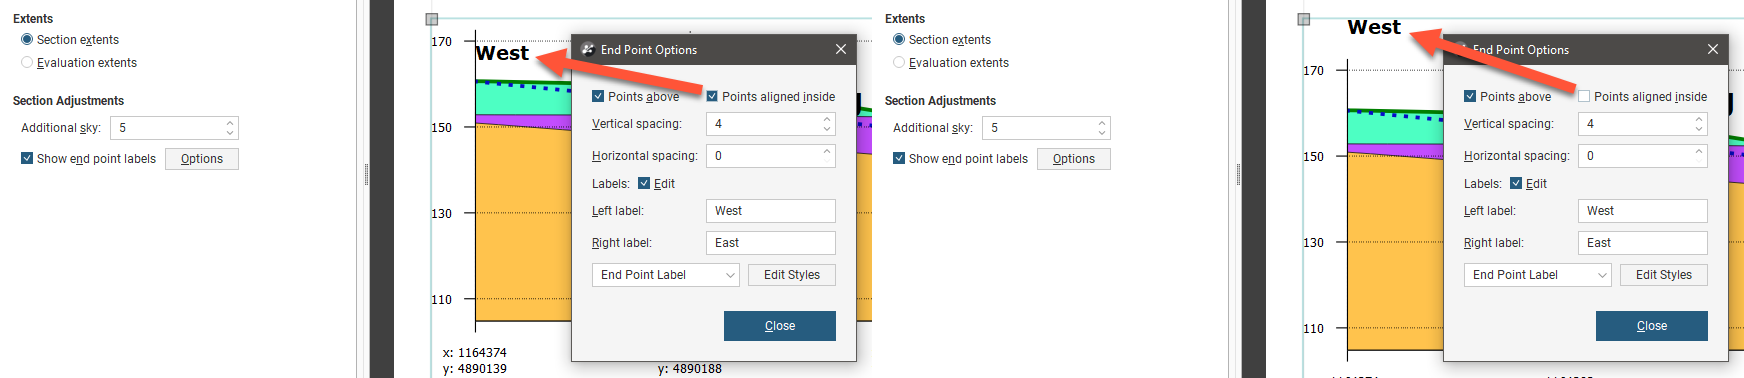
You can also change the spacing between the end point labels and the section axes.
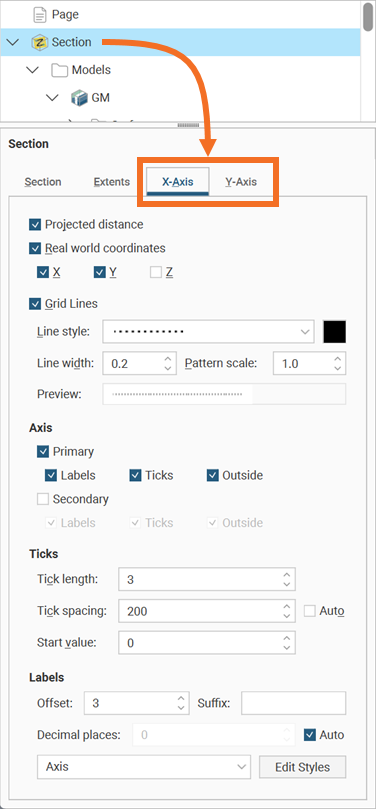
To change how the axes are displayed, click on the either the X-Axis tab or the Y-Axis tab.
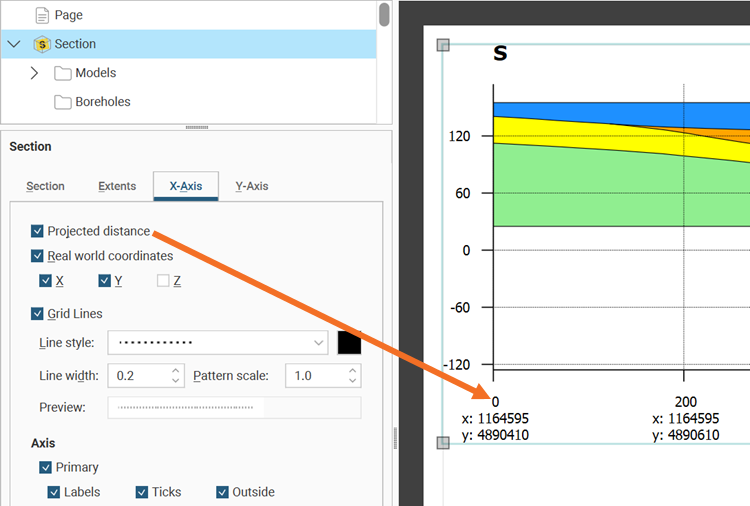
Projected distance will add the distance from the section origin point on each axis marker:
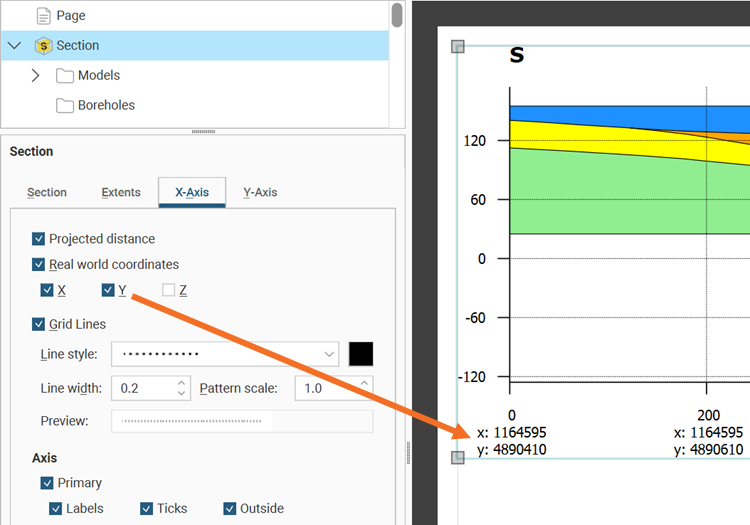
Real world coordinates options control whether x, y and/or z coordinates are displayed on each axis marker:
You can also change how Grid Lines are displayed, including the Line style, Line width, Pattern scale and colour. A Preview is displayed and the grid lines are updated in the section preview.
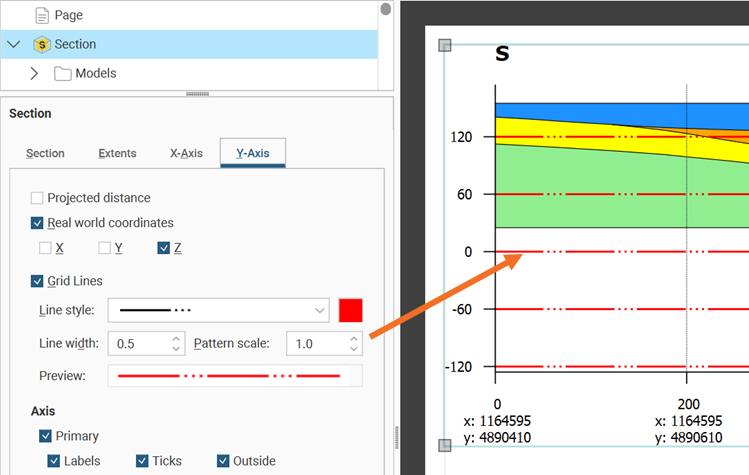
By default, the axes are displayed only on the left-hand side and along the bottom of the section. To display axes along the right-hand side and above the section, tick the Secondary option.
For the Ticks, the Tick length and Tick spacing can be customised. The Y-Axis also has an Initial value with a default that Leapfrog Energy automatically calculates. If you wish to change this, disable Auto and enter the required value.
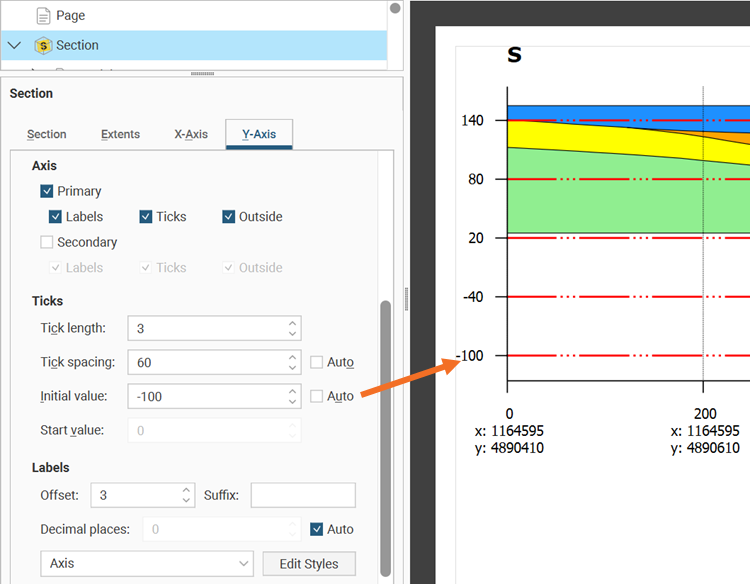
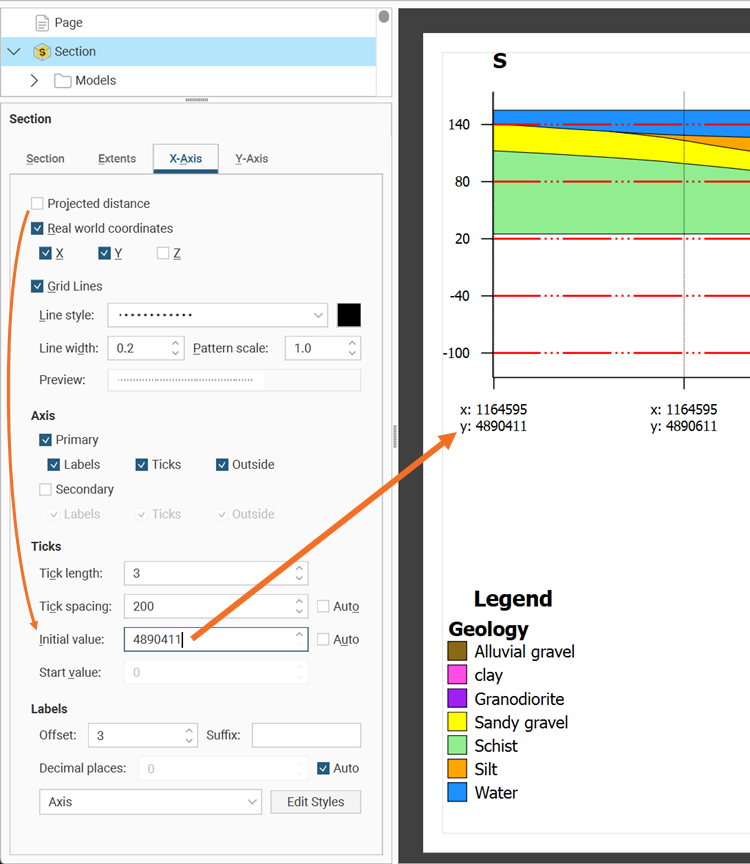
If you wish to set an Initial Value specific value for an axis, you must first disable the Projected distance option, then turn off the Auto setting:
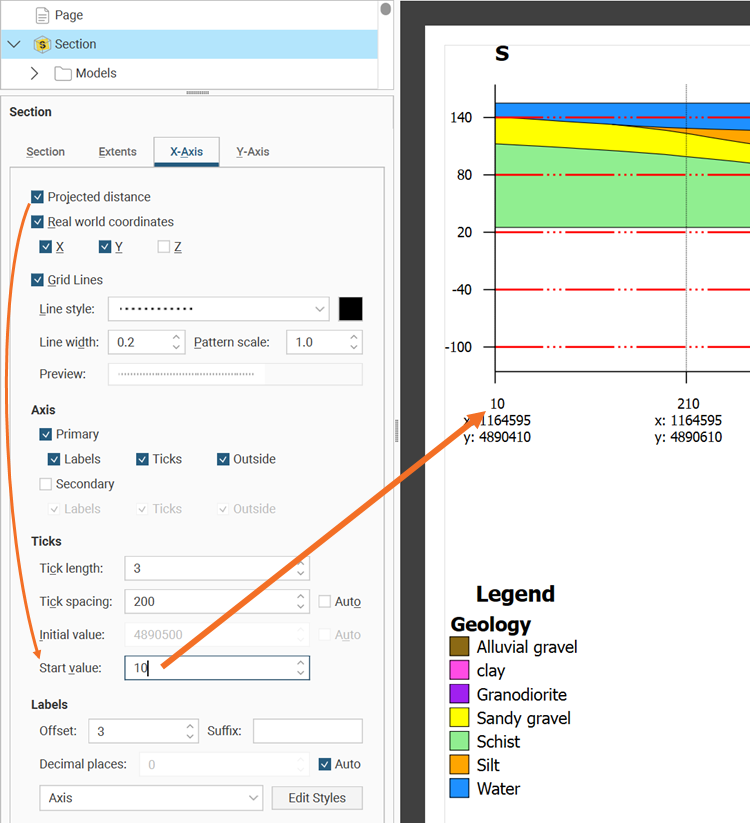
If you wish to set the Start value for an axis, you must first enable the Projected distance option:
Edit the text style used for the axis labels by clicking Edit Styles to change the style or by selecting a different style from the dropdown list.