Strip Views
You can add a strip view to a layout by right-clicking on the Plan View folder in the layout tree and selecting Add Strip View. The section on the section layout will shrink to fit a strip view above the section. Resize and reposition the combined section and strip view on the layout to suit.
Strip views can only be added to vertical sections and cannot be added to layout templates.
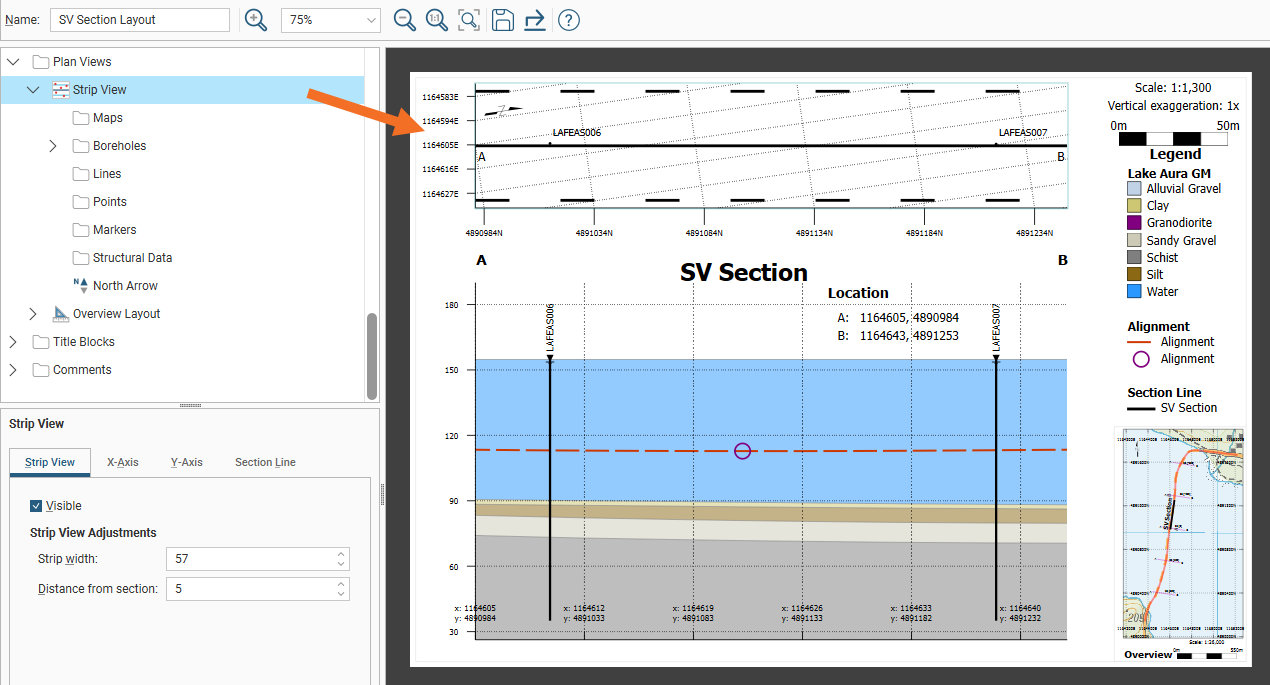
In the Strip View settings, there are four tabs for modifying the strip view: Strip View, X-Axis, Y-Axis and Section Line.
Strip View Adjustments is the first group of fields in the Strip View tab. Strip width specifies the width of the strip in model units. Distance from section can be used to increase or decrease the gap separating the strip view from the section on the layout.
The X-Axis and Y-Axis tabs are identical, other than controlling the appearance of each axis on the strip view.
Easting and Northing tick boxes can be used to select which grid coordinates are keyed to the axis.
Grid Lines can be turned on and off and the appearance of the lines altered using the Line style, Line width and Pattern scale settings. The Preview box provides a handy way to see the effect of the selections.
The Axis group of fields can be used to show or hide the Primary (left or bottom) and Secondary (right or top) axes. You also have individual visibility controls for axis coordinate Labels and Ticks marking the referenced coordinate points along the axis. Tick Outside to position axis labelling outside the strip, or untick it to place the labels inside the strip to reduce whitespace around the strip.
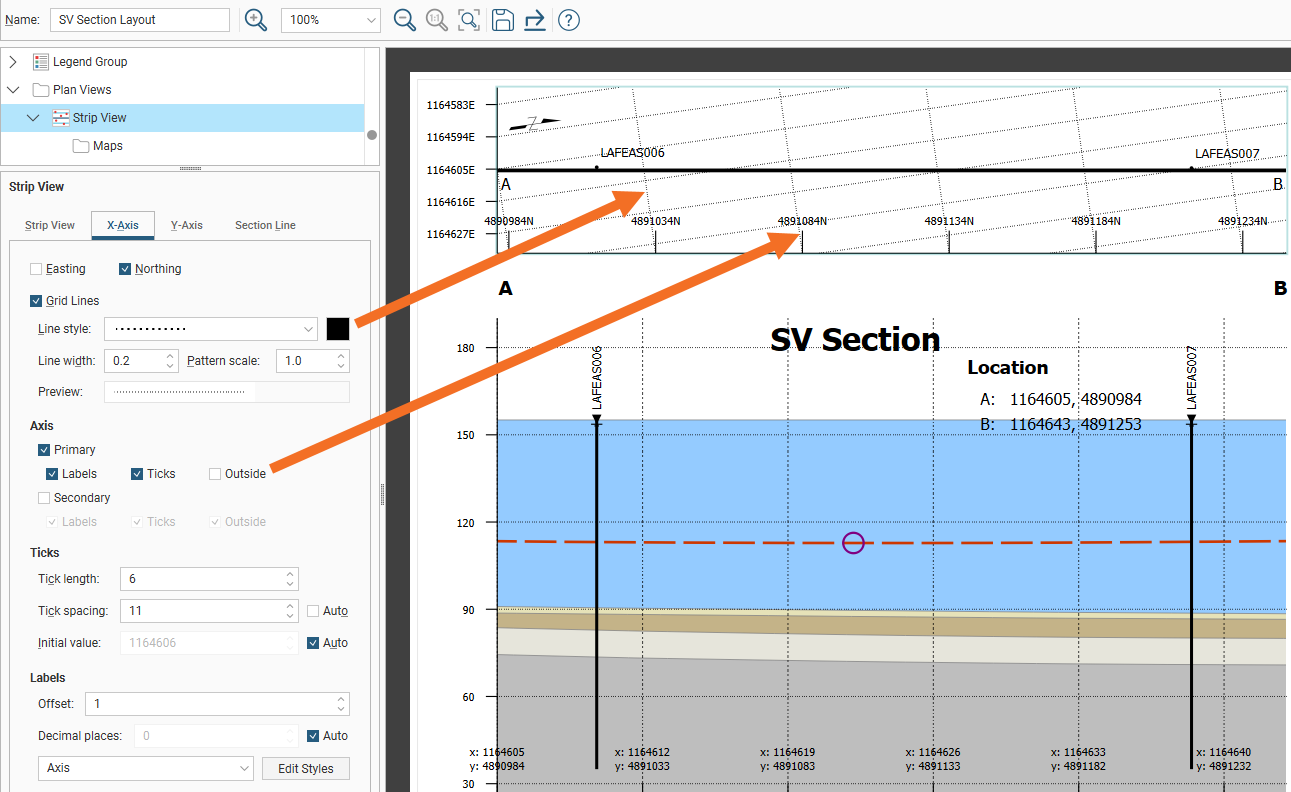
You can also adjust the Tick length, Tick spacing and the Initial value marked on the axis. Alternatively, Tick spacing and Initial value can be set automatically by ticking their Auto tick boxes.
The coordinate Labels can also be customised. The Offset is the gap between the end of the tick and the label. The label’s Decimal places can be set to Auto adjust, or Auto can be unticked and the number of Decimal places specified. The label styling can be selected from the style options available in the dropdown list or it can be customised with the Edit Styles button.
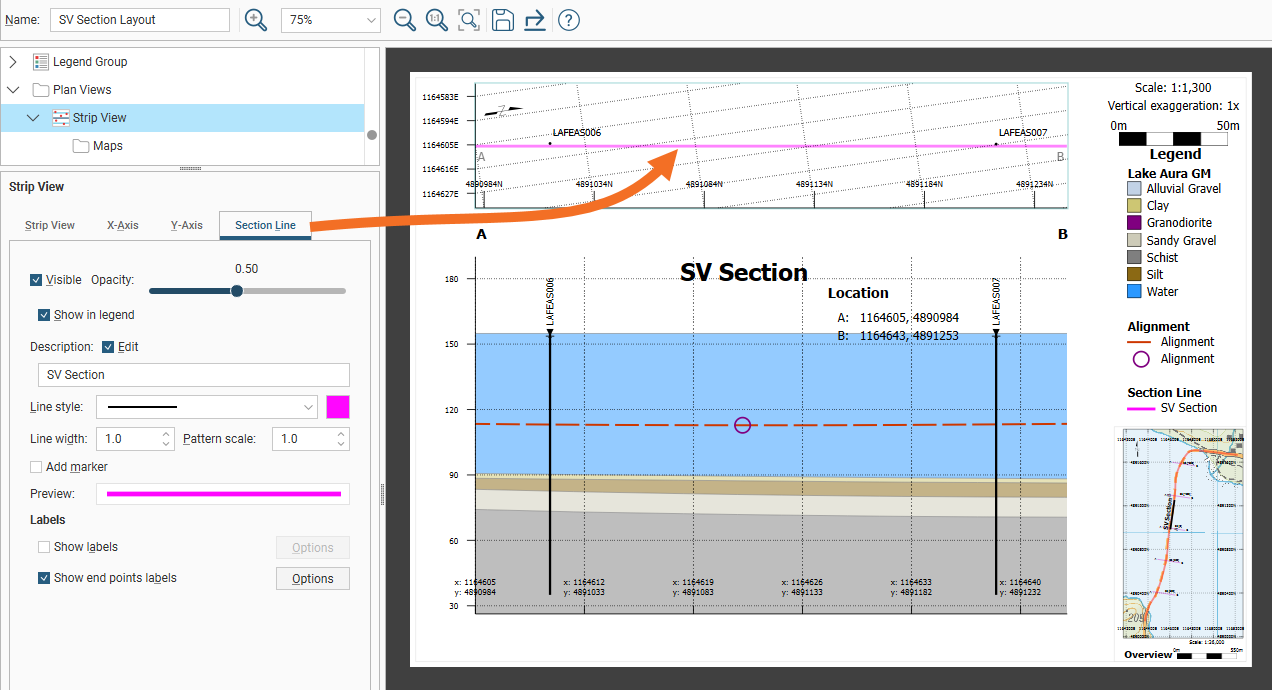
The Section Line tab contains settings for the line that runs through the middle of the strip view.
The section line Visibility can be toggled on or off, and the Opacity of the section line adjusted to suit. The opacity setting does not adjust the opacity of filter distance lines.
Tick the Show in legend box to add the section line to the legend. You can also Edit the Description for the line as it will appear in the legend. This Description will also be used for the strip view label, if enabled.
The Line style, Line width and Pattern scale settings change the central line in the strip view that identifies the location of the section. Click the colour chip to open the colour selector if you wish to change the section line colour. The selected colour will also be applied to the filter distance lines, if enabled.
Click the Add marker box to add marker symbols along the section line. When enabled, you can select the Symbol character, the Marker size, and the frequency of the Occurrence of the symbol along the line. The marker symbols will also be added to the filter distance lines, if enabled.
Tick Show labels to add the Description to the strip view, centred just above the section line. The styling of the label can be adjusted by clicking the Options button to open the Label Options window.
Tick Show end points labels to add the section end points labels to the ends of the strip view. The styling of the label can be adjusted by clicking the Options button to open the End Point Label Options window.
The section line label and the end points labels will change in opacity along with the strip view section line when the Opacity slider is moved.
While models and meshes cannot be evaluated onto a strip view, wells, maps, lines, points and structural data can be added to the strip view. Expand Strip view in the layout tree to see the folders for these objects.
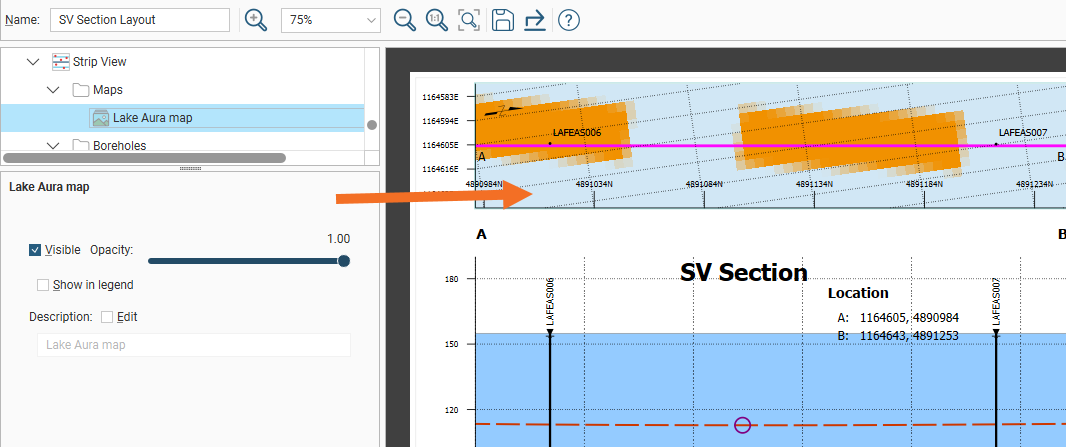
To add a map to a strip view, right-click the Maps folder in the layout tree under Strip View then click Add Maps. The Add Maps Evaluations window will appear with a list of the maps that can be used. Select a map and click OK. Multiple maps can be added, with the maps settings providing the ability to adjust the Opacity to make map combinations visible. Change the layer order of the maps by right-clicking a map in the layout tree and selecting Move Forward, Move Backward, Move to Front or Move to Back. Tick the Edit field to customise the map Description label. Tick Show in legend to add options in the Legend folder in the layout tree to control the map details for the legend. There the map legend visibility can be set, the legend Title for the maps enabled and edited, with the option to add Subtitle Text.
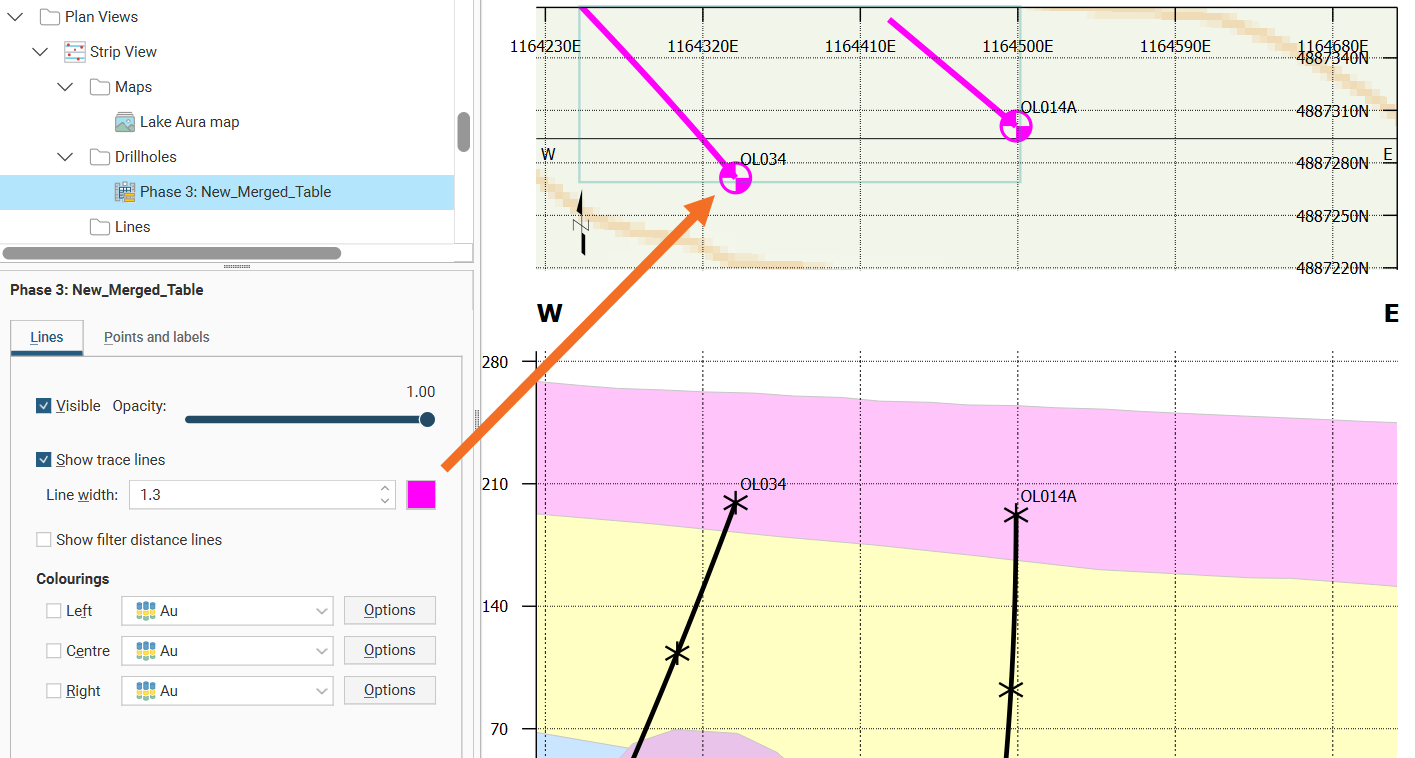
To add wells to a strip view, right-click the Wells folder in the layout tree under Strip View then click Add Well or Add Planned Well. Select the well objects you want projected onto the strip view.
When you click OK, the wells are added to the strip view in the layout tree. They will be flagged with No Selection.
If you add a single well table, the Select Well window will automatically appear to prompt the selection of at least one well. Otherwise, double-click on a well object in the strip view section to open the Select Wellwindow.
This window can also be opened by right-clicking on the Wells object in the strip view and selecting Projection settings.
Enabling the Filter by minimum distance to section plane value determines the limit for the projection of the wells onto the section based on the minimum distance from any point on the well trace to the section plane.
Use the check boxes next to each well in the list to determine which should be projected. The check box next to Hole ID will enable or disable all of the wells.
Wells added to the strip view can be customised in the same way as wells added to the section.
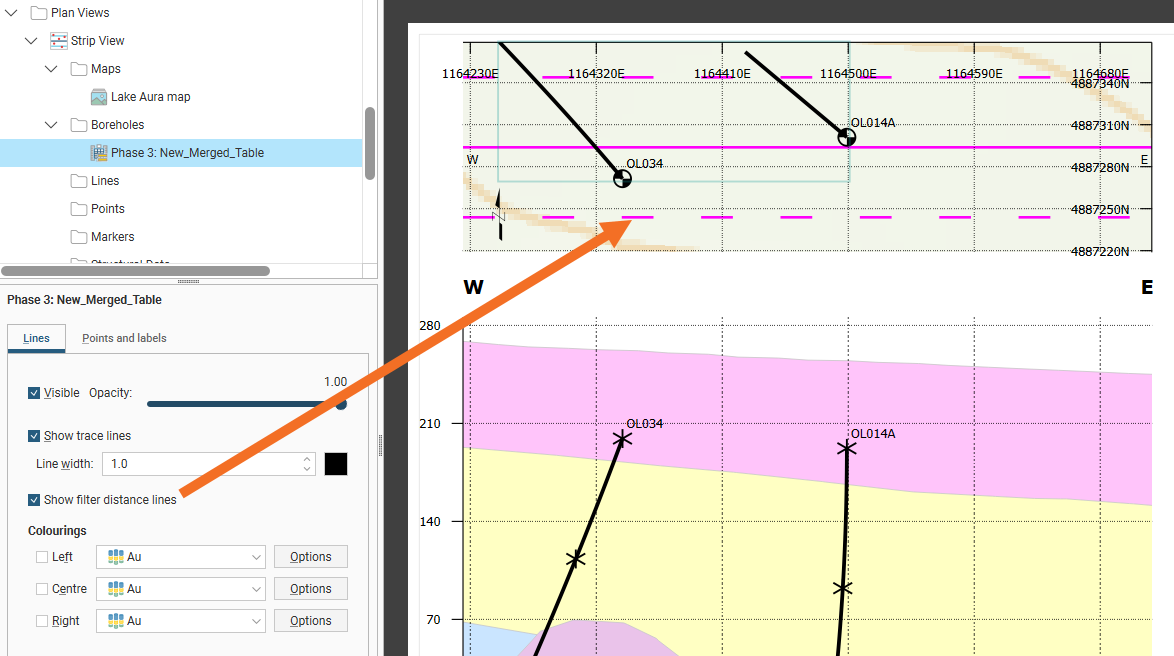
Enable Show filter distance lines to add dashed lines either side of the central section line that shows the Filter by minimum distance to section plane value set when wells were added to the strip view. If the dotted lines do not show up when the Show filter distance lines box is ticked, you may need to increase the Strip width value so the strip is wide enough.
Filter distance lines inherit styling from the section line styling in Plan Views > Strip View > Section Line.
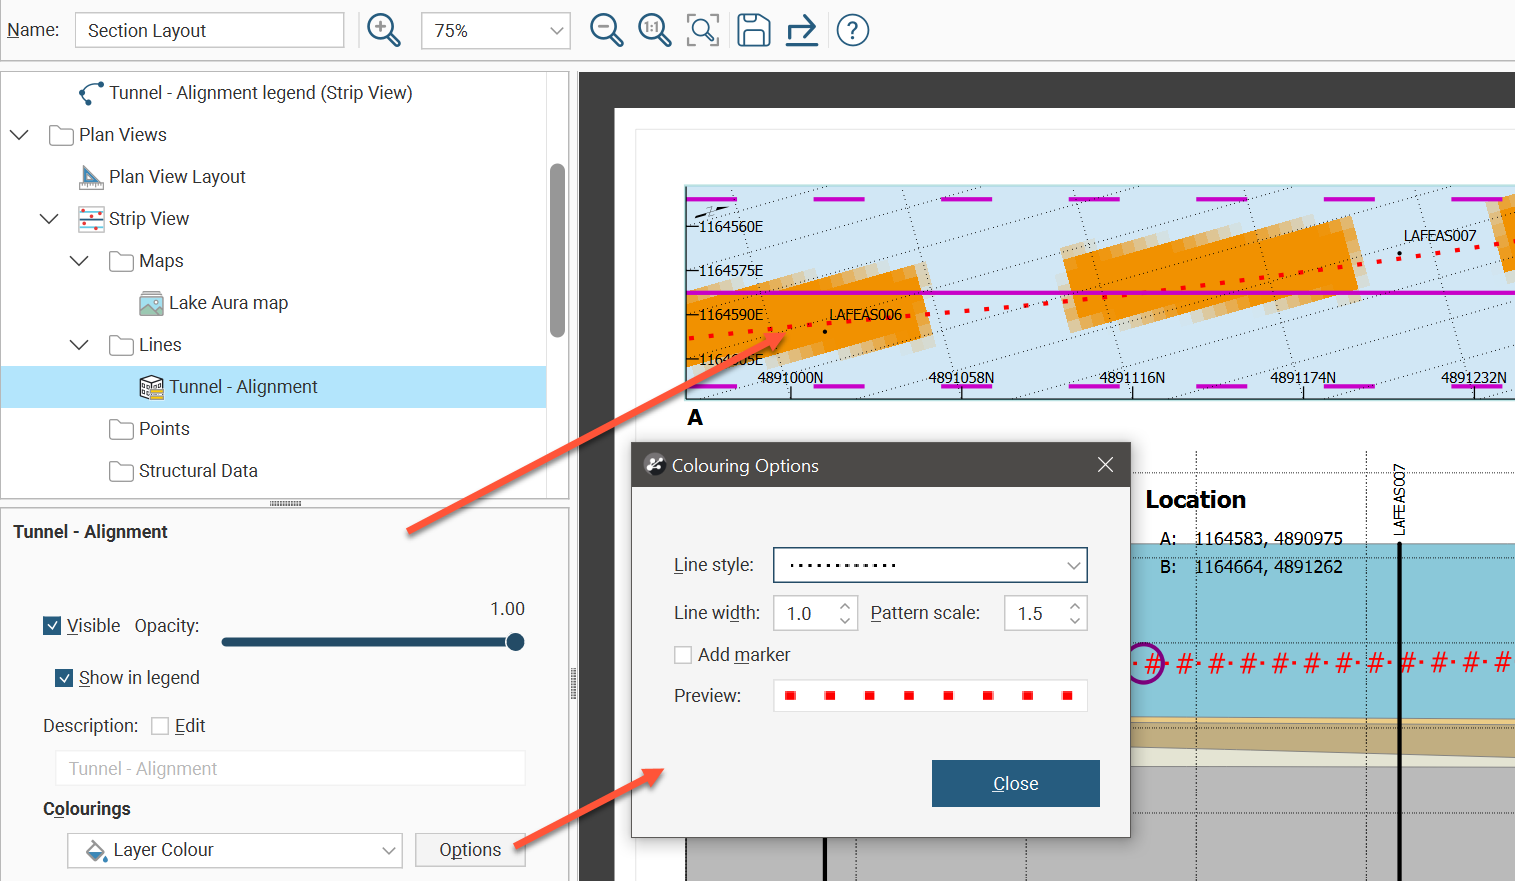
To add lines to a strip view, right-click the Lines folder in the layout tree under Strip View then click Add Line.The Add Line Evaluations window will appear with a list of lines that can be used. Select lines and click OK. The lines settings provide the ability to adjust the Opacity to make line combinations visible. Change the layer order of the lines by right-clicking a line in the layout tree and selecting Move Forward, Move Backward, Move to Front or Move to Back. Tick the Edit field to customise the line Description label. Tick Show in legend to add options in the Legend folder in the layout tree to control the line details for the legend. There the line legend visibility can be set, the legend Title for the lines enabled and edited, with the option to add Subtitle Text. Besides the Flat colour option in Colourings, the dropdown list also provides the Layer Colour option. Select layer colour when you want the colouring of the line to match the line in the 3D scene, changing when the line colouring is changed in the shape list. To specify the line colour when Flat colour is selected, click Options, then in the Colouring Options window, click the colour tile and use the colour picker to select a new colour. The Colouring Options window also allows both Flat colour and Layer Colour options to customise the Line style, Line weight, Pattern scale, and provides the Add marker option to insert symbols along the line pattern.
To add points to a strip view, right-click the Points folder in the layout tree under Strip View then click Add Points.The Add Points window will appear with a list of points tables that can be used. Select points tables and click OK. Each will likely be flagged with a No Selection warning. Double-click the points table in the layout tree to see the Select Points for Section window. Use the table to select individual points to display, or tick the tickbox in the table header to select all the points. Use the Filter by minimum distance to section plane tickbox to filter and show only points within the specified distance to the section plane.
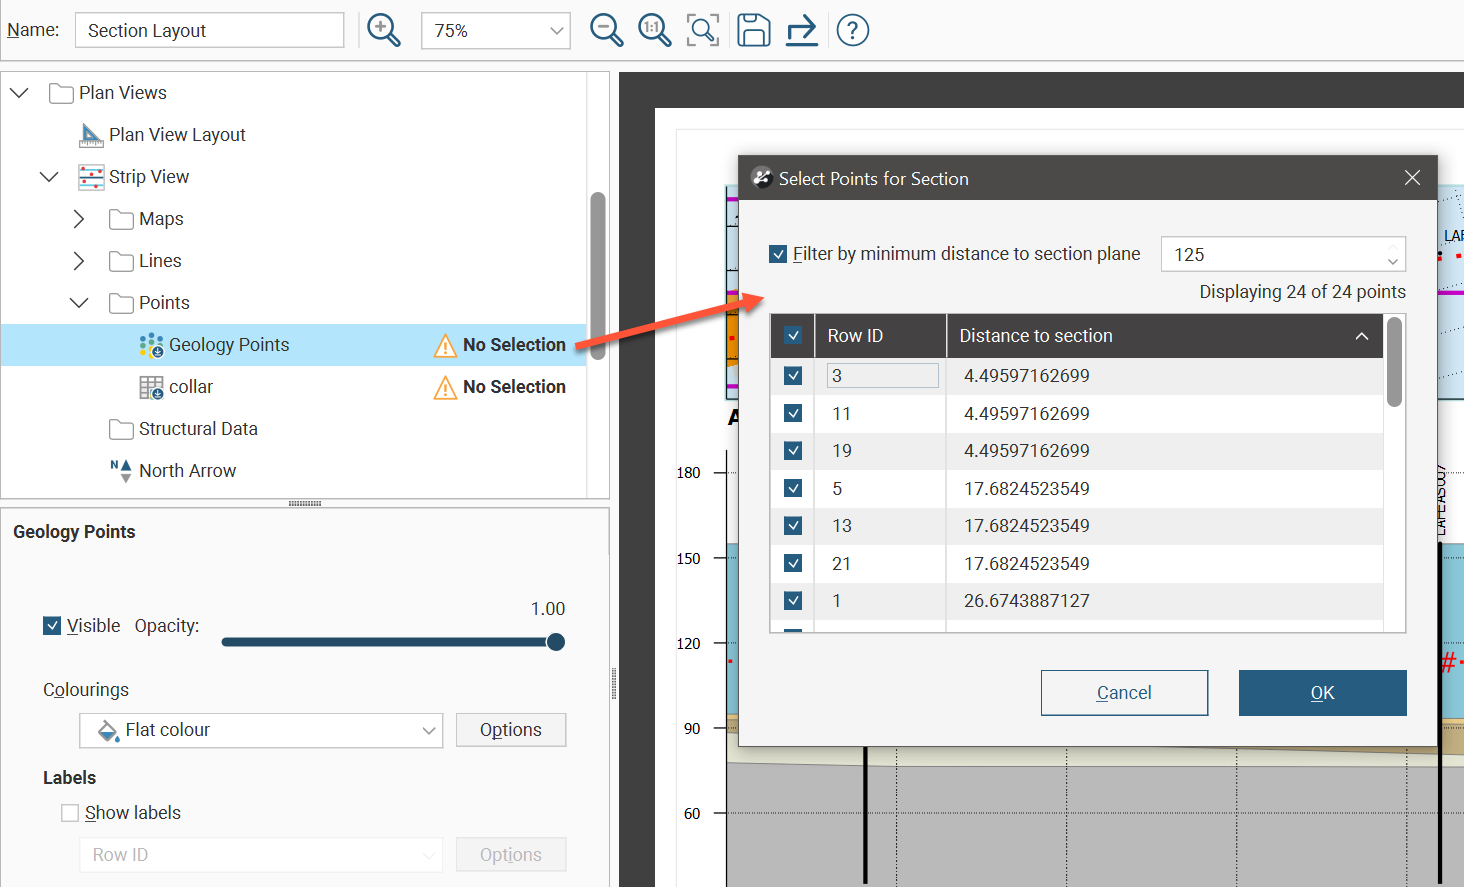
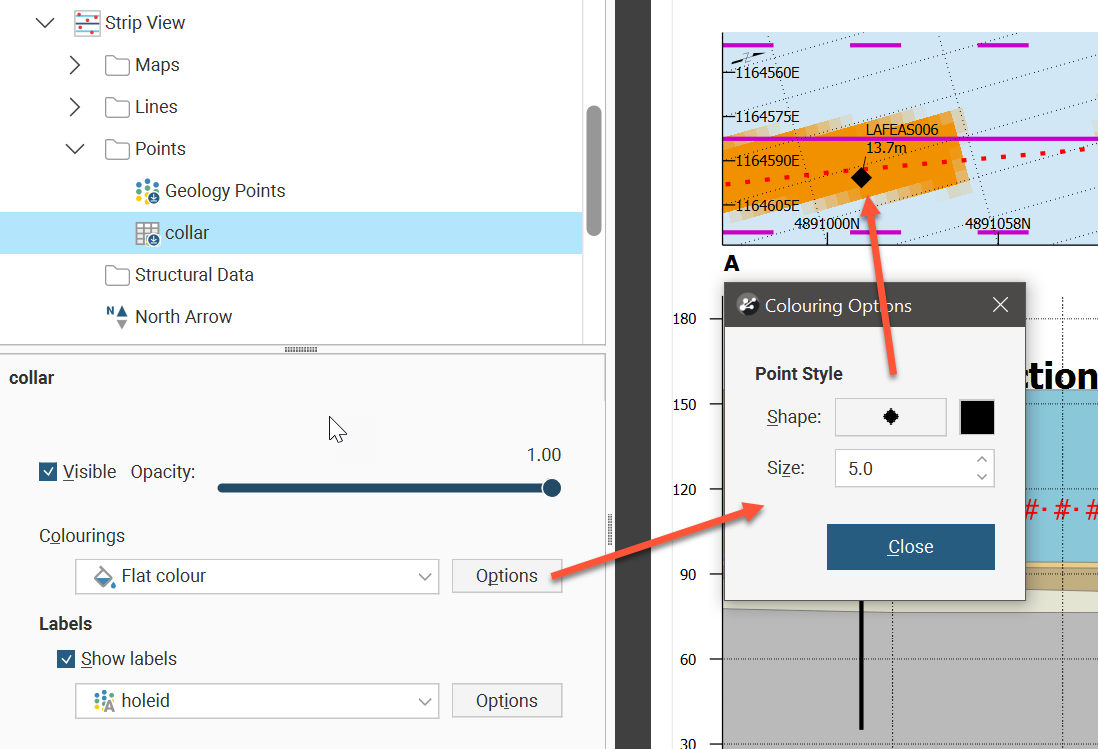
The points settings provides the ability to adjust the Opacity to make points visible. Change the layer order of the points by right-clicking a points object in the layout tree and selecting Move Forward, Move Backward, Move to Front or Move to Back. The Colourings dropdown list has Flat colour and points table column options. Click the Options button to see the Colouring Options window. If Flat colour is selected, you can adjust the Shape, colour and Size of the points in the strip view.
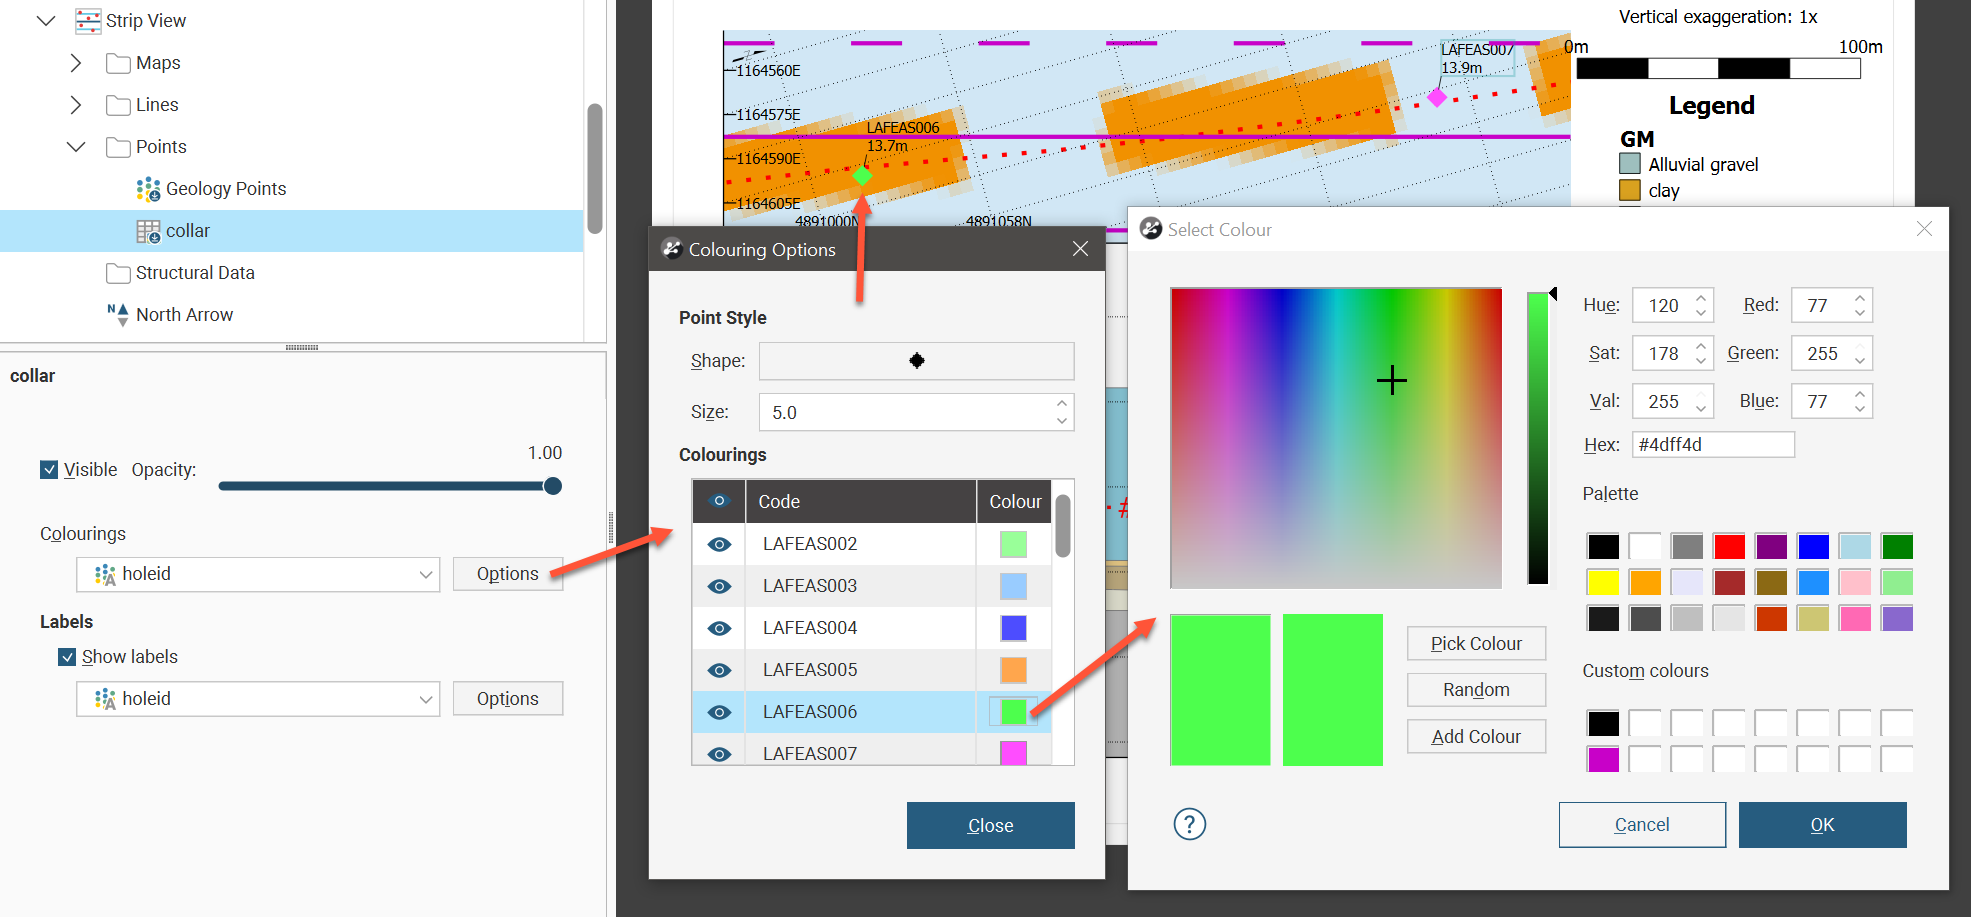
If a points table column has been selected as the colouring, the colouring will match the colours in the 3D scene as set from the shapes list. Clicking the colour tile in the Colouring Options window will open the colour picker, and the colour change will also be reflected back in the 3D scene as well.
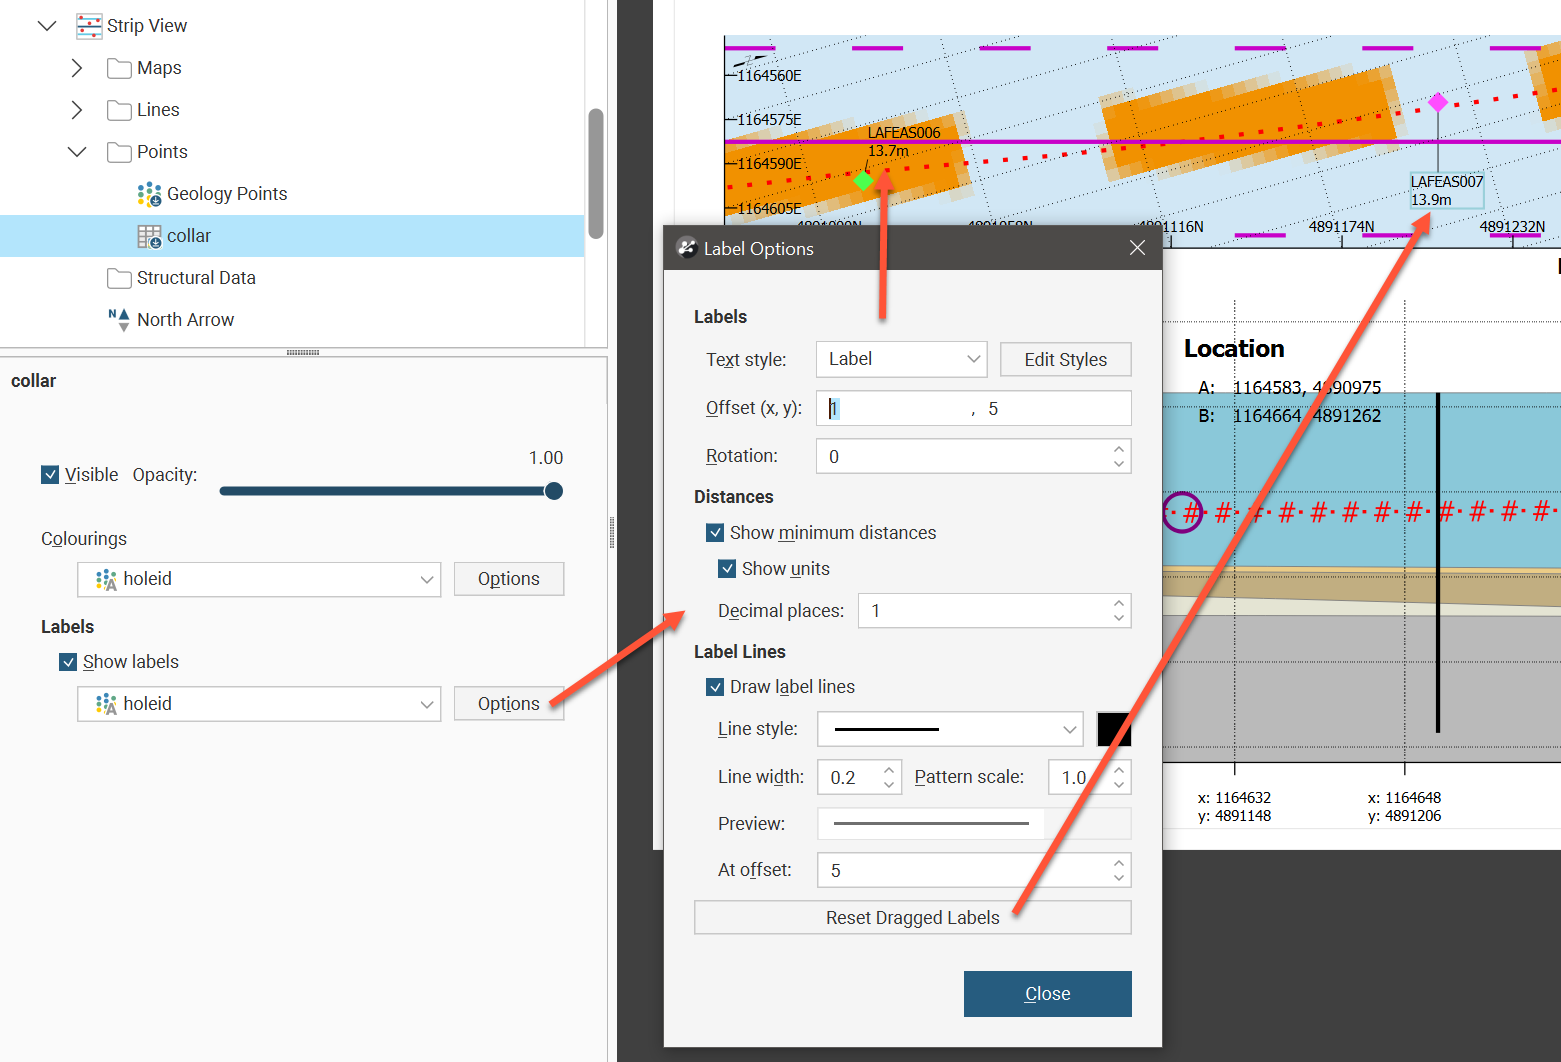
Points labels can also be customised. The Text style can be set to one of the existing style definitions, or the Edit Styles button can be used to customise the label. Offset (x,y) places the label relative to the point displayed in the strip view, and Rotation will tilt the text away from horizontal.
This example uses a collar table to illustrate what can be done using points. It is not necessary to add a collar table as points to get well locations on the strip view. Select Strip View and choose the appropriate option from the Well Set list. The collar location points and the labels can then be customised. The Points folder could be used to add additional collar locations outside of the selected well set table.
There is an option to Show minimum distances for each point. You can also choose to Show units and to specify the number of Decimal places displayed.
Label lines connect the label to a point using a customisable line. Tick Draw label lines to use these to clearly associate a label with a point. You can set the Line style, the line colour, the Line width and the Pattern scale. At offset sets a minimum distance for the label line to appear. If you have ticked Draw label lines but you are not seeing any label lines, you may need to increase the distance of the label from the point using Offset (x,y) or you may need to decrease At offset. Because labels can be dragged on the strip view to reposition the label so the text does not interfere with other visual elements, there is also a Reset Dragged Labels button to quickly revert any such label repositioning to the default positions.
To add structural data to a strip view, right-click the Structural Data folder in the layout tree under Strip View then click Add Structural Data.The Add Structural Data window will appear with a list of structural data tables that can be used. Select structural data tables and click OK. Each will likely be flagged with a No Selection warning. Double-click the structural data table in the layout tree to see the Select Structural Data for Section window. Use the table to select individual rows to display, or tick the tickbox in the table header to select all the rows. Use the Filter by minimum distance to section plane tickbox to filter and show only structural data within the specified distance to the section plane.
The structural data settings provide the ability to adjust the Opacity to make structural data combinations visible. Change the layer order of the structural data by right-clicking a table in the layout tree and selecting Move Forward, Move Backward, Move to Front or Move to Back. The Colourings dropdown list has Flat colour and structural data table column options. Click the colourings Options button to see the Colouring Options window. If Flat colour is selected, you can adjust the Width, colour and Length of the structural data in the strip view. If a structural data table column has been selected as the colouring, the colourmap used in the 3D scene as set from the shapes list will be used. A Value filter can be set and the structural data symbol Width and Length can be set.
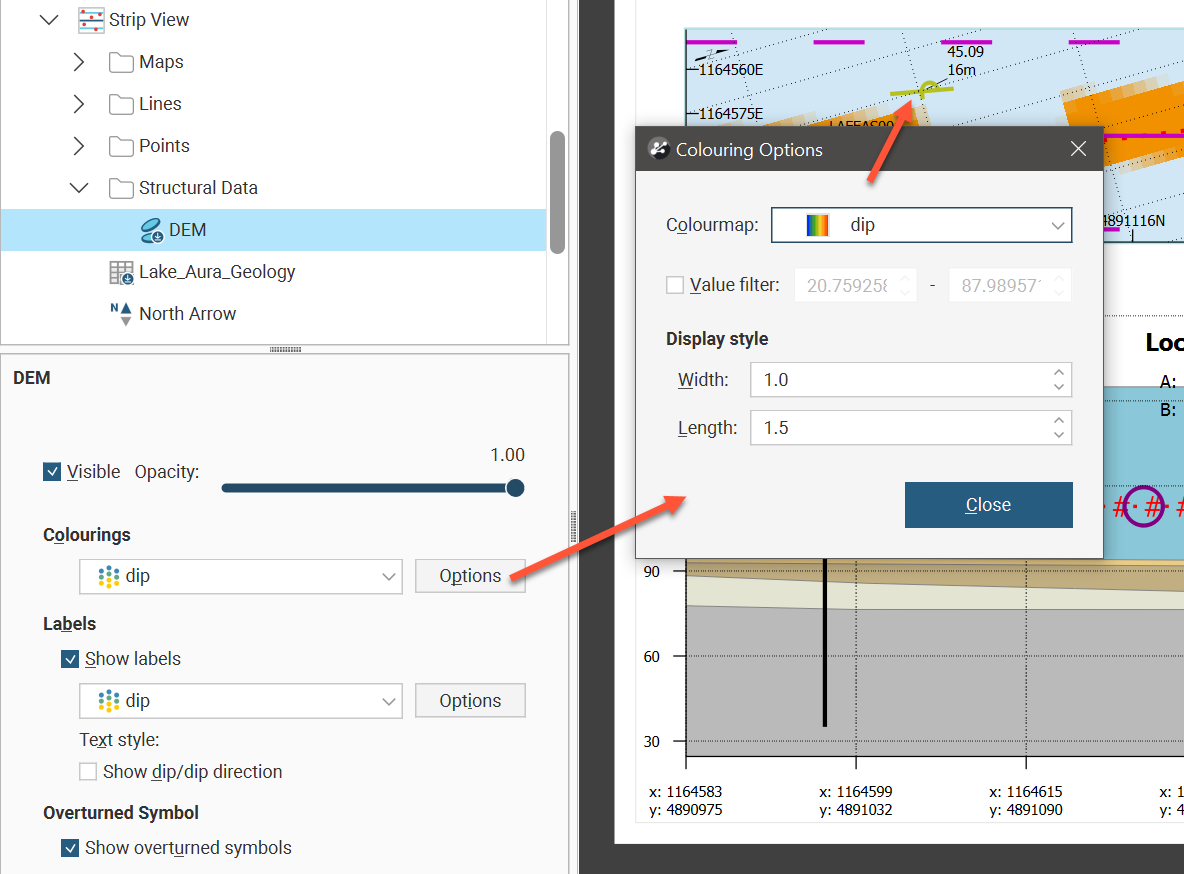
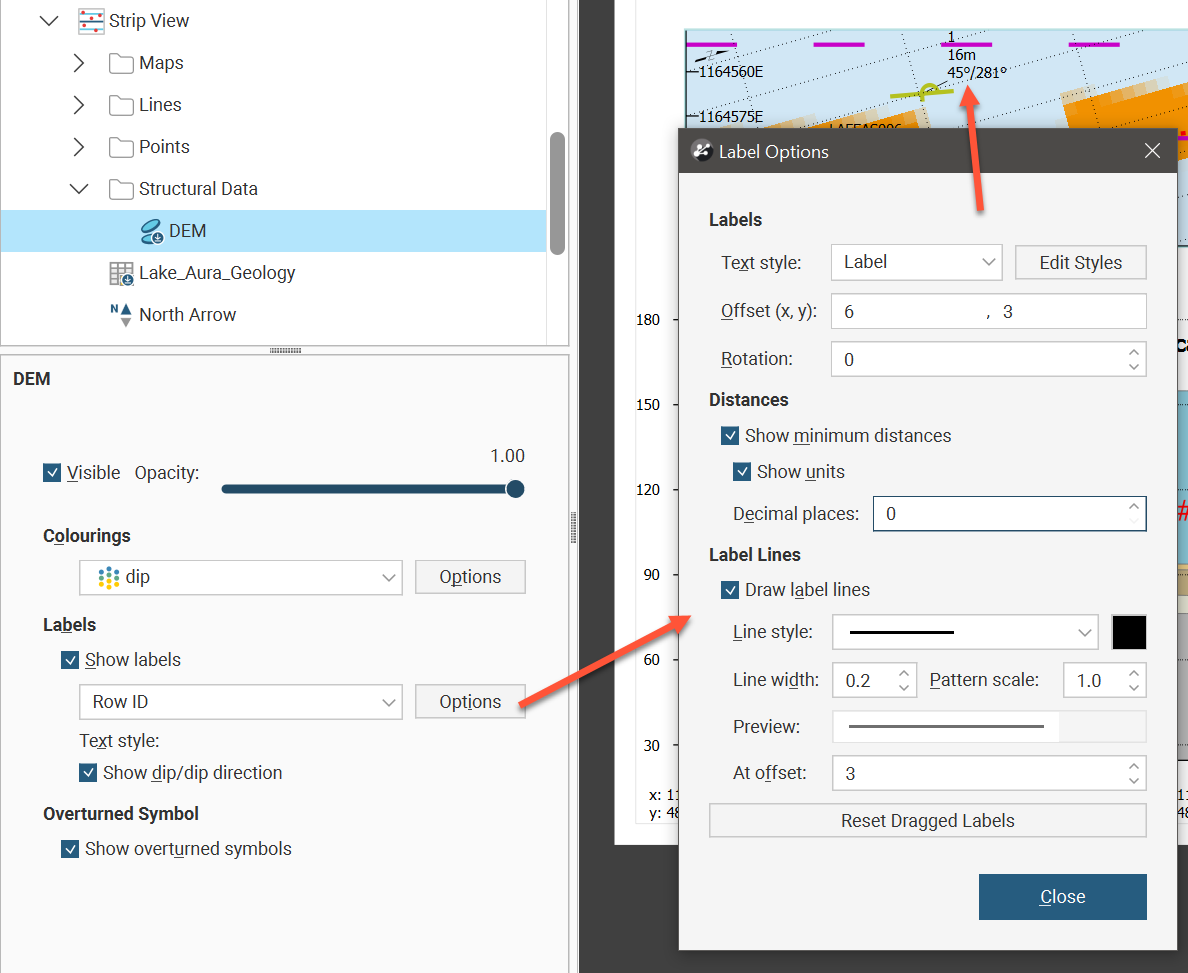
The structural data labels shown in the strip view can also be customised. Show labels will specify whether or not they should appear. Besides no label and the Row ID, each of the structural data columns can be selected to be displayed as the label. Additionally, you can choose to Show dip/dip direction as part of the label. Click the Options button for more label settings. The Text style can be set to one of the existing style definitions, or the Edit Styles button can be used to customise the label. Offset (x,y) places the label relative to the structural data symbol displayed in the strip view, and Rotation will tilt the text away from horizontal.
There is an option to Show minimum distances for each symbol. You can also choose to Show units and to specify the number of Decimal places displayed.
Label lines connect the label to a symbol using a customisable line. Tick Draw label lines to use these to clearly associate a label with a structural data symbol. You can set the Line style, the line colour, the Line width and the Pattern scale. At offset sets a minimum distance for the label line to appear. If you have ticked Draw label lines but you are not seeing any label lines, you may need to increase the distance of the label from the symbol using Offset (x,y) or you may need to decrease At offset. Because labels can be dragged on the strip view to reposition the label so the text does not interfere with other visual elements, there is also a Reset Dragged Labels button to quickly revert any such label repositioning to the default positions.