
Scatter Plots
Scatter plots also appear when selecting Decluster Weights Comparison from the Statistics options.
Scatter plots are useful for understanding relationships between two variables. A third variable can be introduced by setting the Colouring option to a data column.
The example below plots the two variables lead and zinc against each other, with gold being indicated by the colouring.
You can make either axis a log scale with the Log scale in X and Log scale in Y options. A Query filter may also be applied.
The appearance of the chart can be modified by adjusting the Point size, Point shape, and White background settings.
Enable Show X = Y line to aid in assessing how far off equal the distributions are.
When you select Show linear regression, a regression line is added to the chart and a function equation is added below the chart title.
Show conditional expectation plots a line that attempts to find the expected value of one variable given the other. The X axis is divided into a number of bins specified by Bin count, and the data in each bin is used to predict the expected Y value.
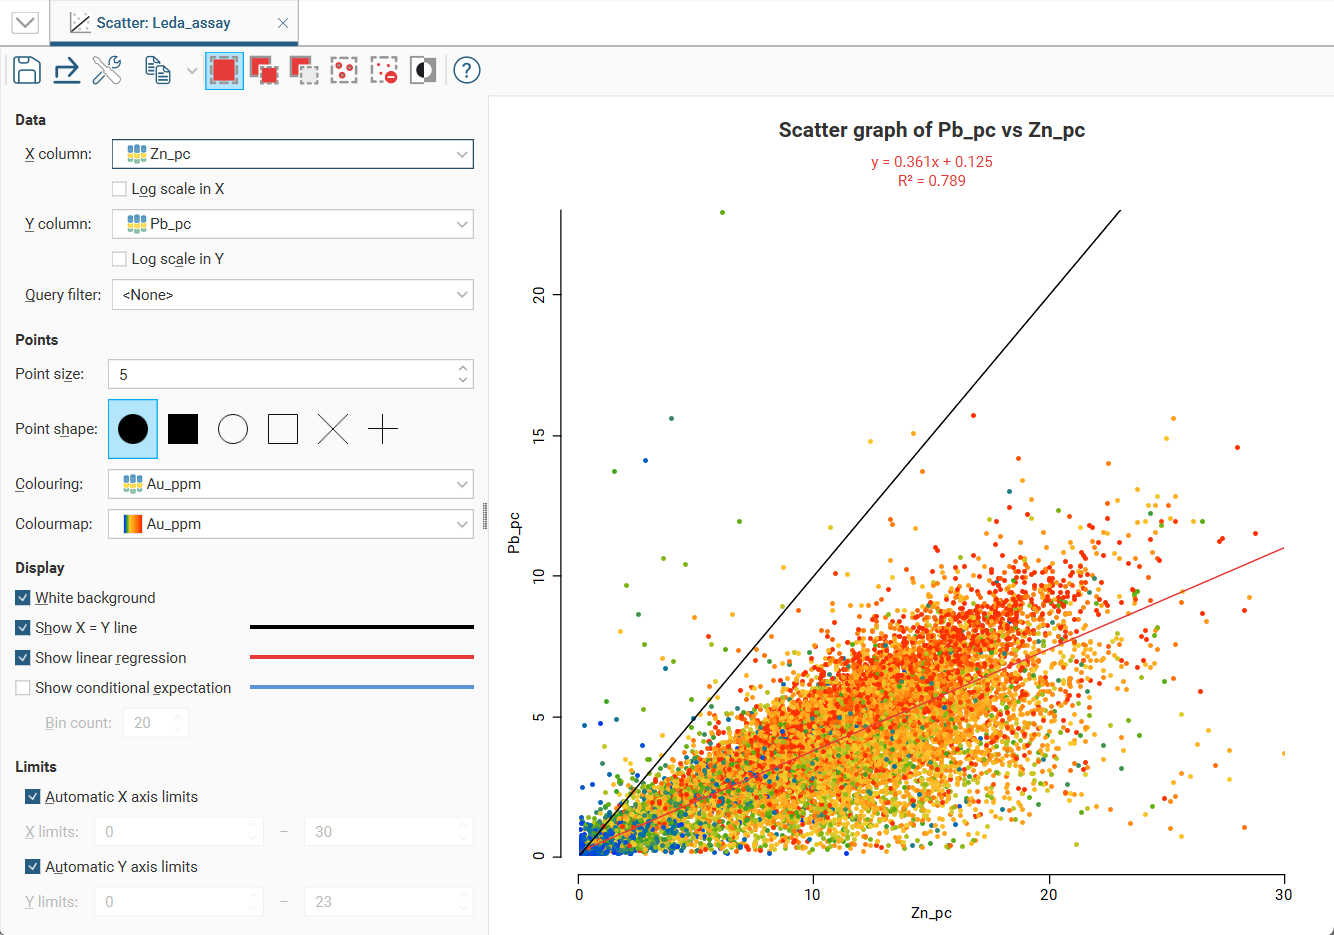
By default, the limits of the chart are automatically set to range between zero and the upper limit of the variable data. You can adjust this by turning off Automatic X axis limits and/or Automatic Y axis limits and specifying preferred minimum and maximum values for each axis.
Selecting Points on the Graph
There are three buttons at the top of the window for selecting points on the graph:
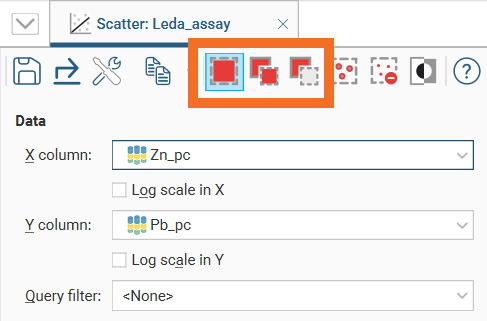
- Use the Replace button (
 ) to select points. This clears any previous selection.
- Use the Add button (
 ) to add more points to an existing selection.
- Use the Remove button (
 ) to deselect points.
There are three ways to use each tool:
- Click on individual points to select/deselect them.
- Drag the cursor across points to select/deselect them.
- Draw around a set of points to select/deselect them.
For example, here, using the Replace button () to draw a loop around points selects those points:
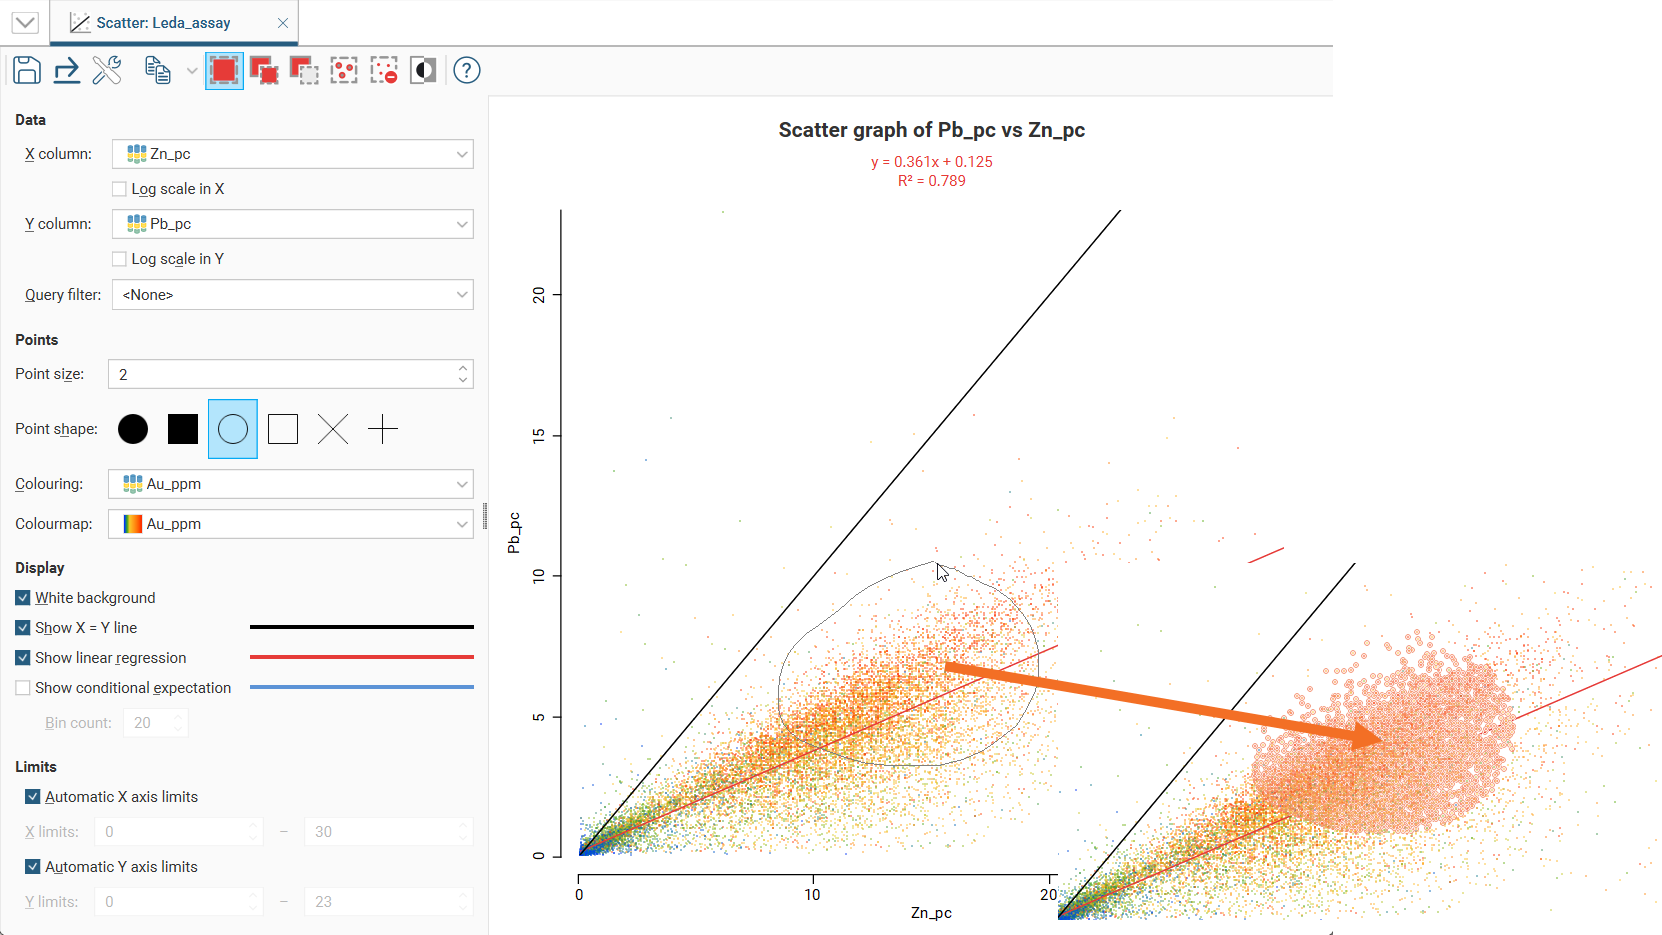
You can also:
- Select all visible points by clicking on the Select All button (
 ) or by pressing Ctrl+A.
- Clear all selected points by clicking on the Clear Selection button (
 ) or by pressing Ctrl+Shift+A.
- Swap the selected points for the unselected points by clicking on the Invert Selection button (
 ) or by pressing Ctrl+I.
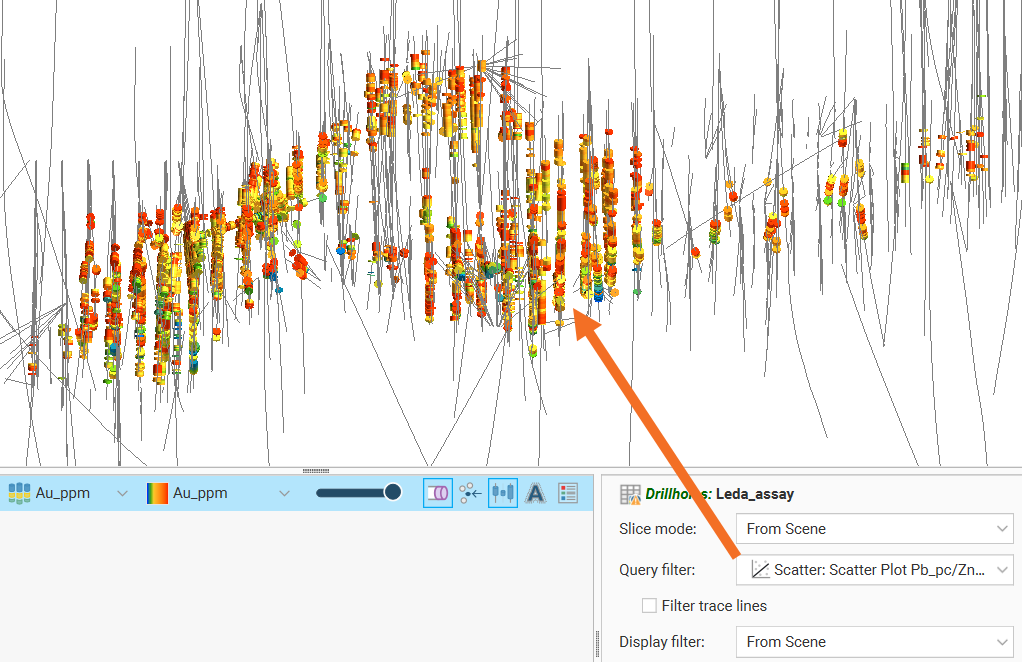
Selected points can be filtered in the scene by selecting the scatter plot from the Query filter options in the shape properties panel.
Saving a Scatter Plot
Click the Save button ( ) to add the scatter plot to the Saved Statistics folder.
This will create a copy of the scatter plot with a default name. You can then modify the name of the plot so you can more easily find it in the Saved Statistics folder. You can also switch back to the original scatter plot and make further changes, then save additional versions of the plot to the Saved Statistics folder.
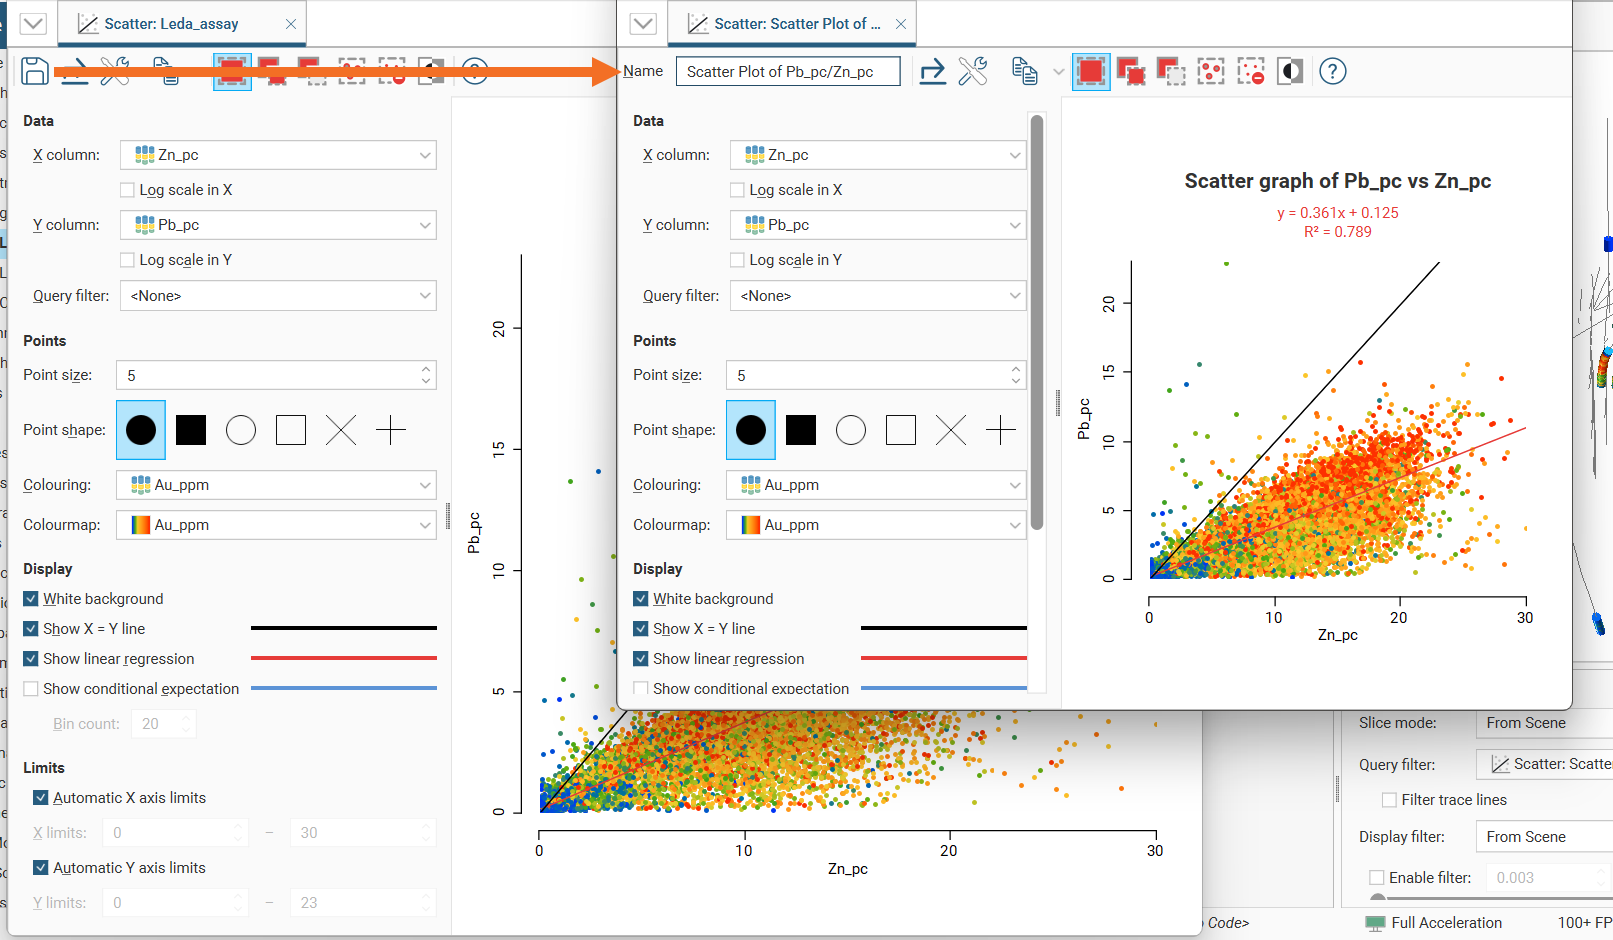
Once saved to the Saved Statistics folder, subsequent changes to the plot are automatically saved.
Styling Elements in a Scatter Plot
You can change the size of various elements of the scatter plot, such as the sizes of different labels. To do this, click the Edit reporting display settings button ( ):
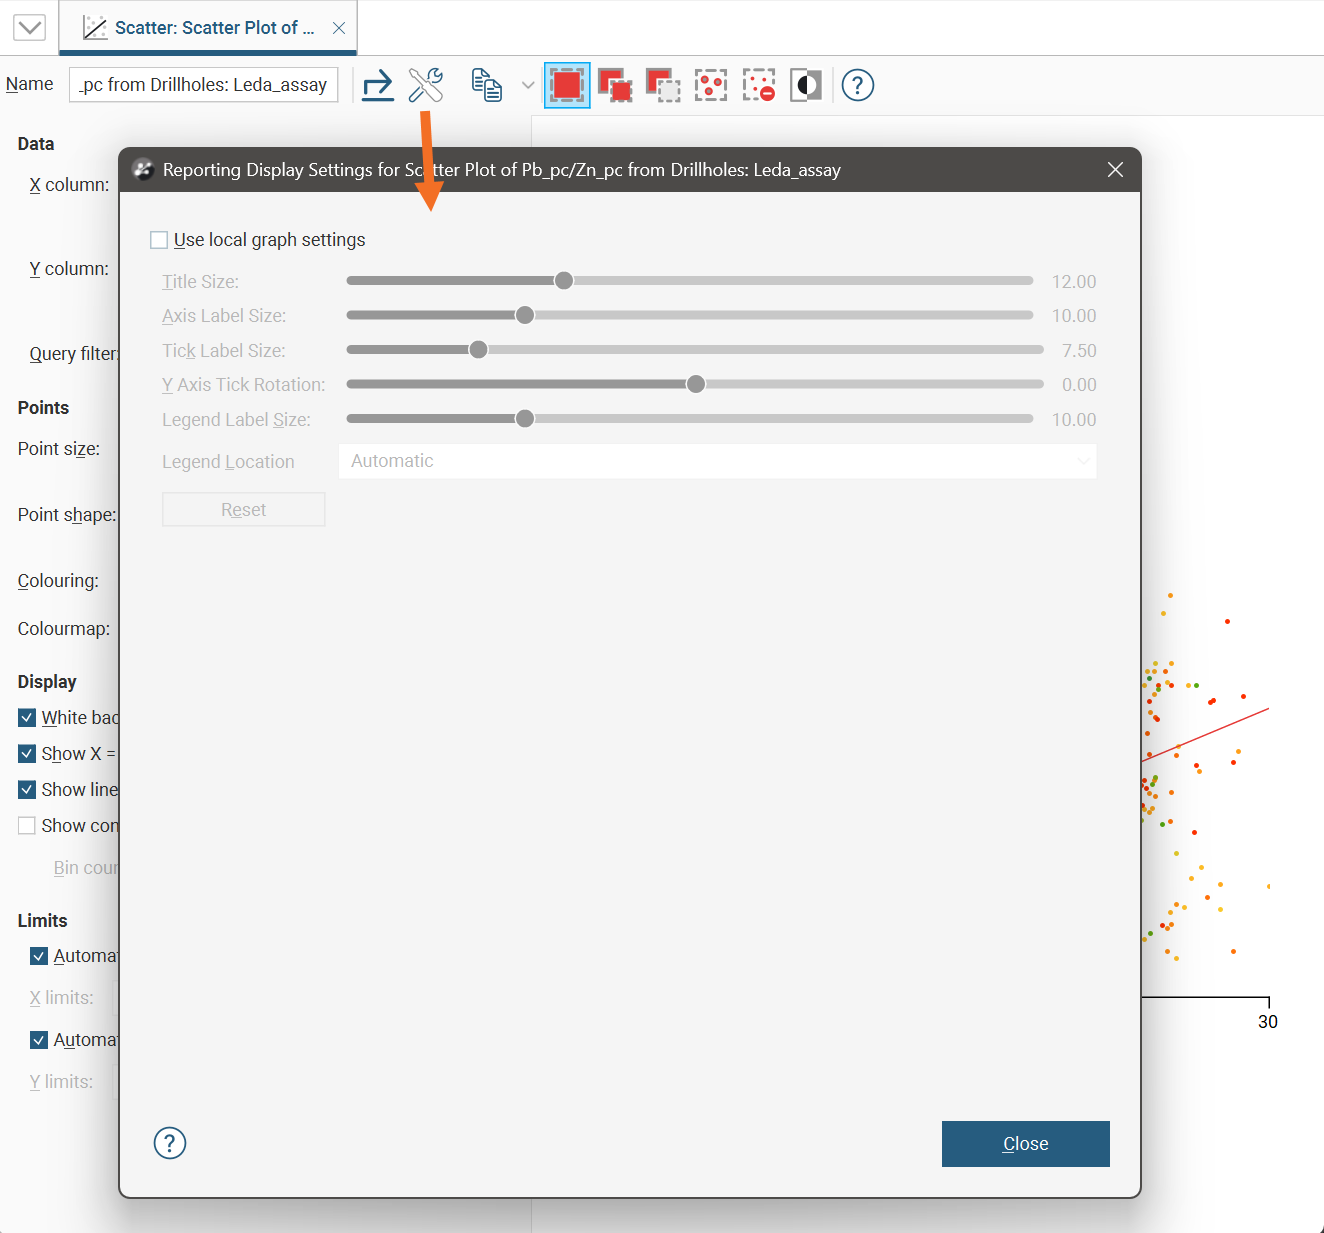
By default, the scatter plot will use the global graph settings. For more information, see Graphs Settings.
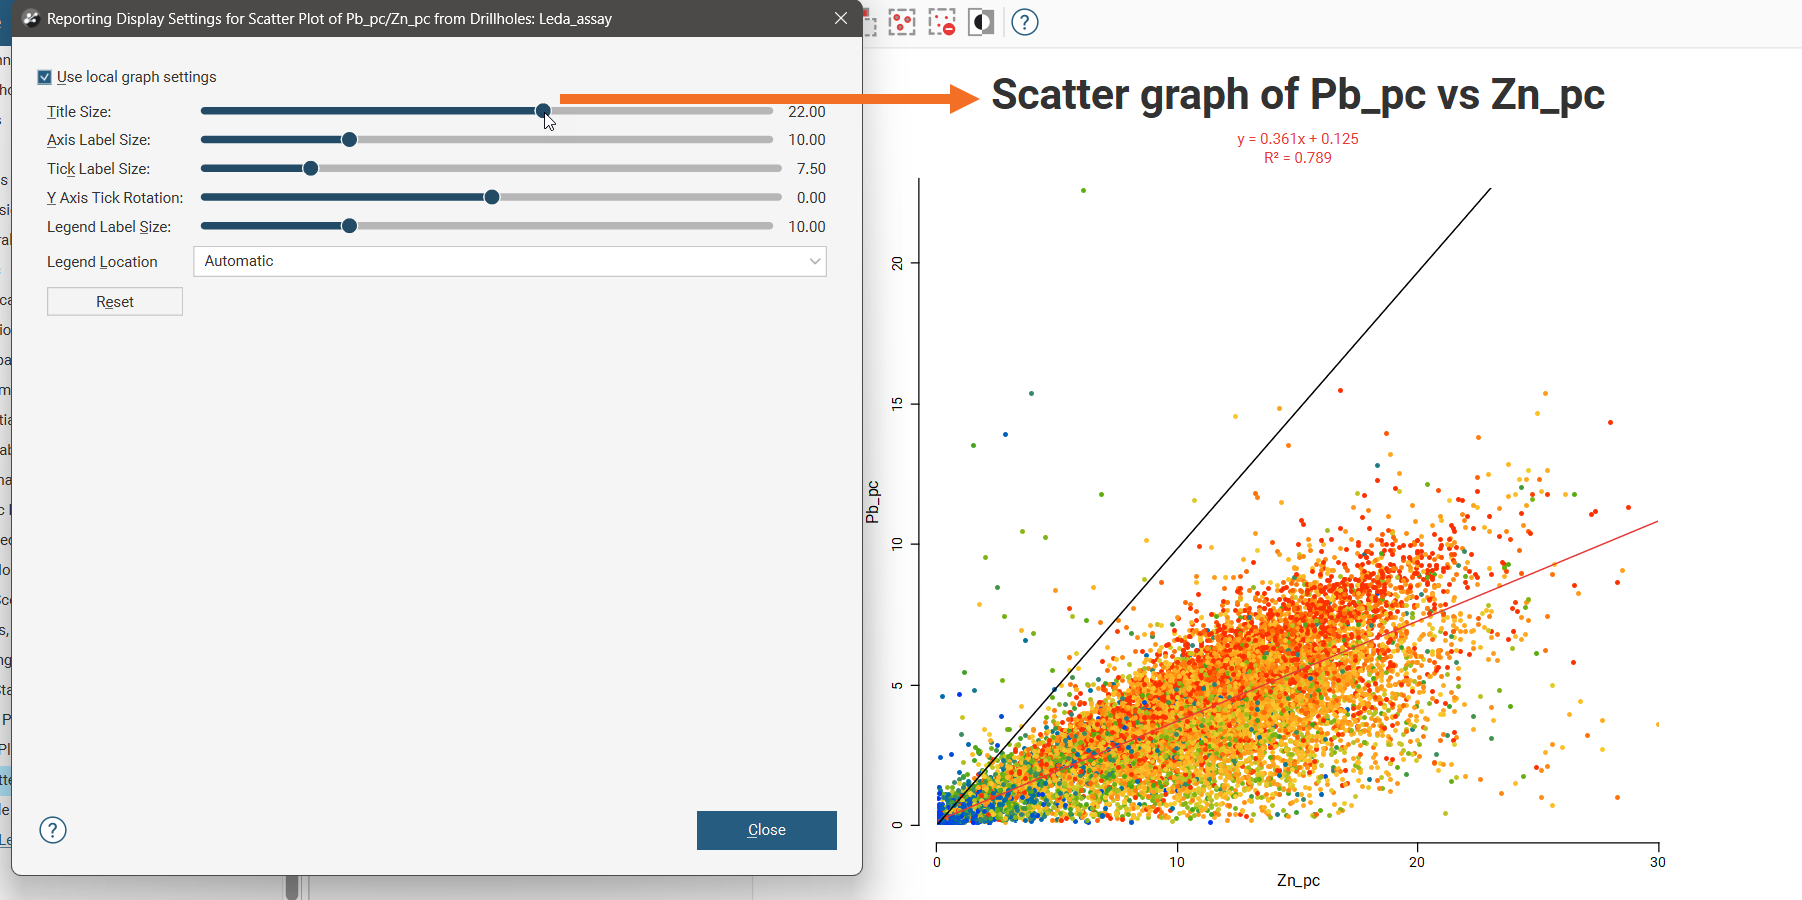
If you tick the Use local graph settings box, the sliders will adjust the chart features for the scatter plot currently open.
Exporting a Scatter Plot
Scatter plots can be exported as PDF, SVG and PNG files. Click the Export button ( ), then specify a filename and select the file type you prefer.
Alternatively, you can click the Copy button ( ) then select Copy Graph Image; an image of the plot will be added to the clipboard. You can then paste the image from the clipboard into another application.