MODFLOW Model Display
If you do not have the Hydrogeology extension, MODFLOW models will appear in the project tree as Restricted.
In the project tree, MODFLOW models are made up of a grid object (![]() ), a Simulation Outputs folder and a hydrological properties table (
), a Simulation Outputs folder and a hydrological properties table (![]() ) object. If there is no hydrological properties table, an evaluation has not yet been set for export. See MODFLOW Evaluations for more information.
) object. If there is no hydrological properties table, an evaluation has not yet been set for export. See MODFLOW Evaluations for more information.
For MODFLOW models created in and imported into Leapfrog Geo, dragging the model itself into the scene will display the grid (![]() ) object. The different parts of the model can also be displayed.
) object. The different parts of the model can also be displayed.
Grid Display Options
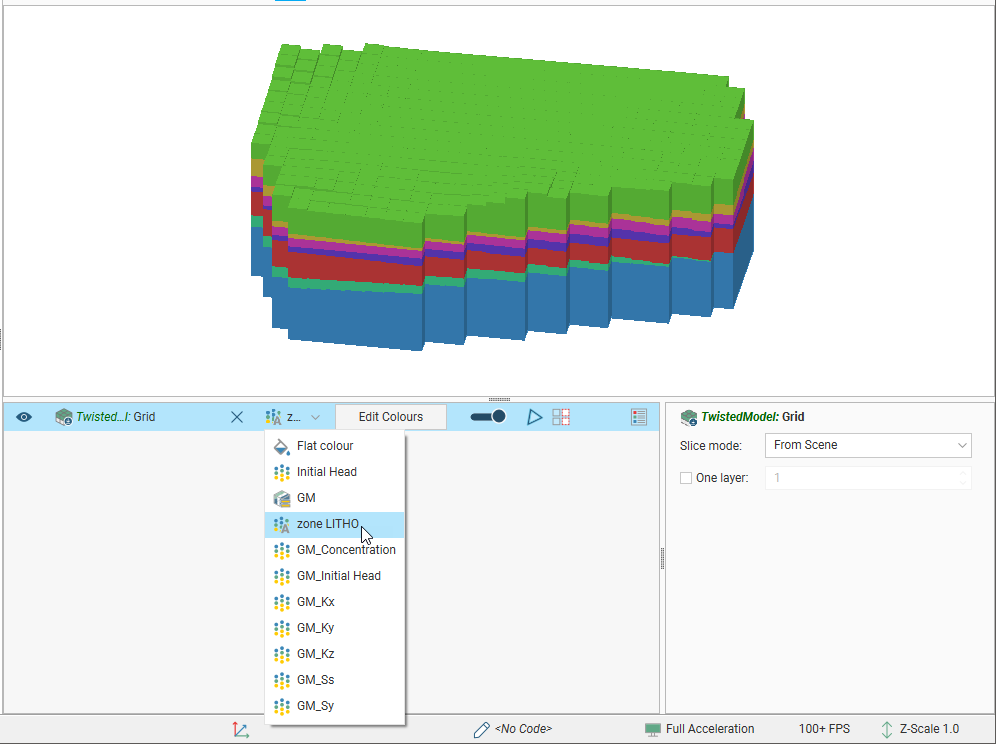
Dragging a MODFLOW model into the scene displays its grid object. Here, an imported model has been evaluated against a geological model and added to the scene:

The viewing options available are the flat colour option, the evaluated geological model and zone data imported with the model. Other inputs imported with a model will also be available from this list, and once the model has been evaluated against a geological model or interpolant, you can also display the model using the grid’s hydrological properties.
Grids are displayed as cells. When a geological model evaluation or lithological zone information is displayed, you can also display a legend for the grid.
When Show edges (![]() ) is enabled, the edges of the cells will be displayed.
) is enabled, the edges of the cells will be displayed.
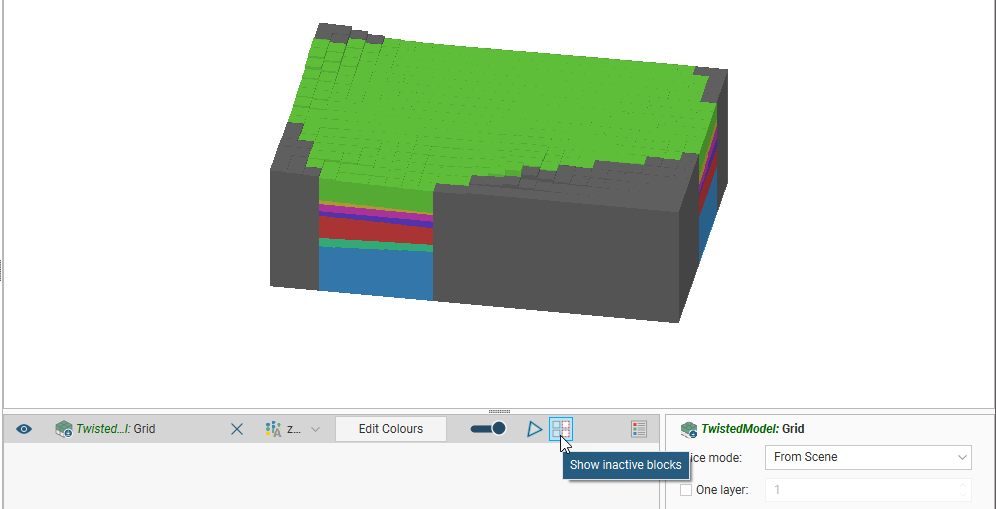
The Show inactive blocks (![]() ) option displays inactive cells in grey:
) option displays inactive cells in grey:

To display a single layer, tick the One layer box in the shape properties panel, then select the layer to display.
Head values and MT3D concentrations can also be imported and displayed. See Head Values and MT3D Concentrations.
Viewing Block Information
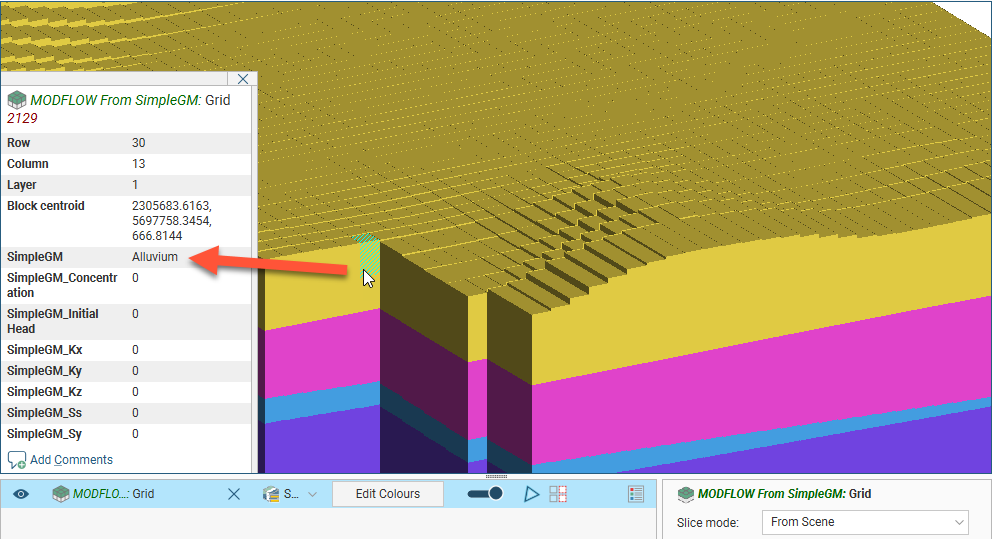
When a MODFLOW model is displayed in the scene, you can view information about the individual cells in the model by clicking on a block. The window that appears shows information about the selected block, including its centroid and the lithology assigned to the block from the evaluated geological model. Information from all geological models and interpolants the grid has been evaluated against will be displayed:

Got a question? Visit the Seequent forums or Seequent support
© 2022 Bentley Systems, Incorporated