GIS Data
This topic discusses working with GIS data objects. It is divided into:
- Importing Vector Data
- Importing a MapInfo Batch File
- Importing Data from an ESRI File Geodatabase
- Reloading GIS Data
- Setting Elevation for GIS Data Objects
- Viewing an Object’s Attribute Table
- Creating a New GIS Line
- Draping GIS Data on the Topography
- Displaying GIS Data
- Exporting GIS Data
See Maps and Images for information on importing and working with images in Leapfrog Geo.
Importing Vector Data
Vector data formats Leapfrog Geo supports include:
- Shape Files (*.shp)
- MapInfo Files (*.tab, *.mif)
- ESRI Personal GeoDatabase Files (*.mdb, *.accdb)
You can also import data from MapInfo and ESRI databases. See Importing a MapInfo Batch File and Importing Data from an ESRI File Geodatabase for more information.
To import vector data, right-click on the GIS Data, Maps and Photos folder and select Import Vector Data. Navigate to the folder that contains the GIS data and select the file. You can select multiple files using the Shift and Ctrl keys.
Click Open to begin importing the data.
If you are importing a single file, the Import GIS Vector Data window will show a summary of the data in the selected file:
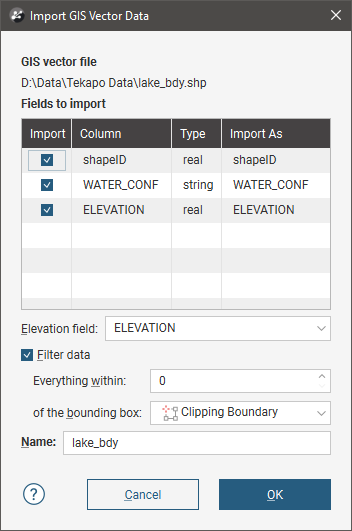
You can choose what field in the data to use for the Elevation Field from the list.
If you are importing multiple files, all files being imported are listed in the Import GIS Vector Data window and no summary of each file is displayed:
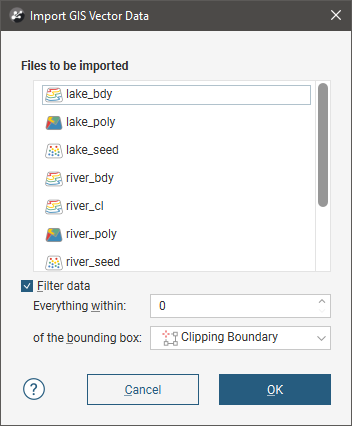
Data is automatically clipped to the clipping boundary, but you can change how the data is filtered to suit any bounding box that exists in the project. If you do not wish to clip the data, untick the Filter data box.
Click OK to add the data to the project.
If the file contains spatially coincident points, a warning will be displayed, along with the ID for each duplicate row.
The object or objects will appear in the project tree under the GIS Data, Maps and Photos folder. You can then view an object’s attributes by right-clicking on it and selecting Attribute Table. If a topography has been defined for the project, you can drape imported GIS data on the topography, as described in Draping GIS Data on the Topography below.
When importing files, you may be prompted to select whether or not to filter elevation data. If you wish to use another data source for your elevation data, select Filter data. For example, if you import a GIS line that has suspect elevation data, you can discard the elevation data and set the elevation from the topography, as described in Setting Elevation for GIS Data Objects.
If data changes outside the project, it can be reloaded as described in Reloading GIS Data.
Importing a MapInfo Batch File
You can import a collection of GIS data exported from MapInfo. The MapInfo file can include points, lines, polygons, images and elevation grids.
To import GIS data in this way, right-click on the GIS Data, Maps and Photos folder and select Batch Import > from MapInfo. In the window that appears, navigate to the folder that contains the MapInfo batch file, which is an XML file. Click Open.
The data that can be imported will be displayed and you can select which files to import:
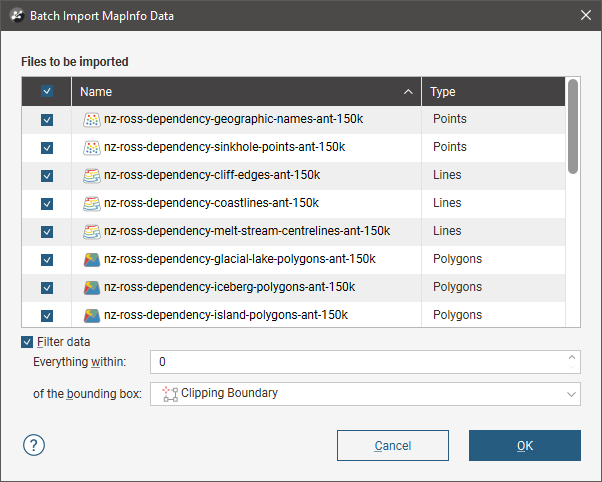
You can select multiple files using the Shift and Ctrl keys.
Data is automatically clipped to the clipping boundary, but you can change how the data is filtered to suit any bounding box that exists in the project. If you do not wish to clip the data, untick the Filter data box.
Click OK to import the selected files, which will be added to the GIS Data, Maps and Photos folder as a group (![]() ), with the exception of elevation grids, which will be added to the Meshes folder.
), with the exception of elevation grids, which will be added to the Meshes folder.
Points, lines and polygons can be reloaded on an individual basis, which is described in Reloading GIS Data.
Importing Data from an ESRI File Geodatabase
You can import points, lines and polygons from an ESRI file geodatabase. However, the import of raster data is not supported.
To import GIS points, lines and polygons in this way, right-click on the GIS Data, Maps and Photos folder and select Batch Import > from ESRI Geodatabase. In the window that appears, navigate to the folder that contains the database folder (*.gdb) and click Open.
Leapfrog Geo imports uncompressed ESRI geodatabases.
The data that can be imported will be displayed and you can select which files to import:
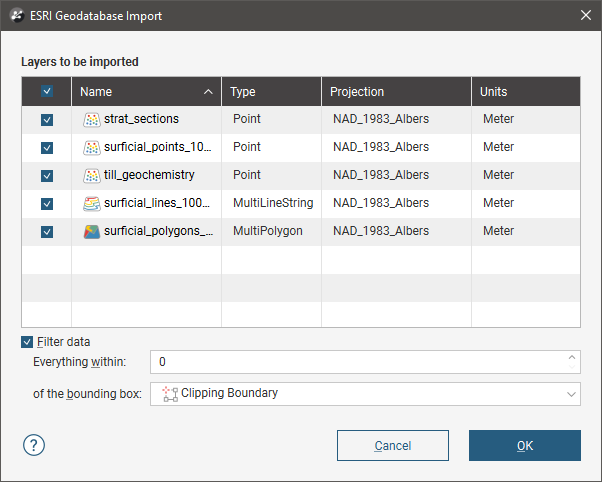
You can select multiple files using the Shift and Ctrl keys.
Data is automatically clipped to the clipping boundary, but you can change how the data is filtered to suit any bounding box that exists in the project. If you do not wish to clip the data, untick the Filter data box.
Click OK to import the selected files, which will be added to the GIS Data, Maps and Photos folder as a group (![]() ). Data in the group can be reloaded individually or as a group, which is described in Reloading GIS Data.
). Data in the group can be reloaded individually or as a group, which is described in Reloading GIS Data.
Reloading GIS Data
If during the course of a project GIS points, lines and polygons change, they can be reloaded and dependent models will automatically be updated. Objects originally imported as part of an ESRI database (![]() ) can be reloaded individually or as part of the group.
) can be reloaded individually or as part of the group.
Although the GIS data will be overwritten, any elevation data set in Leapfrog Geo will be retained.
Reloading Points, Lines and Polygons
To reload a GIS point, line or polygon, right-click on it in the project tree and select Reload Data. Navigate to the folder containing the GIS file and select the file. Click Open.
The process is the same as importing GIS data. Click OK to reload the data. The original data will be overwritten and dependent objects will be updated to reflect the new data.
Reloading an ESRI Database
To reload an ESRI database, right-click on it in the project tree and select Reload Data. In the window that appears, select the layers to reload, then click OK.
Points, lines and polygons imported as part of an ESRI database can also be reloaded on an individual basis.
Setting Elevation for GIS Data Objects
You can set the elevation for GIS objects by:
- Using a fixed elevation
- Using the elevation data from one of the object’s attributes
- Using the elevation data from a surface in the project
The options available depend upon the type of object.
| Fixed Elevation | From Attribute | From Surface | |
|---|---|---|---|
| GIS lines | √ | √ | √ |
| GIS points | √ | √ | √ |
| GIS polygons | √ | √ | - |
| 2D grids | √ | - | √ |
| GIS lines drawn in Leapfrog Geo | √ | - | - |
| GIS lines extracted from polylines | √ | - | - |
To set the elevation for a GIS object, right-click on it in the project tree and select Set Elevation. The Set Elevation window will appear, displaying the available options. Select the option required and click OK.
Viewing an Object’s Attribute Table
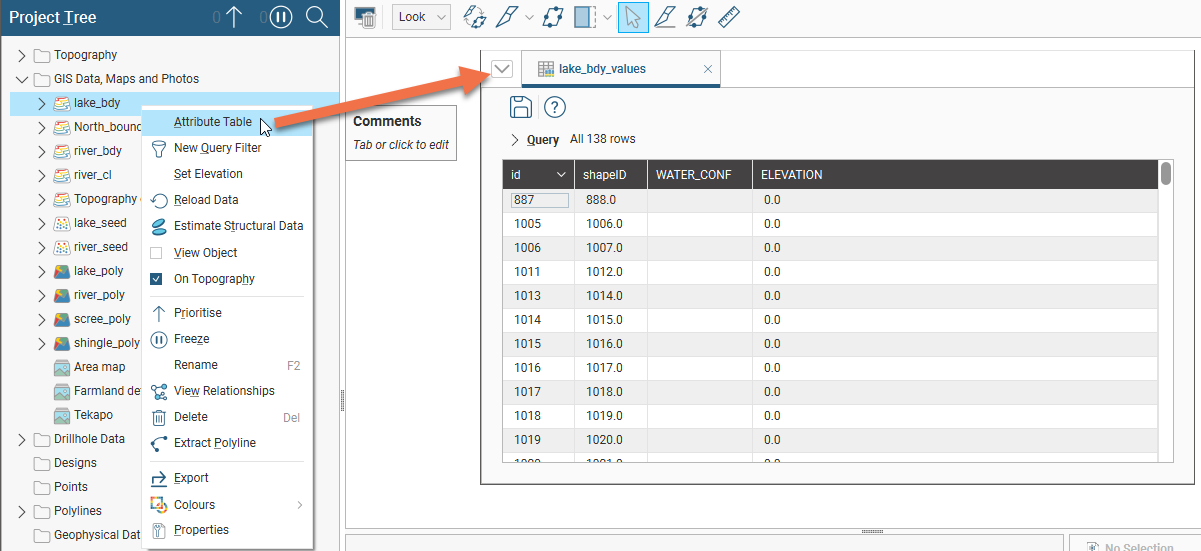
You can view the attribute table for most GIS data objects by right-clicking on the object and selecting Attribute Table.
Creating a New GIS Line
There are three ways to create a new GIS lines object in Leapfrog Geo:
- If you do not have GIS data for a topographical feature you wish to use in model building, you can draw a new GIS line. See Drawing a New GIS Line
- If you have two surfaces that intersect, you can generate a new GIS line from their intersection. You can use any surface in the project, including those that are generated in building models. See Creating a New GIS Line from Intersecting Meshes.
- If you have a polyline you wish to use as a GIS lines object, right-click on it in the project tree and select Extract GIS Line. The new GIS line (
 ) will appear in the GIS Data, Maps and Photos folder. It is not linked to the original polyline.
To view new GIS line draped on the topography, select the object from the GIS data > GIS objects list, as described in Topography Display Options.
Drawing a New GIS Line
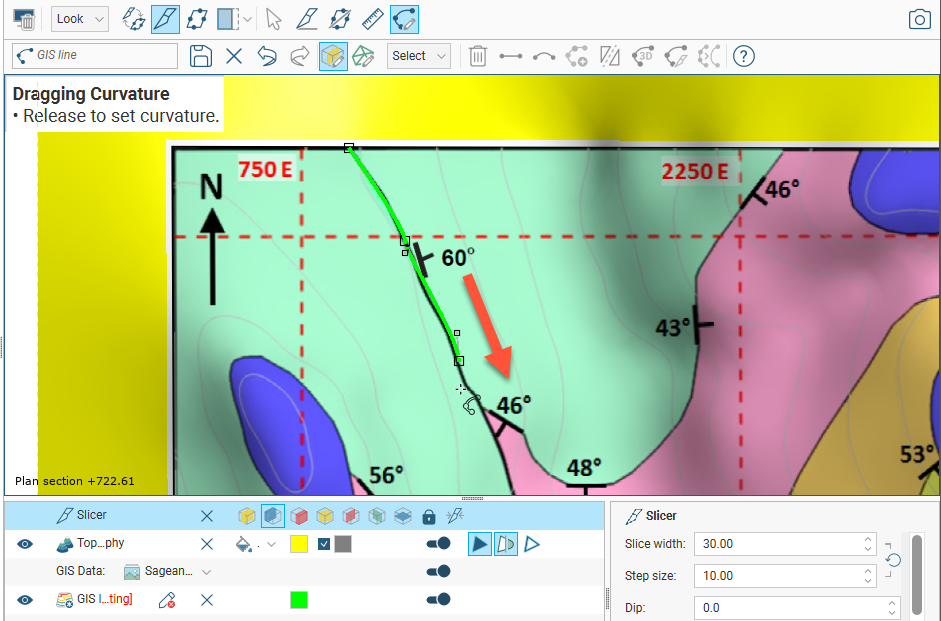
GIS lines can be drawn on the slicer or on a surface.
Right-click on the GIS Data, Maps and Photos folder and select New GIS Line > From New Drawing. In the window that appears, enter a name for the new object and click OK.
The object will be created in the project tree and added to the shape list. The scene view will change to view the objects in the scene from above and tools for drawing polylines will appear. Click on the Draw lines button (![]() ) and start drawing in the scene, as described in Drawing in the Scene.
) and start drawing in the scene, as described in Drawing in the Scene.
When you have finished drawing, click the Save button (![]() ). The new line (
). The new line (![]() ) will be saved in the project tree.
) will be saved in the project tree.
You can edit the GIS line by right-clicking on it in the project tree and selecting Edit. If it is in the shape list, you can edit it by clicking on the Edit button (![]() ).
).
Creating a New GIS Line from Intersecting Meshes
You can create a new GIS line from two intersecting meshes. You can use any surface in the project, including those that are generated in building models.
To create a new GIS line from two intersecting meshes, right-click on the GIS Data, Maps and Photos folder and select New GIS Line > From Intersecting Meshes. In the window that appears, select the meshes to use, enter a name for the new object and click OK.
The new line (![]() ) will be saved in the project tree. It is not linked to the meshes used to create it and will not be updated when the meshes are updated.
) will be saved in the project tree. It is not linked to the meshes used to create it and will not be updated when the meshes are updated.
Draping GIS Data on the Topography
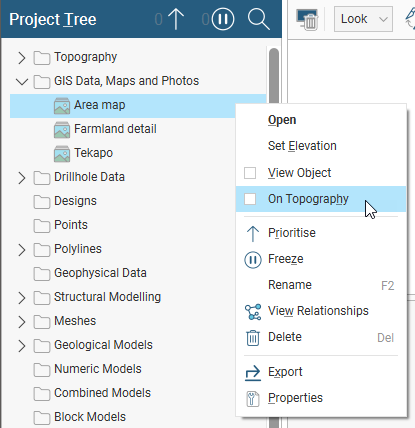
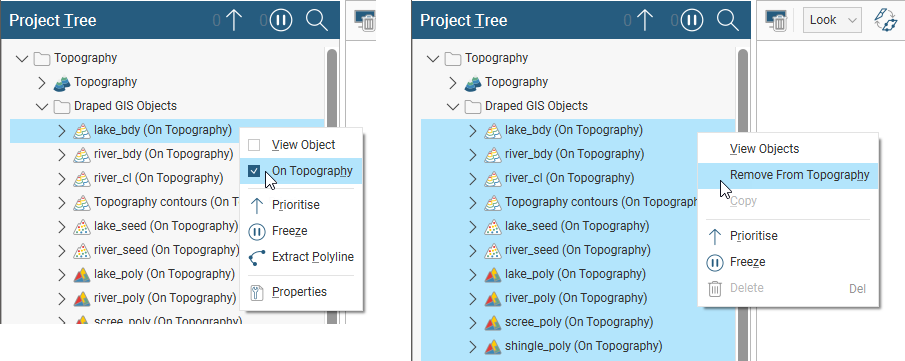
GIS data in the project can be draped on the topography. To do this, right-click on an object in the project tree and tick the On Topography box:
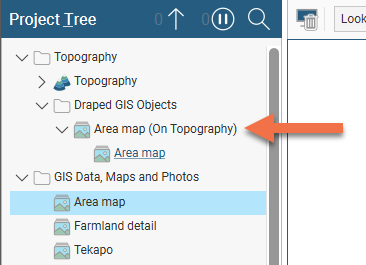
The draped version of the data object will be added to the Draped GIS Objects folder under the Topography folder:
In versions of Leapfrog Geo before 2022.1, GIS data objects imported into Leapfrog Geo were automatically draped on the topography. When you upgrade projects in Leapfrog Geo 2022.1, objects already draped will remain draped, and you can choose to remove them from the topography, if you wish.
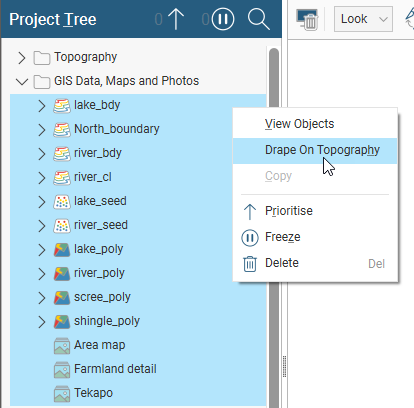
You can drape multiple GIS data objects and/or images on the topography in one action by using the Shift and Ctrl keys to select the objects you wish to drape, then right-clicking on them and selecting Drape On Topography:
To remove an object from the topography, right-click on either it or its draped copy in the Draped GIS Objects folder and untick the On Topography box. For multiple objects, select Remove From Topography.
Displaying GIS Data
In Leapfrog Geo, there are three ways of viewing GIS data in the scene:
- In its “native” form, as it was imported to the project. Add the GIS data object to the scene as you would any other object.
- On the topography. GIS data objects added to a project can be draped on the topography, as described in Draping GIS Data on the Topography above. Add the object in the Draped GIS Objects folder to the scene.
- Combined with other data draped on the topography. See Custom Topography Views in the Defining a Topography topic.
The reason for having different ways of displaying GIS data is the difficulty posed by inconsistent height data. Not all height data is correct or wanted. In practice, it is important for all the data to be consistent. For this reason, a single elevation field is defined as part of the topography and available data is assigned heights from this object. The native height information is available and can be used to define the height of layers in the models.
Displaying GIS Data Draped on the Topography
To display GIS using the topography’s elevation data, first drape the data object on the topography as described in Draping GIS Data on the Topography above.
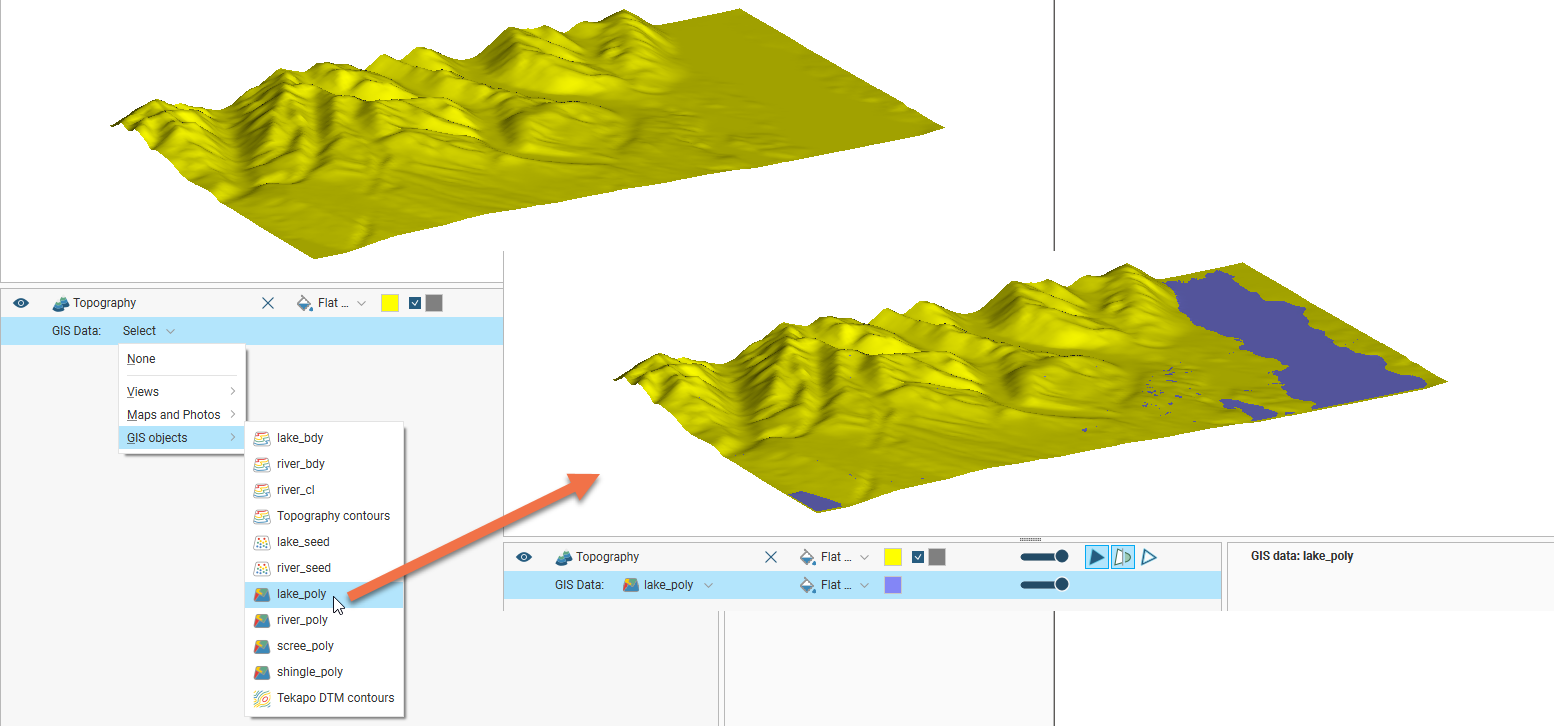
Next, add the topography to the scene and in the shape list, click on the topography’s GIS Data list. Select the object you wish to view from the GIS objects submenu:
Displaying GIS Data in Custom Topography Views
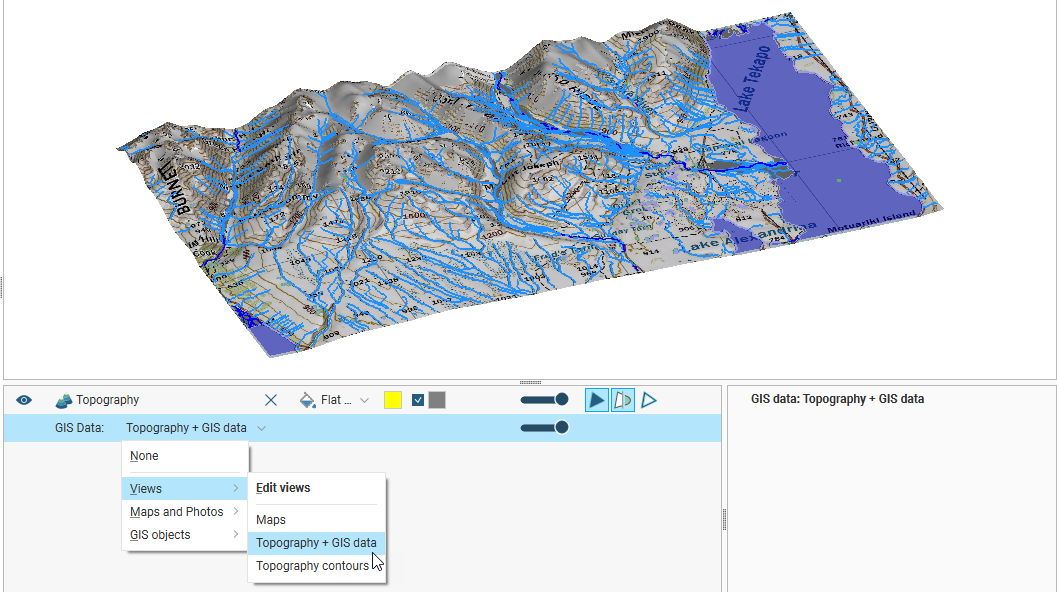
With custom topography views, you can display multiple GIS data objects along with images and contours draped on the topography. For example, here GIS data is displayed with a map:
To find out more about creating a custom topography view, see Custom Topography Views in the Defining a Topography topic.
Exporting GIS Data
To export GIS data, right-click on the GIS data object in the GIS Data, Maps and Photos folder and select Export. The Export GIS window will be displayed:
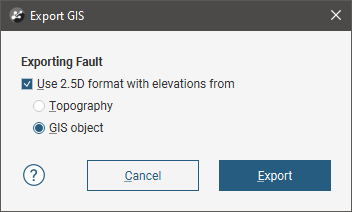
Select whether elevation information will come from the topography or from the GIS object itself, or untick the Use 2.5D format with elevations from box to export the object without elevation information.
Click Export. You be prompted for a filename and location.
Got a question? Visit the Seequent forums or Seequent support
© 2022 Bentley Systems, Incorporated