Defining Calculations and Filters
This topic describes how to define calculations and filters for drilling data tables, block models, imported points and some derived points. It is divided into:
- The Calculations Window
- Creating a New Calculation or Filter
- Understanding Errors Reported in the Errors Pane
- Building Calculations and Filters
- Null Values
The topic that follows, Catalogue of Metadata, Syntax and Functions, details each of the items in the pinnable Insert list and includes intentionally trivial examples to illustrate the use of the item, along with an explanation of the effect of the expression.
The Calculations Window
Right-click on a drilling data table to find the Calculations option, or on a block model or points table to find the Calculations and Filters option.
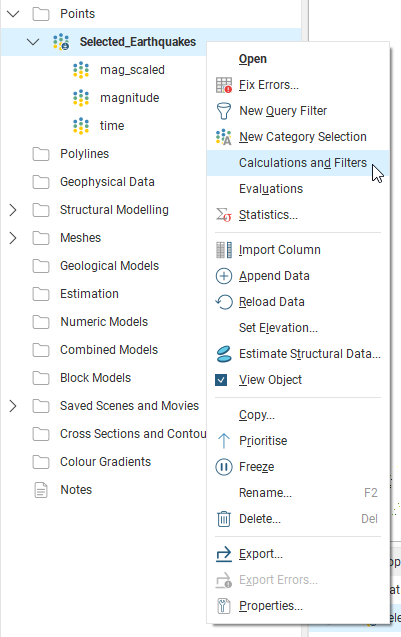
The Calculations and Filters option is not available for all points tables.
When the Calculations window is first opened, the Insert list is pinned to the right-hand side. You can untick the Pin Window box to get more screen space.
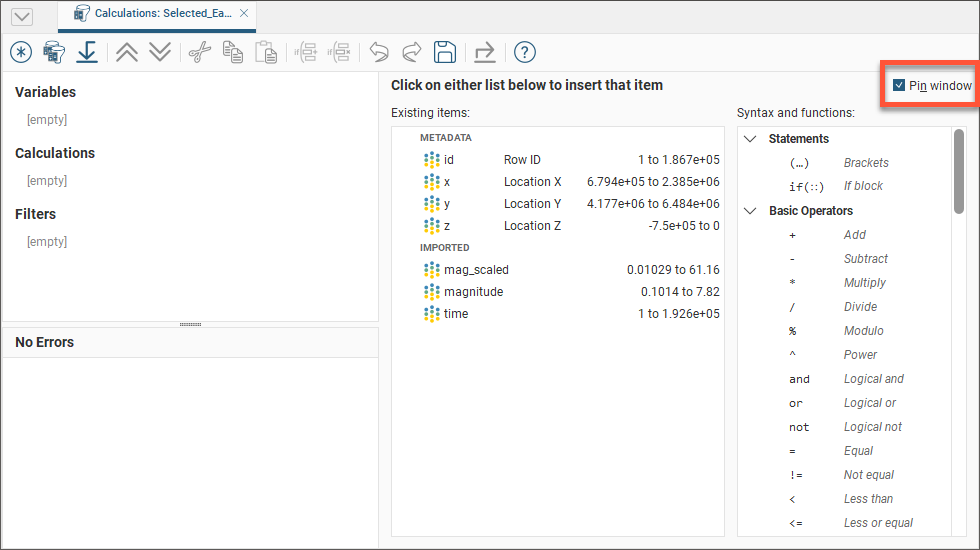
You can then select items by clicking on the Insert menu.

The toolbar in the Calculations window has three buttons that relate to copying, importing and exporting calculations and filters between block models, points objects and projects:

To copy calculations and filters from another points object or block model, click the Copy items from another object button (![]() ) and select the source to copy from.
) and select the source to copy from.
To export calculations and filters, click the Export button (![]() ). You will be prompted for a file name and location. The information is saved in *.lfcalc format, which is a binary file format. This format cannot be read or written by any other program.
). You will be prompted for a file name and location. The information is saved in *.lfcalc format, which is a binary file format. This format cannot be read or written by any other program.
To import calculations, click on the Import button (![]() ) and select a calculations file to import.
) and select a calculations file to import.
The arrow buttons allow you to quickly expand (![]() ) or collapse (
) or collapse (![]() ) all calculations and filters. You can also individually expand or collapse a calculation or filter by clicking on the = symbol next to the calculation or filter name.
) all calculations and filters. You can also individually expand or collapse a calculation or filter by clicking on the = symbol next to the calculation or filter name.
Cut (![]() ), Copy (
), Copy (![]() ) and Paste (
) and Paste (![]() ) buttons provide basic text operations on selected parts of equations.
) buttons provide basic text operations on selected parts of equations.
Undo (![]() ) and Redo (
) and Redo (![]() ) buttons provide the ability to move back and forward in the edit history for your equations.
) buttons provide the ability to move back and forward in the edit history for your equations.
Creating a New Calculation or Filter
Click the Create a new item button (![]() ) to add a calculation to the Calculations window.
) to add a calculation to the Calculations window.

The New Item windows gives you the choice of creating a variable, a numeric calculation, a category calculation, an RGB to hex colour or a filter. Select one of these options, enter a name for the new item and click OK.
The item will appear in the list on the left-hand side of the Calculations window.

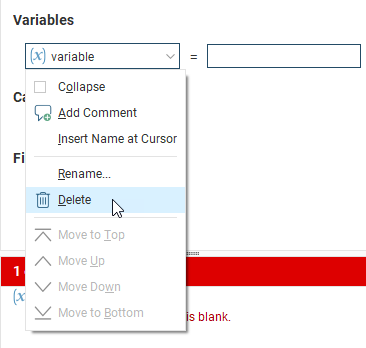
If you want to delete an item, click on it in the list, then select Delete:
Variables
A Variable is an expression that is given a name to make it simple to refer to the expression in other parts of the Calculations window. Note that ‘variable’ is a homonym/homograph that in a different context has a different meaning; ‘variable’ is at times used to refer to a mineral such as gold or silver. In the context of calculations and filters, the meaning is aligned with the use of the word in mathematics and scripting languages.
Using a variable in calculations can make the calculations easier to read and understand. It also makes it simple to reuse an expression multiple times in different places. Any time you find the same expression appearing in different calculations, or in different parts of a calculation, split that expression out into a variable. You can even use a variable to represent a constant value, such as a particular density measure. You can use it to hold a value you want to change as you experiment. If the value is used in multiple places in other expressions and calculations, using a variable in those places means you only need to change the value in one place instead of many.
Numeric Calculations
A Numeric calculation is an expression that evaluates to a number, or a number for each point or block evaluation used as input. A numeric calculation can be viewed in the 3D scene as a points object or block model.
Category Calculations
A Category calculation is an expression that evaluates to text, usually used to label a category or classification such as a lithology or grade description.
RGB to Hex Colour
An RGB to Hex Colour is a special evaluation, in conjunction with the rgb_to_hex function, that combines separate columns of red, green and blue colour values into an RGB hex form that can be used within Leapfrog Geo for colouring.
Filters
A Filter is an expression that limits the data to specified constraints.
Understanding Errors Reported in the Errors Pane
Items in the Existing items list or in the Syntax and functions list can be selected and added to the Calculations pane. While a calculation or filter is incomplete, the Error pane will identify what is needed to make the calculation valid.
The errors pane will report when the syntax of an expression cannot be validly interpreted. It cannot report when the expression is not correctly structured to do what was intended.
While you are in the process of constructing an expression, errors will be reported when the incomplete expression cannot be validly interpreted:

The messages provide the reason the expression is not valid or complete, but it cannot tell you how to complete or correct the equation.

Other errors will be displayed when the type of result doesn't match the sort of calculation selected when it was created. A numeric calculation needs to produce numbers, a category calculation needs to produce text results, and filters need to produce true or false (boolean) results.

Text needs to be identified by enclosing it with quotation marks, so it is not mistaken by the calculation engine as some sort of unspecified constant.

- divide by zero
- log of zero or a negative number
- log base of 1
- raising a negative number to a fractional power
- sqrt of a negative number
- numeric overflow, producing a number outside the range -1e308 to 1e308
- a null value (blank, outside, without_value) in a set
- multiple instances of the same value in a set
- referencing a column that has been deleted
- referencing a column that contains processing errors
Some processing errors will report that the problem is due to 'above errors', referring to errors higher in the errors list.
Processing errors will include a count of the number of affected blocks. Note that processing errors will only show up in the error list once processing has completed. You may need to unpause process execution and Run All processes.

You may have more than one error shown. As a rule of thumb, address the errors at the top first, as this corrective action may address the subsequent error.

Building Calculations and Filters
Items in the Existing items list or in the Syntax and functions list can be selected and added to the Calculations pane. Wherever a dotted box appears in the Calculations pane, you can add items and operators. Select an insertion point by clicking the dotted box where the item is required. You will see that the colour of the dotted box turns from black to orange to indicate that it is the currently selected entry box. Insert an item from one of the lists by clicking on it.

Select additional operators, constants, evaluations or other items as required, or type in values.

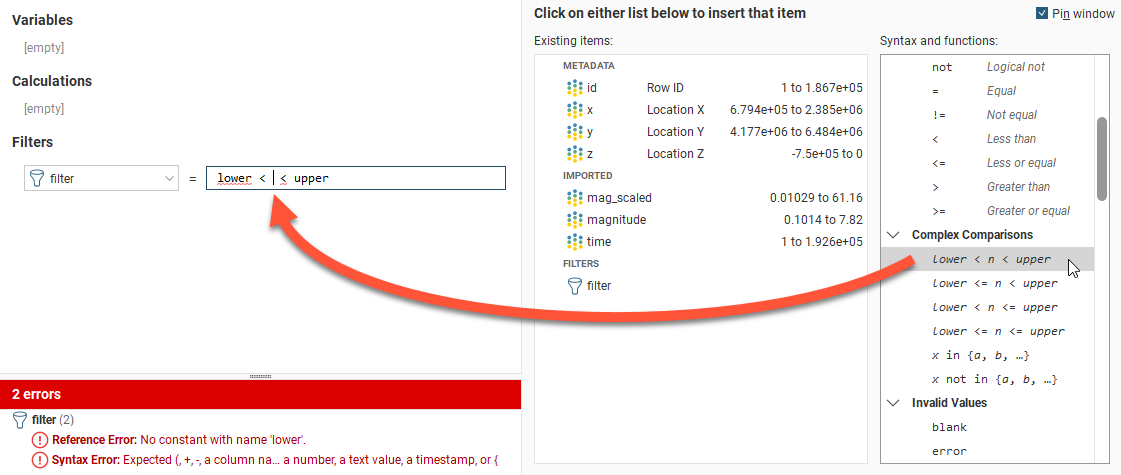
Some items you insert include placeholders that need to be replaced. For example, here, a value needs to be entered at the cursor position and the terms ‘lower’ and ‘upper’ need to be replaced with other items.
The if (::) conditional statement can have additional rows added to it. Insert the cursor where you want to insert a row and then click the Add Row button (![]() ) and a row will be added above the selected line.
) and a row will be added above the selected line.
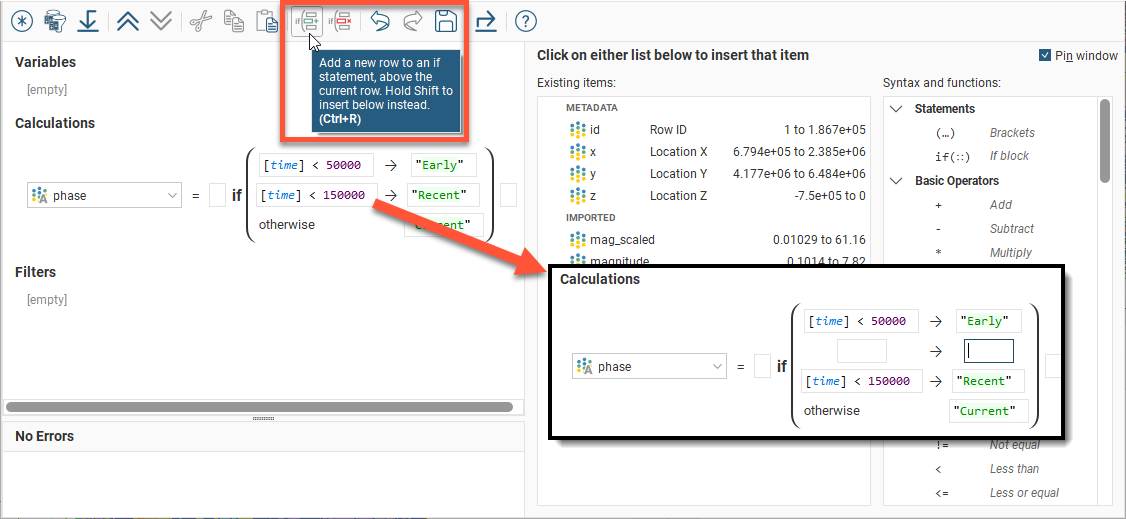
You can hold the Shift key to add the row below the cursor. To delete the selected row, click the Delete Row button (![]() ).
).
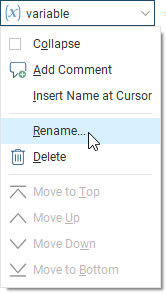
A calculation or filter can be renamed after it has been created. Click on its name and select Rename from the menu that appears:
Examples of Variables
Variables can produce numeric, boolean, or text results. You may create a variable because using a variable in other expressions can make them easier to read and understand, or it can let you change a value in just one place, even though it is used in many expressions.

While producing results similar to numeric calculations, category calculations or filters, variables cannot be viewed on the block model in the 3D scene.
Example of a Numeric Calculation
Numeric calculations must produce numeric results, or an error will be reported.

The results of the numeric calculation for the block model or points object can be viewed in the 3D scene by right-clicking on the numeric calculation entry in the project tree and selecting View Object.

Example of a Filter
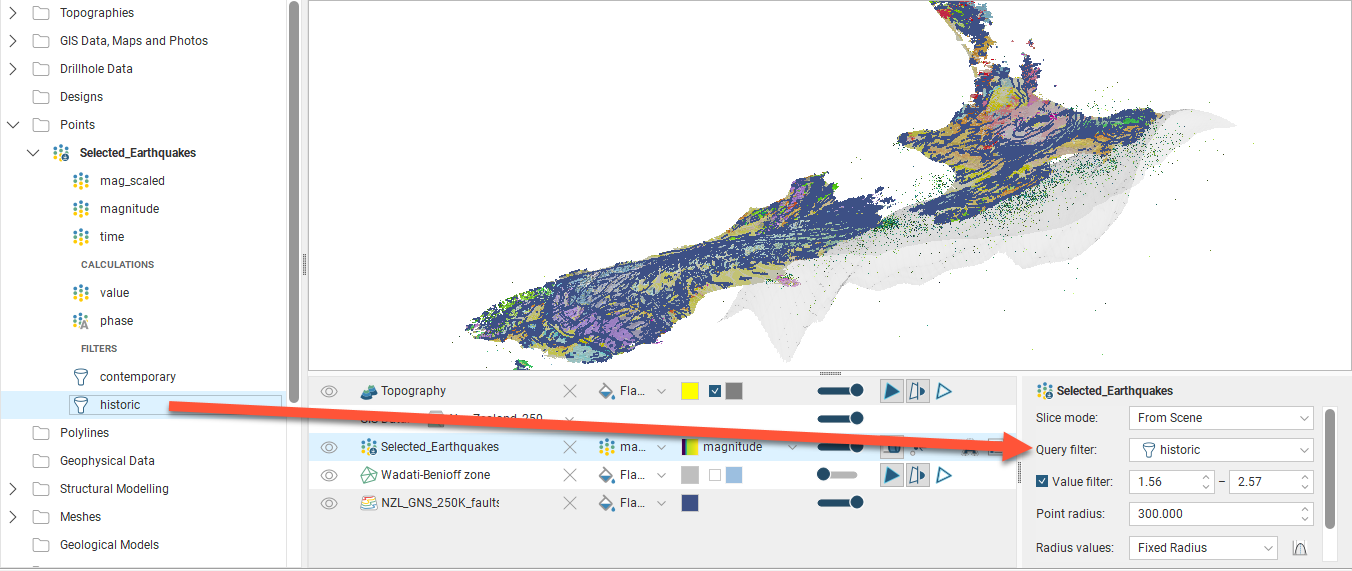
In this example, one of the selectors from the Complex Comparisons options was chosen from the insert list. The value that will be tested is to be added at the insertion point between the comparators, and the placeholder words ‘lower’ and ‘upper’ need to be replaced with constants.

Here the numeric column [time] has been specified as the value that will be tested, and lower and upper limits have been specified.

When you select View Object for the filter in the project tree, the Query filter is set to the selected filter in the shape properties panel.
Example of a Category Calculation
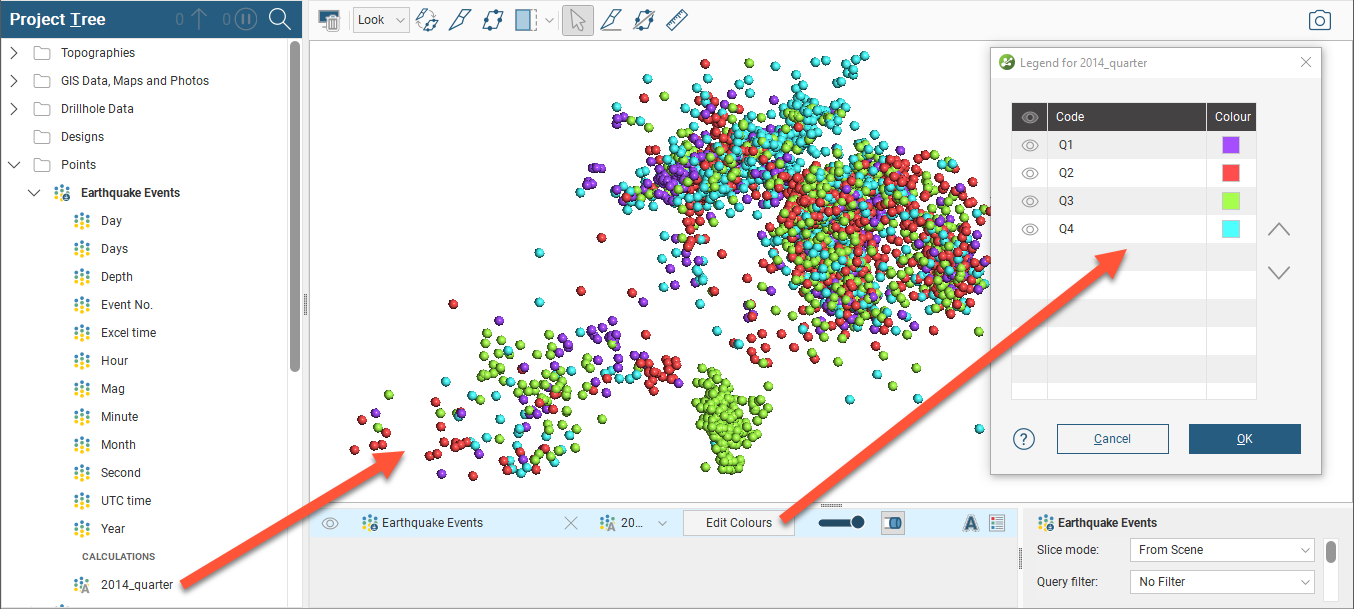
This example uses a category calculation to organise events into quarters for the year 2014 using the if(::) conditional statement.
The if(::) conditional statement contains two lines by default. Note the guiding cues within the dotted entry boxes. The first line describes the test to be performed that, if it evaluates as true, will produce a specified result. The ‘otherwise’ condition on the second line captures all the tested conditions that did not evaluate as true in the test on the first line, and these all produce an alternate result:

In this case, all the values outside of the range of the filtering expression [Year] = 2014 are outside the period of interest. We add the expression as the ‘test’ condition, and specify the label "2014" as the first result, and use the label "Not Considered" in the bottom line for the ‘otherwise’ condition. So the labels are not mistaken by the calculation engine as some sort of unspecified constant, make sure labels are identified using quotation marks:

We need to extend this trivial example for organise the period into quarters, and to do this we can nest if(::) conditional statements. Replace the "2014" label with a new if(::) item:

Now if values pass the filter in the first test, they then get to be sorted using the second if(::) block. This time we will test the month field and if it is less than or equal to 3 we will classify this as "Q1":

Shift-click the Add Row button (![]() ), and a new conditional row is added below the current one, where we can specify that a Month value less than or equal to 6 will be classified as "Q2". Only values between 4 and 6 will be classified as "Q2" as the first line will have already classified all the values under 4 as "Q1".
), and a new conditional row is added below the current one, where we can specify that a Month value less than or equal to 6 will be classified as "Q2". Only values between 4 and 6 will be classified as "Q2" as the first line will have already classified all the values under 4 as "Q1".
Repeat to add another row specifying a Month value less than or equal to 9 to be classified as "Q3".
This leaves the ‘otherwise’ row in the nested if(::) block to catch values above 9 which are labelled "Q4":

The new 2014_quarter calculation we have constructed can be added to the scene view. Click the Edit Colours button in the shape list to select which categories are visible.
Null Values
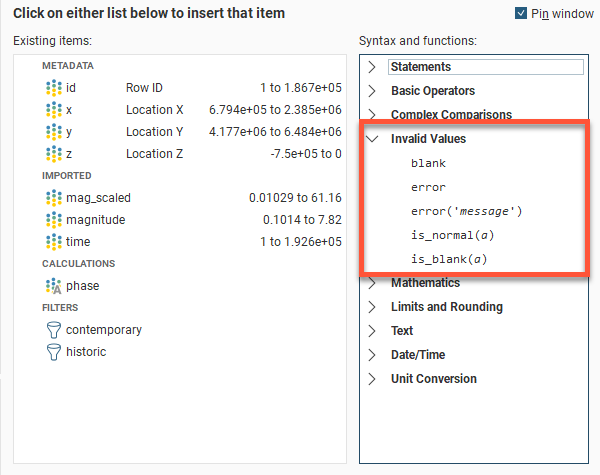
Leapfrog Geo can differentiate between different types of invalid or null values, which are shown in the Calculations window:
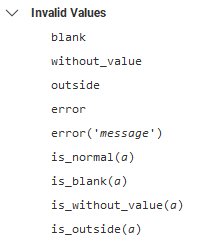
Block models have additional invalid values:
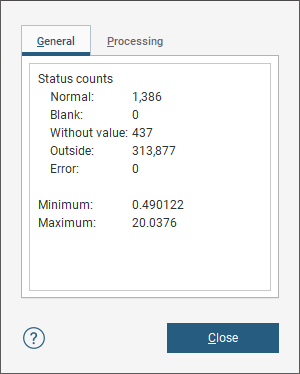
You can see how many points or blocks of each normal or invalid status occur in an evaluation by right-clicking on the evaluation in the project tree and selecting Properties:
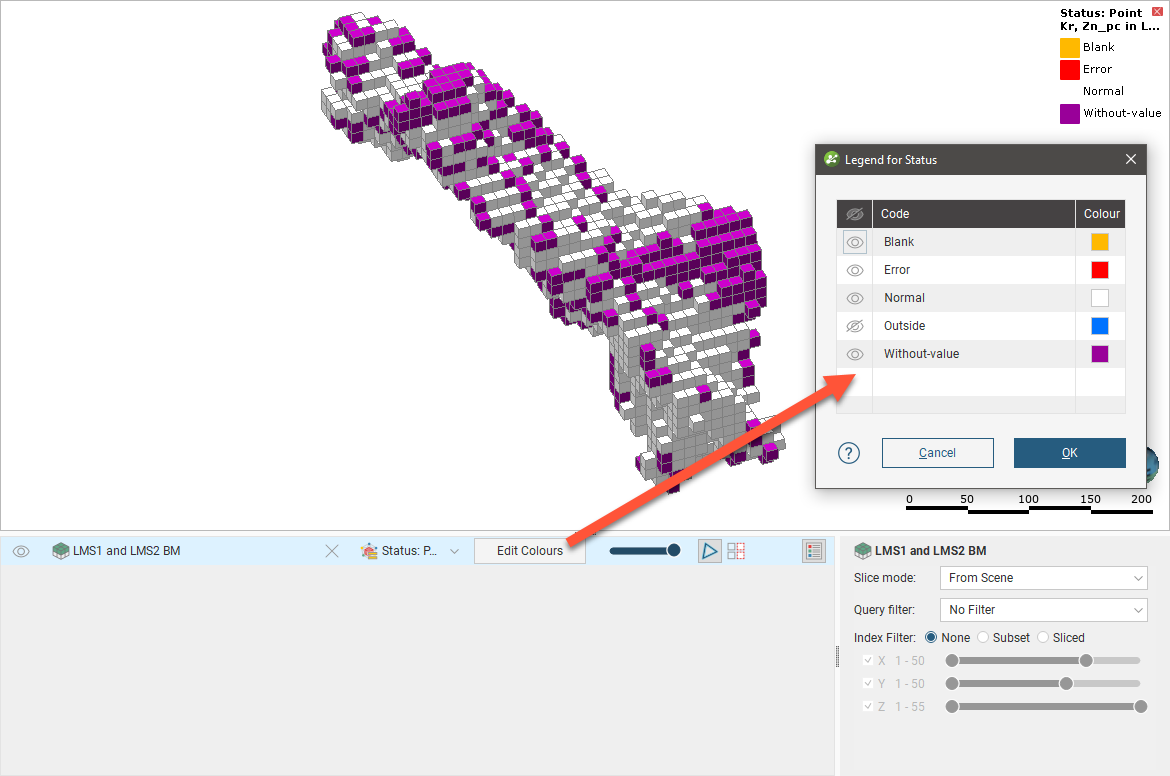
Invalid values can be displayed in the scene. When a block model is displayed in the scene, you can choose between displaying evaluation values or the Status. Highlighted below is a Kriging evaluation, shown displayed on the block model. Next to the Kriging evaluation in the dropdown list is a Status option:
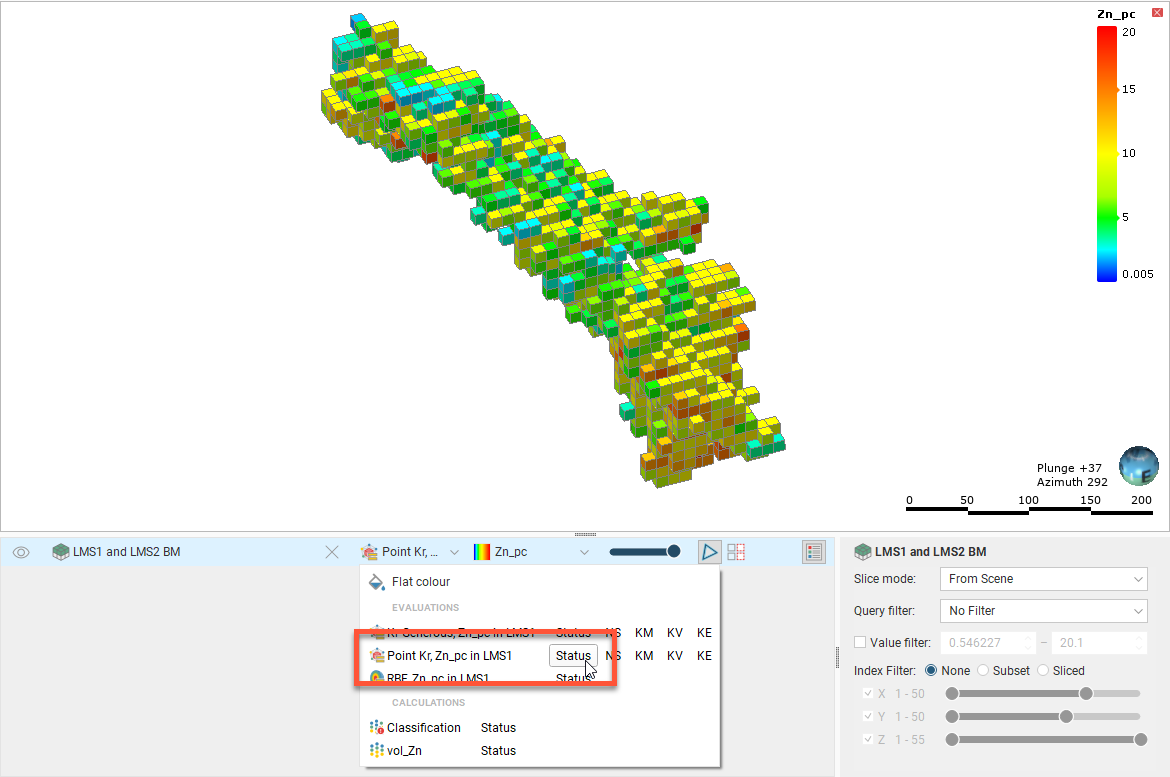
When the status option is selected, the model is displayed by block status. Click Edit Colours to change what status values are displayed.
With block model statistics, you can view statistics for all evaluations and calculations made on a block model or sub-blocked model. Statistics can be broken down into categories and organised by numeric evaluations and calculations.
Got a question? Visit the Seequent forums or Seequent support
© 2023 Seequent, The Bentley Subsurface Company
