
Majority Category From Other Table
You can flag intervals in an interval table with category data from a different interval table, adding this category data as a new column to the table. As an example, if you have an assay table and a geology table, you can use this to add the rock information to each of the assay intervals, avoiding having to back-flag the geology information from a geological model, or having to create a merged table. You can also use this capability to back-flagging economic compositing status.
Because this evaluation takes place on a per-drillhole basis, it is necessary that the category data is in the same drilling cache as the targeted interval table.
The category that is assigned to an interval is based on a majority percentage basis. The category that makes up the highest percentage of the interval by length is assigned to the interval in the new column. If two categories are equally represented, the category that occurs further up the drillhole (closest to the collar) is assigned to the interval.
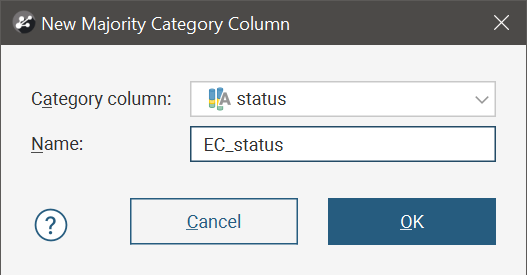
To back-flag the category data onto an interval table, right-click on the interval table in the project tree, select New Column, then select Majority Category From Other Table. The New Majority Category Column window will appear.
In the Category column dropdown will be a list of all the available category columns in the data cache that can be added to the interval table as a new column. Select one, then provide a suitable Name for the new column.
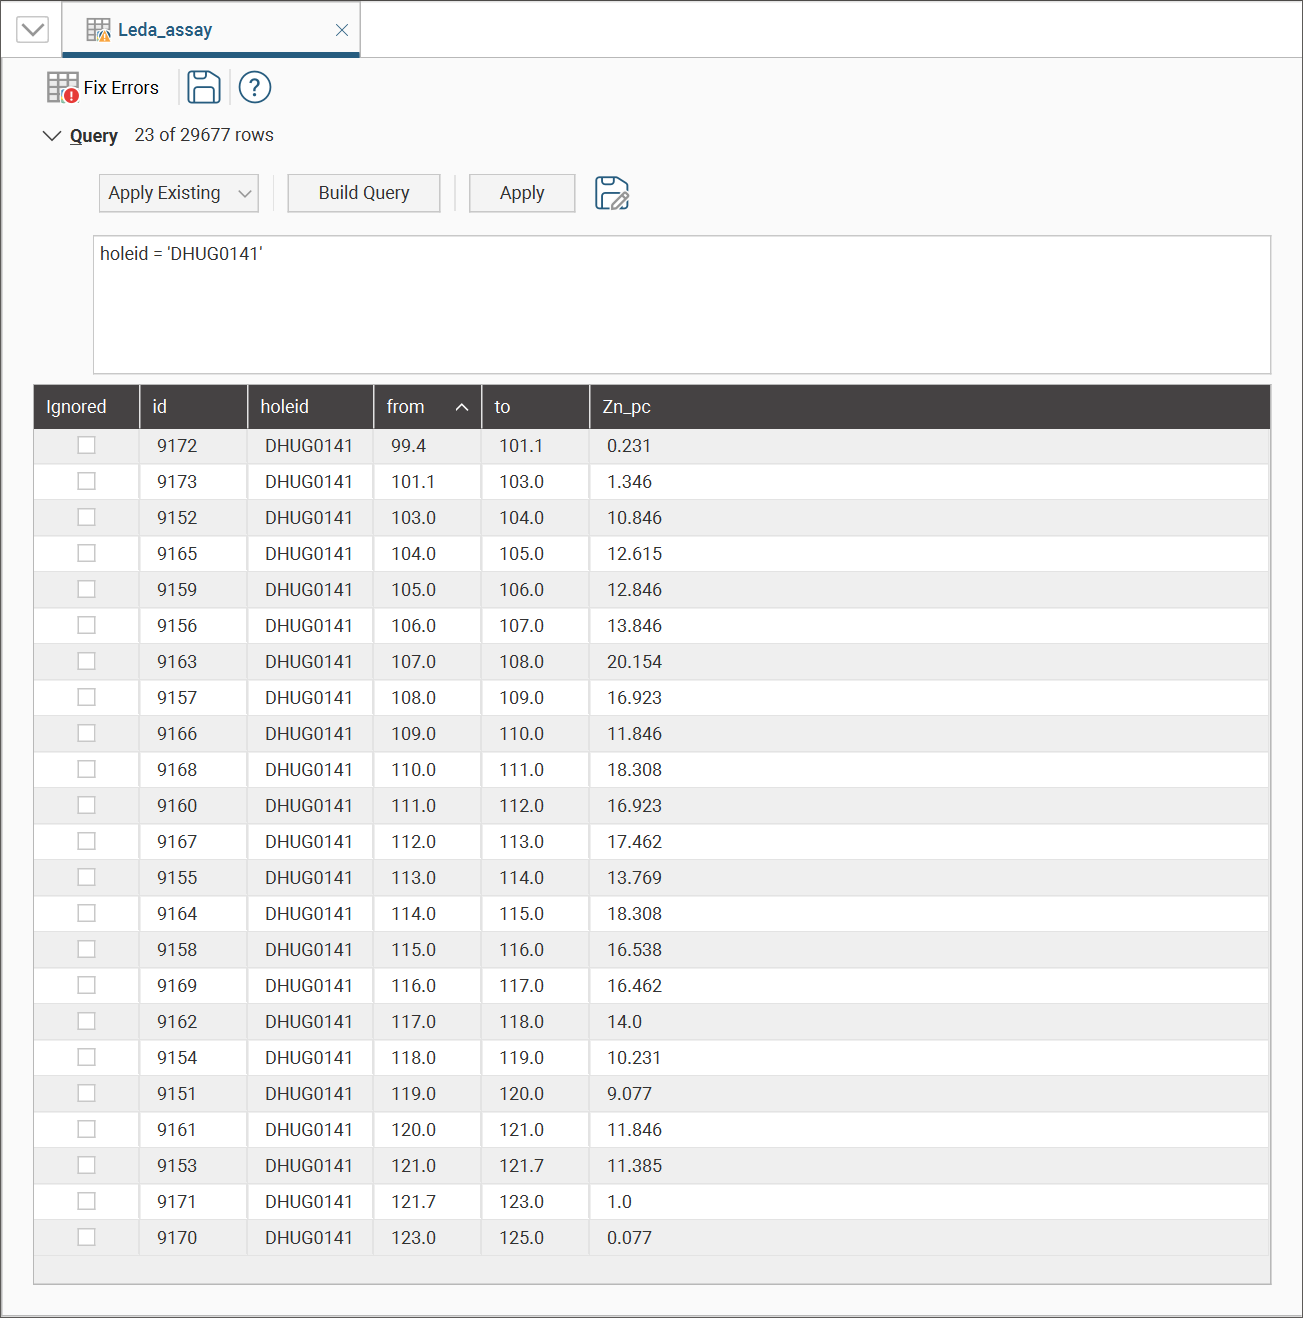
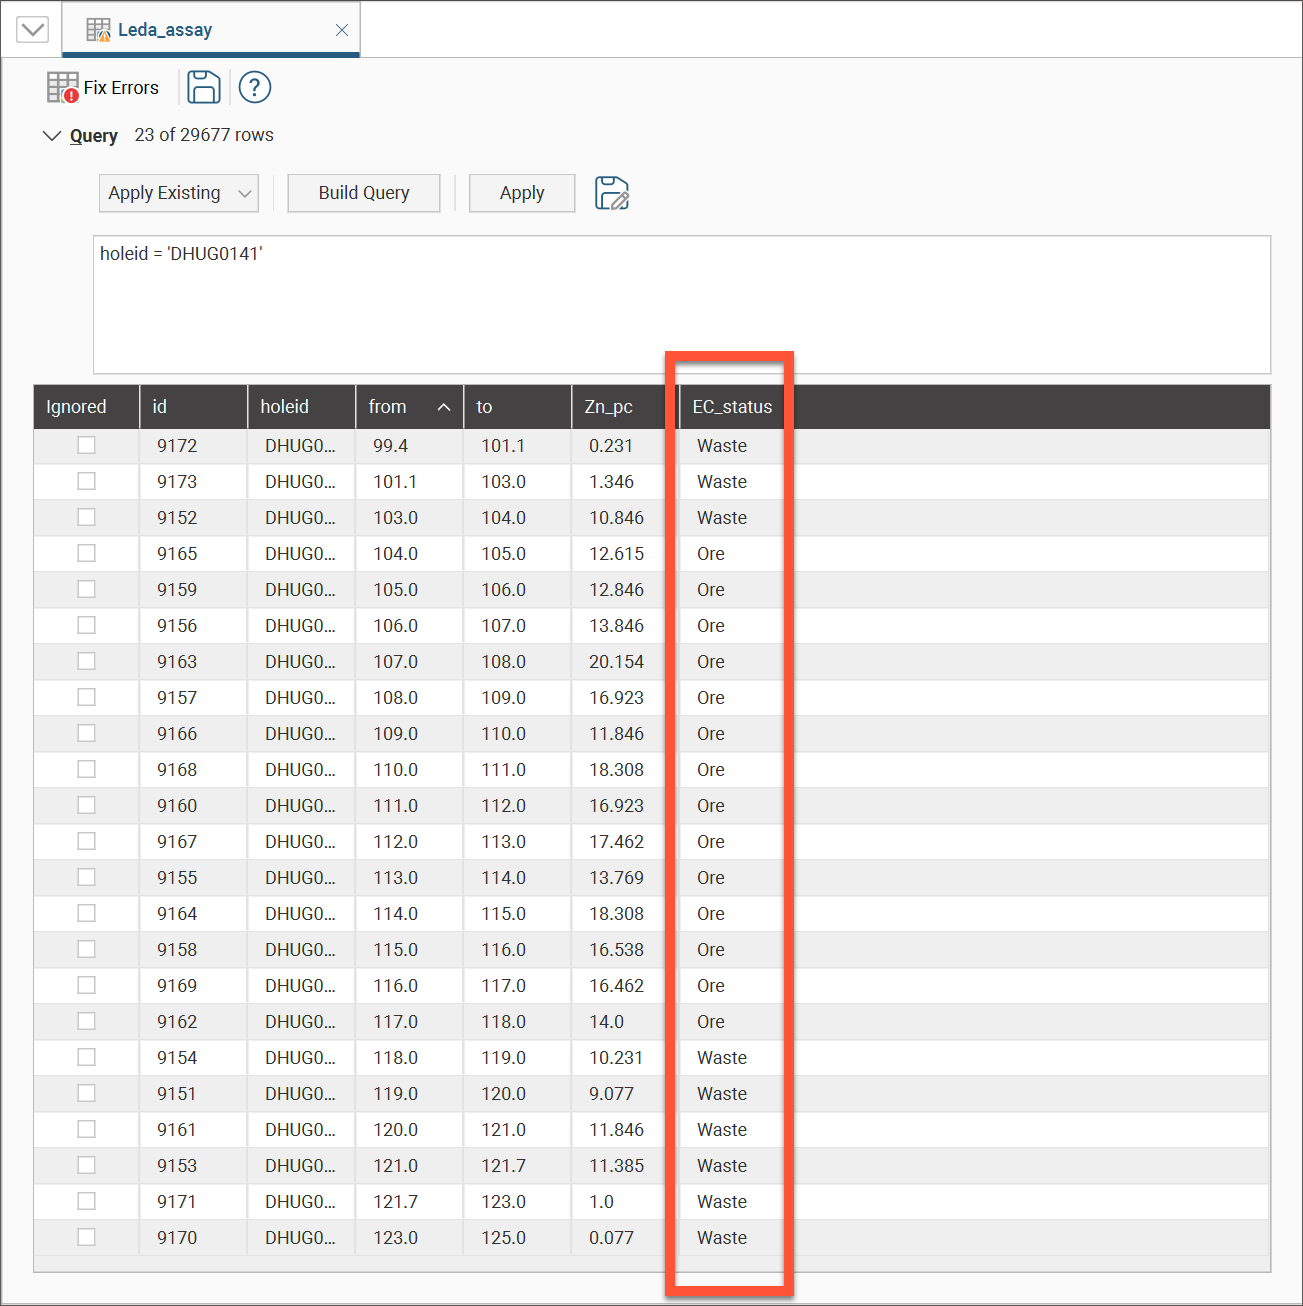
Here the intervals for a single drillhole from an assay interval table are shown.
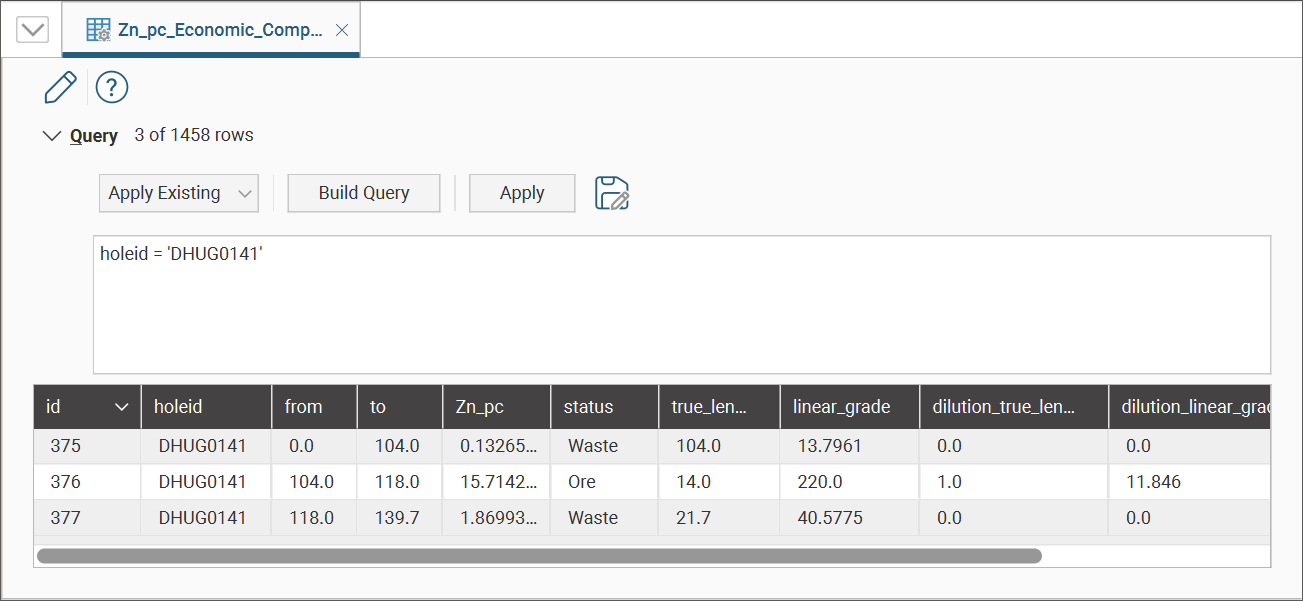
An economic compositing calculation has been applied to this assay data. Here is the composited data table filtered to show the same drillhole.
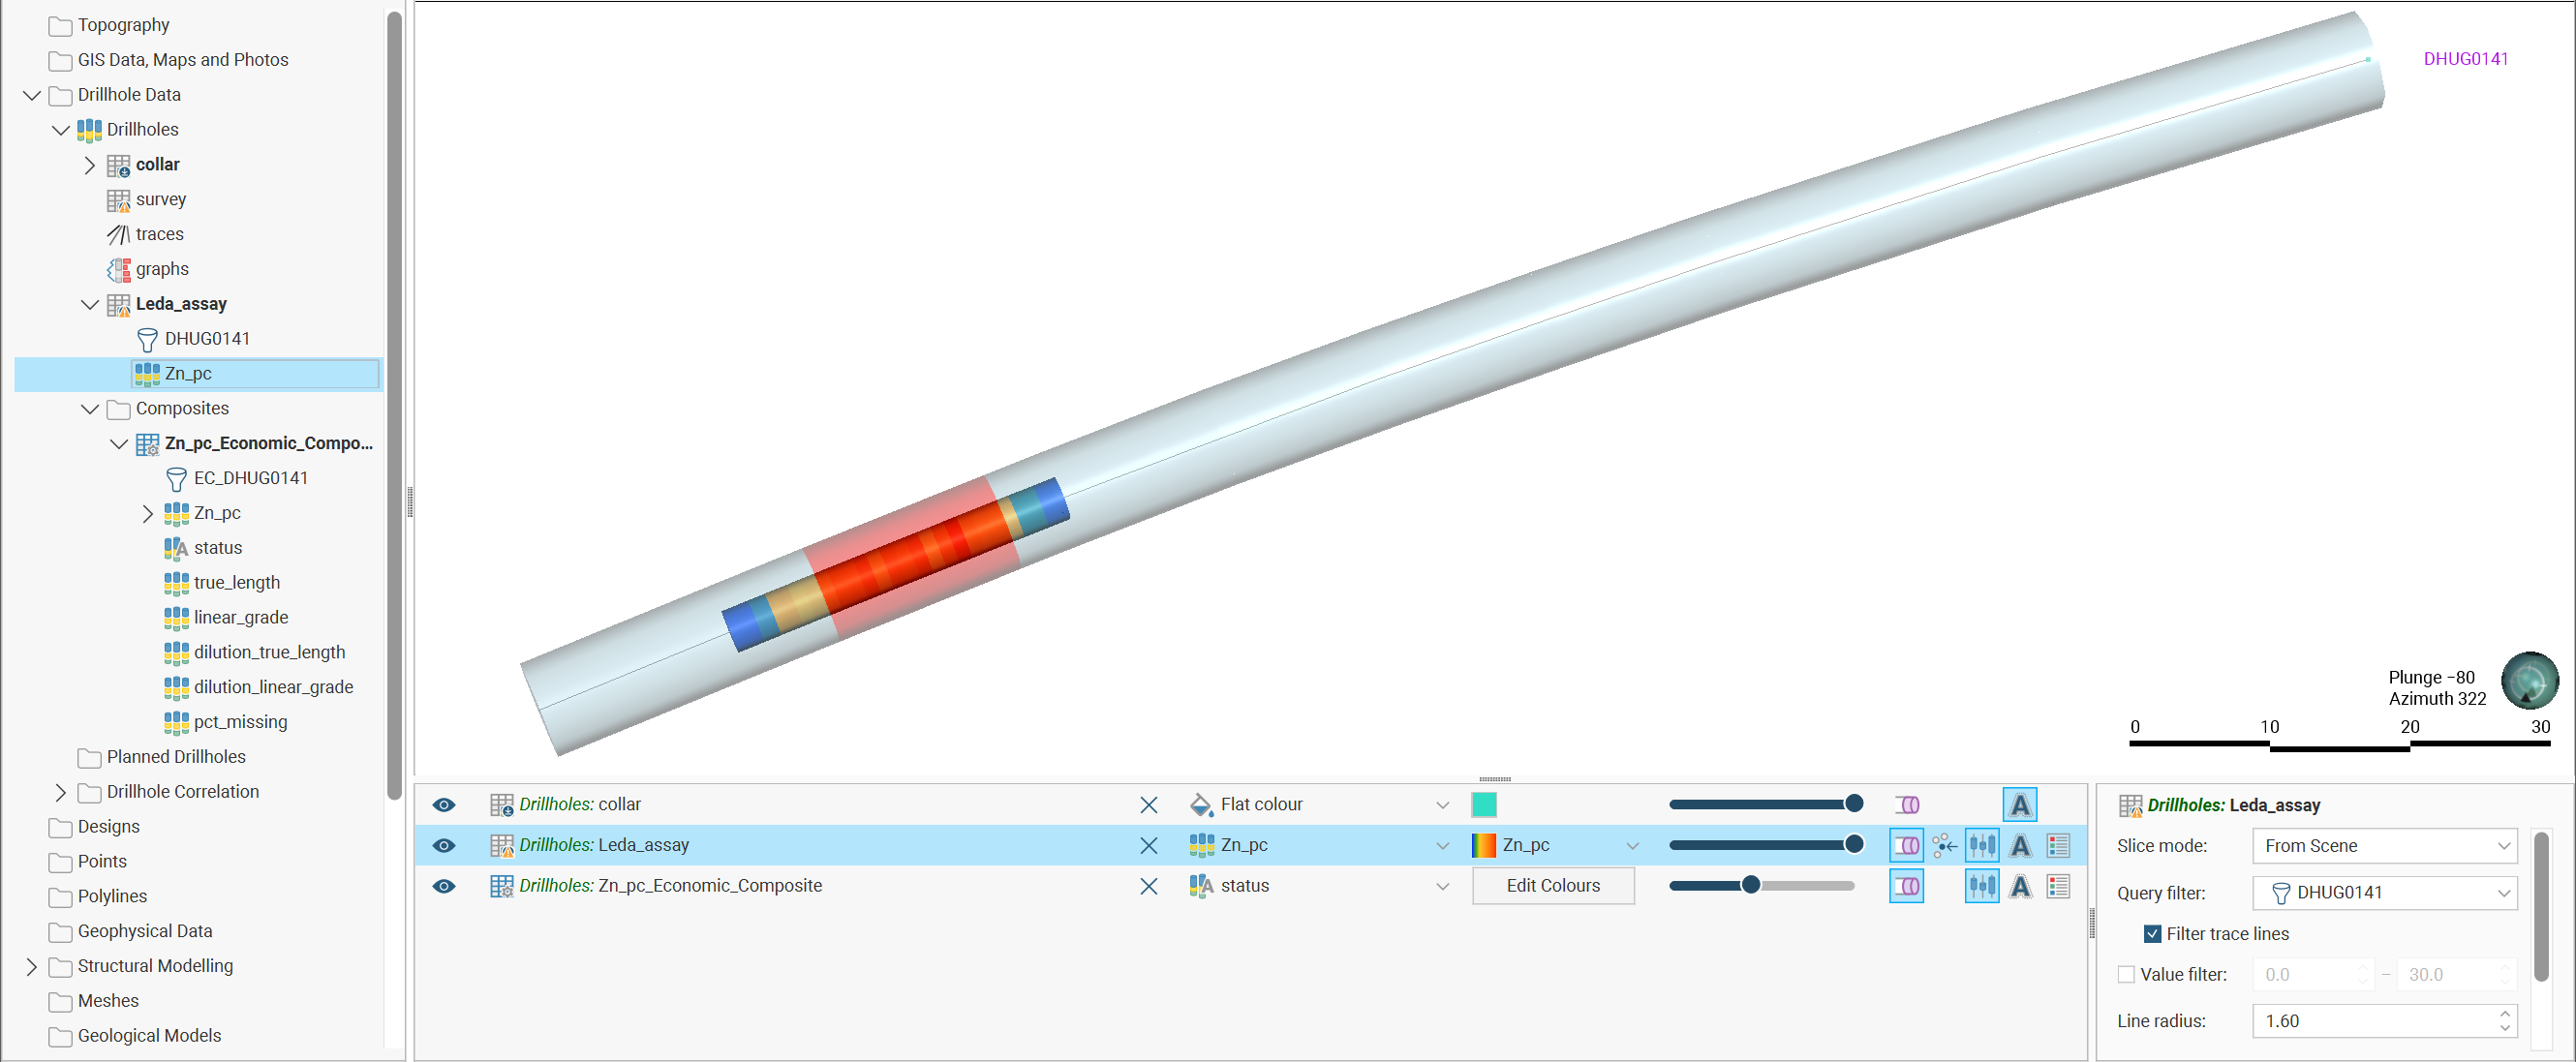
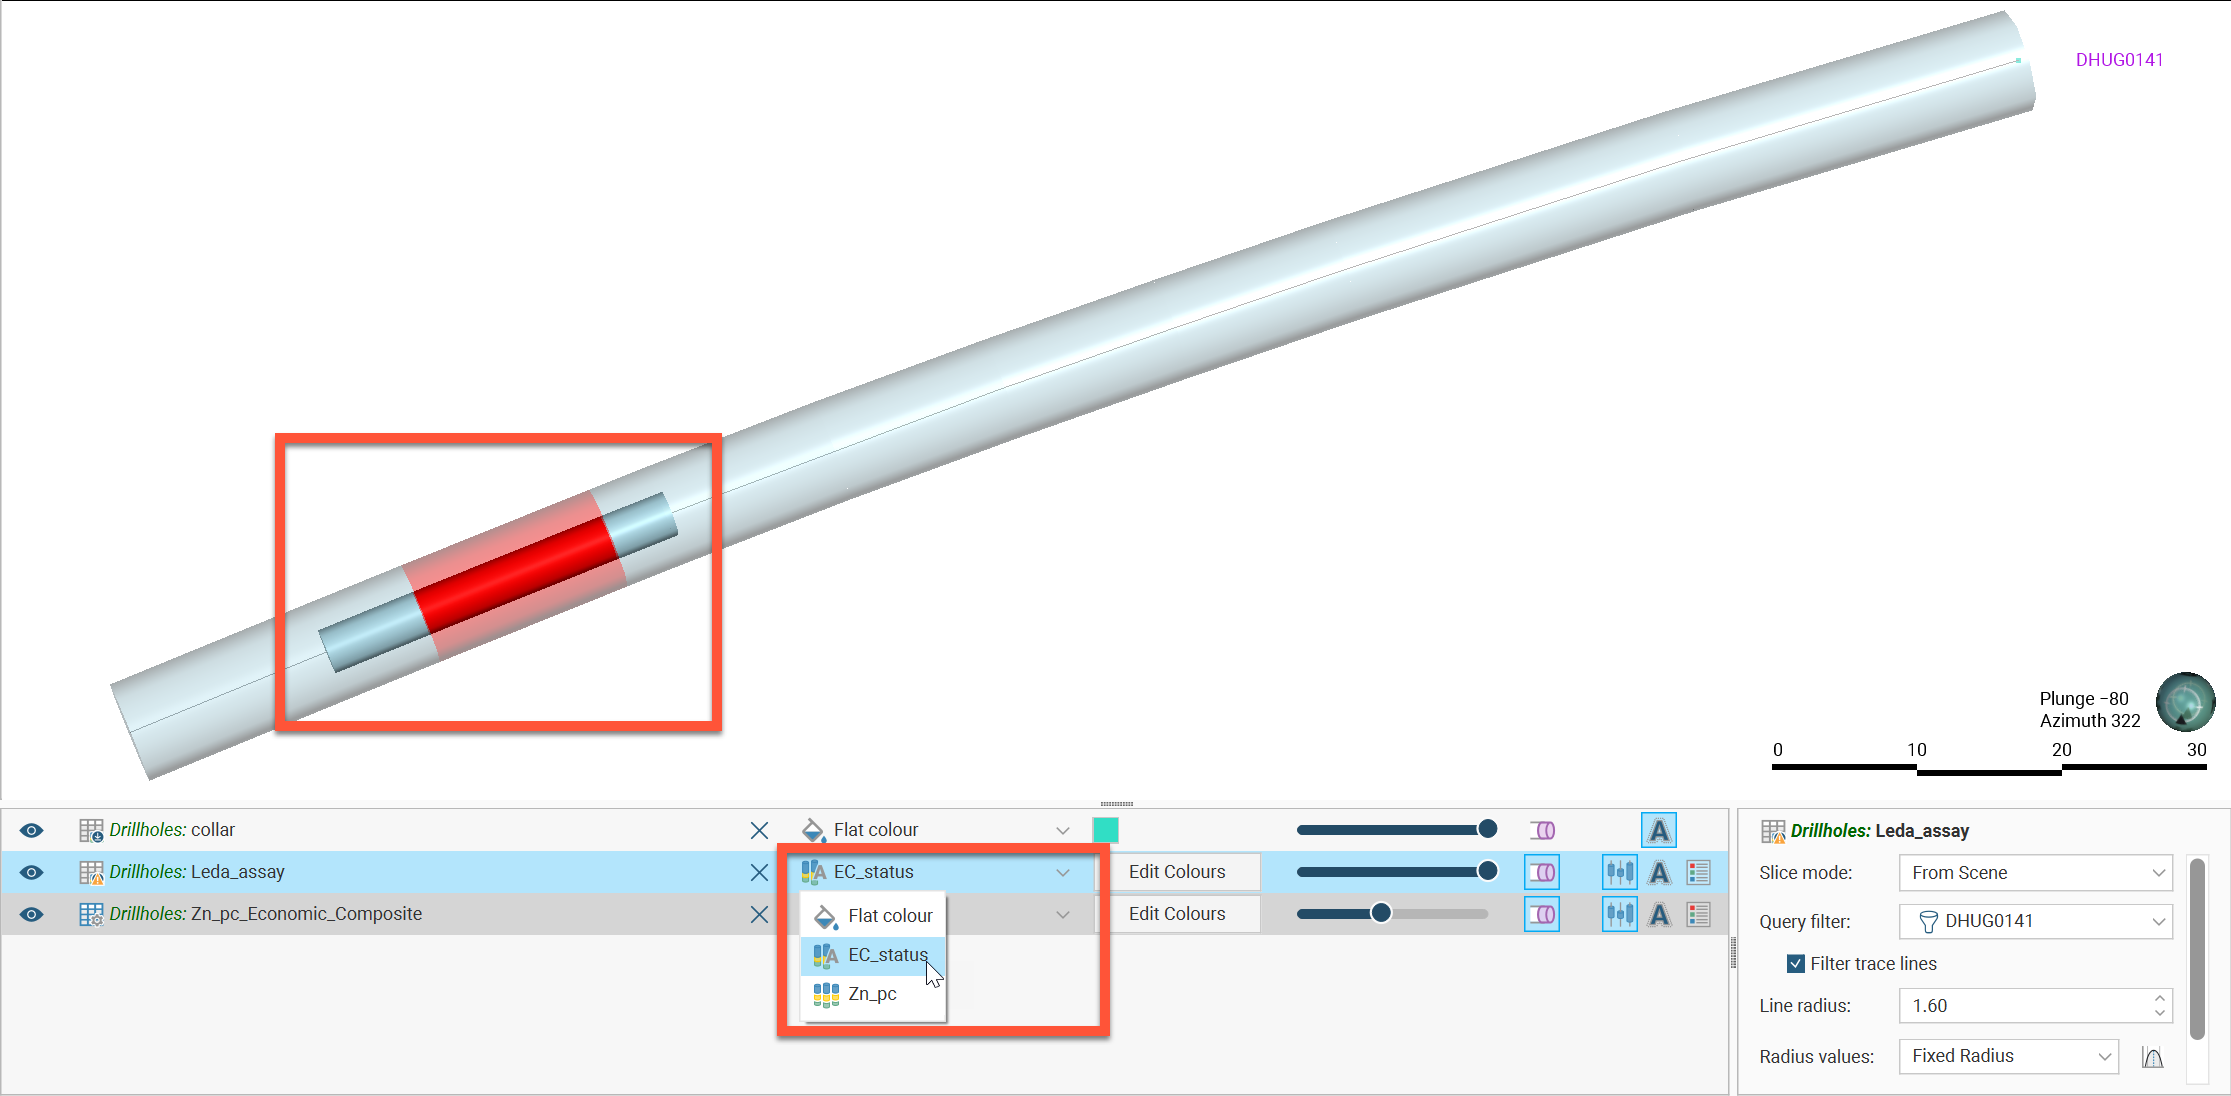
Both the interval table showing the assay values and the economic composite table showing the status category can be added to the scene. To view both simultaneously, the economic composite has been made slightly thicker and translucent.
Once the majority category has been added to the interval table as a new column, each interval is assigned a value in the new column that corresponds to the category that was dominant for that interval range in the drillhole. Note that no new intervals are created; although the economic compositing table had row ranges that extended from the start to the end of the drillhole, the interval table does not have intervals describing the entire length of the drillhole, and the original interval ranges are .maintained.
Once the majority category has been added to the interval table, that column can be selected to be displayed for that table in the scene. Here the assay table has been changed to show the newly added category column, and it can be seen to match up with the original economic compositing information. Note that the assay drillhole does not extend to the ends of the drillhole trace because the assay table only contains interval data between 99.4 and 125.
Got a question? Visit the Seequent forums or Seequent support
© 2023 Seequent, The Bentley Subsurface Company