
Majority Composites
Category data can be composited into interval lengths from another table or into fixed interval lengths. The compositing is based on a majority percentage where each interval is assigned a category based on the category that makes up the highest percentage of the new interval. If two categories are equally represented, the category that occurs further up the drillhole (closest to the collar) is assigned.
This is useful for comparing lithology and assay data; the intervals from an assay table can be applied to a category column to produce a new lithology column with the shorter intervals typical of assay tables. The majority composite column can then be used to create a merged table containing both lithology and assay data.
Creating a Majority Composite
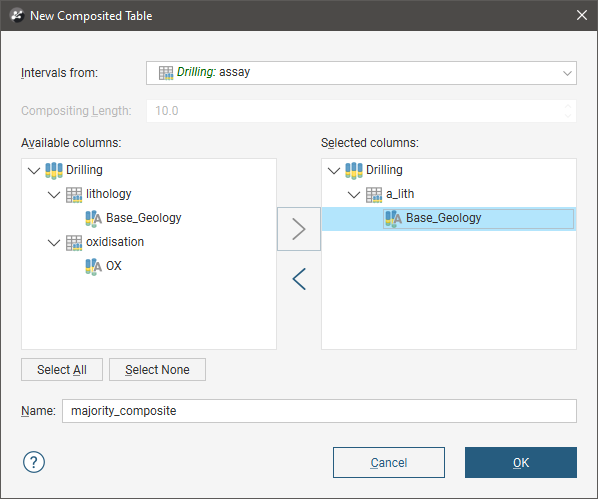
Drilling data is composited from the Composites folder, which is in the project tree as part of each drilling data set. To create a majority composite, right-click on the Composites folder and select New Majority Composite. The New Composited Table window will appear. Select the interval table that will be used to specify the intervals for the new majority composite or specify a fixed Compositing Length. Next, select the columns that will be composited.
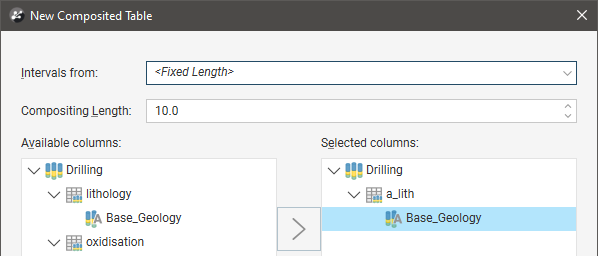
You can also used fixed-length intervals by selecting the Fixed Length option from the Intervals from list, then setting the Compositing Length:
Click OK to create the composite. The composite will be added to the Composites folder in the project tree. You can edit it by right-clicking on it and selecting Edit Composited Table.
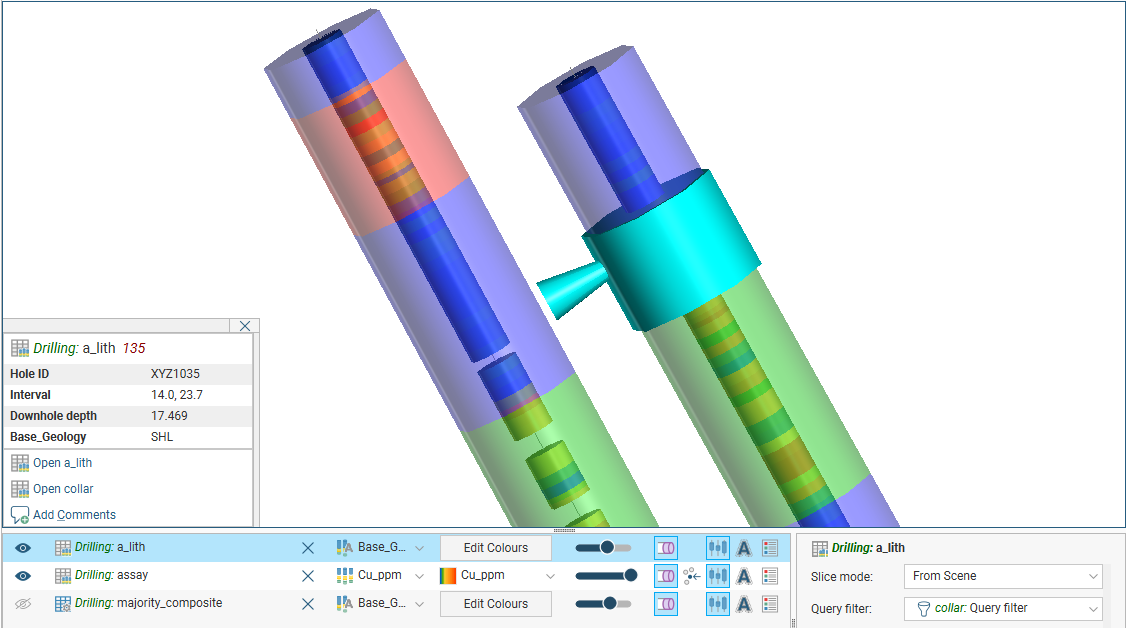
Here assay intervals are shown inside the much longer lithology intervals. The selected interval goes from 14.0 to 23.7 metres:
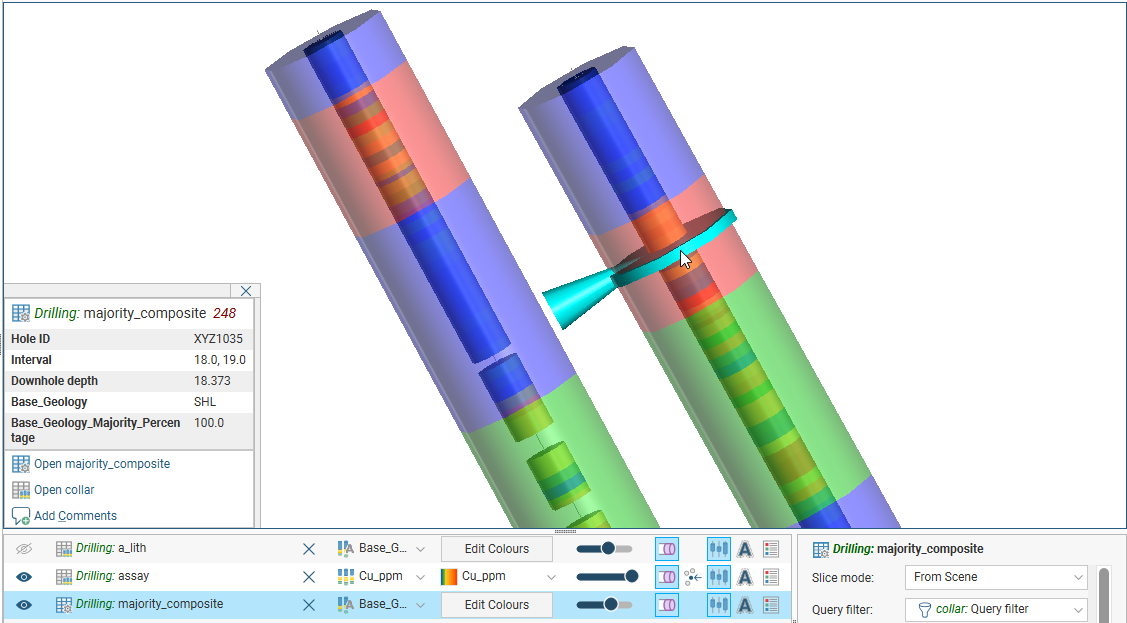
Here a majority composite has been created based on the lithology table using the assay table intervals. The category column displayed in the scene appears similar to the category column used to create it, but selecting an interval in the scene shows that the lithology has been composited into smaller intervals that match the assay intervals:
Viewing Majority Composite Statistics
Once you have created a composited table, you can view statistics on the table. To do this, right-click on it and select Statistics. The following options are available:
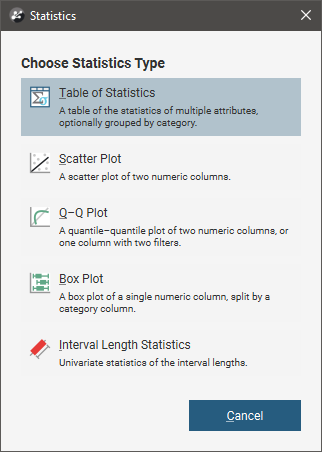
See the Statistics topic for more information on each option:
The Interval Length Statistics graph is a univariate graph, so for more information on the options available, see Univariate Graphs in the Statistics topic.
Right-click on the numeric columns and select Statistics to view information about the composited values.
Got a question? Visit the Seequent forums or Seequent support
© 2023 Seequent, The Bentley Subsurface Company