
Resource Reports
The features described in this topic are only available if you have the Leapfrog Edge extension.
The resource report is a pivot table for reporting on resources and reserves in accordance with standards, with the freedom to customise the table to the unique needs of the project requirements. A resource report can display multiple categories and multiple numeric columns.
To create or view a resource report, right-click on a block model in the project tree and select Report. In the window that appears, click the Select Columns button to choose from the Category columns and Value columns evaluated onto the block model. If you wish to set a Cut-off value, select from any numeric column evaluated on the block model and set the cut-off value. The column selected for the Cut-off does not need to be a column included in the resource report. You can also apply a Filter to the report.
Select between Block size is in metres and Block size is in feet to ensure units are correctly converted. Select Constant value from the list of Density options and specify a numeric constant, or select a density data measurement from the numeric columns listed. Specify the appropriate Density unit to match the Density selection.
Select an option from Additional weighting when you want the selected columns scaled by the value in another column. This is especially useful when you have a proportion column you wish to use to weight the report data, such as a volumetric proportion. You may need to use the Weighting unit to specify if the column selected is a decimal value or a percentage if Leapfrog Geo cannot determine this automatically.
It is not advisable to use a stored proportion Additional weighting along with a Proportion of block volume filter. This is because the report would be calculating a proportion of a proportion. To make this calculation assumes these proportions can be simultaneously applied, which may not be the case, resulting in incorrect results.
You can also choose to Show material content columns, Show empty rows, Show volume column and Show density column.
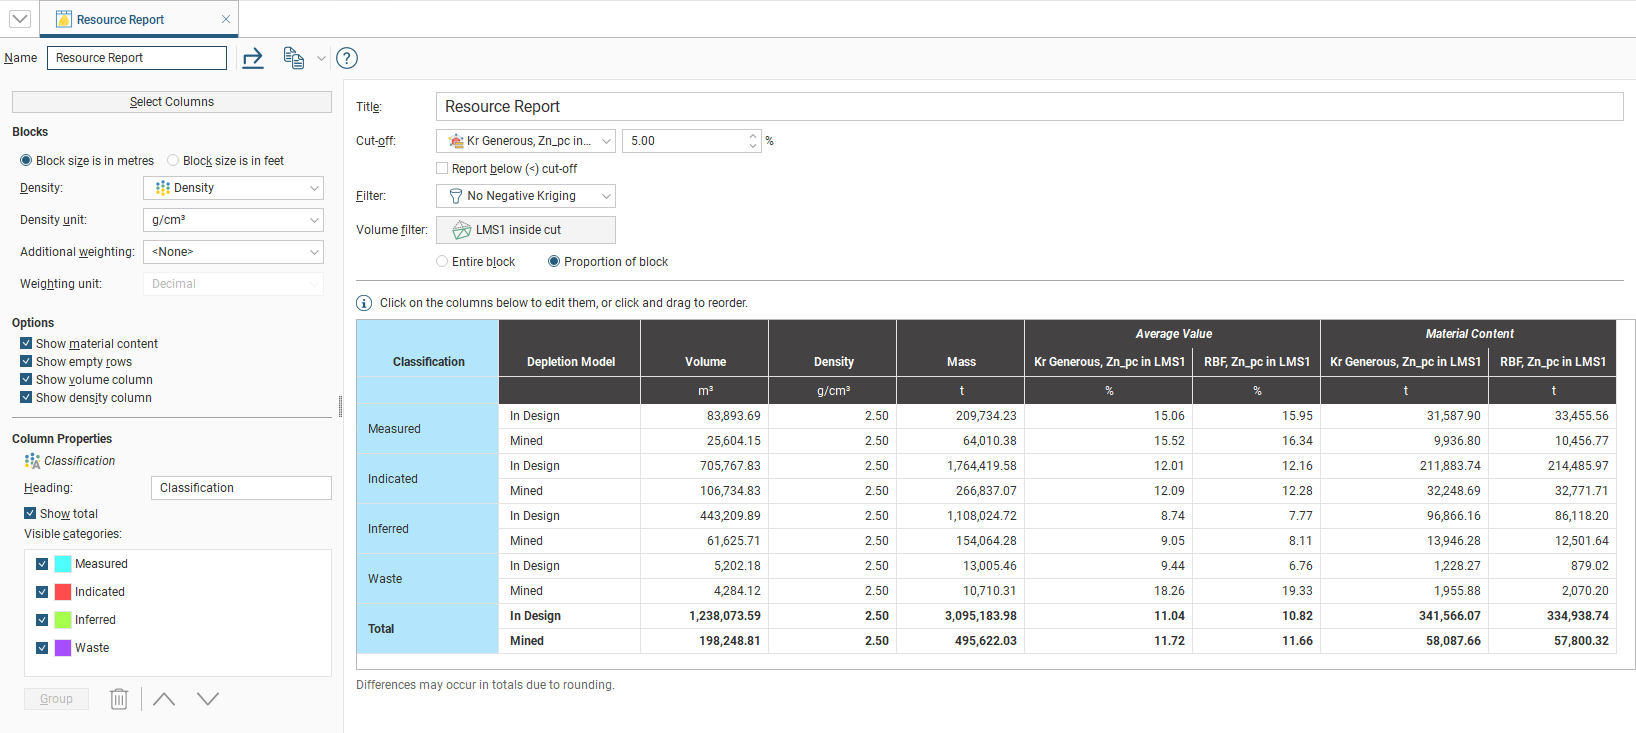
To only include blocks in the report that are beyond a specific threshold, select a data column from one of the options available in the Cut-off dropdown list, then specify the threshold in the adjacent numeric field. In many cases, the preferred behaviour is to report on blocks that exceed the specified threshold, but you can tick the Report below (<) cut-off box to select blocks under the threshold.
Only blocks that are selected by the Filter will be reported on. Filters created by Calculations and Filters will appear in this dropdown list, and
If you have an estimator that produces outside, blank, without_value or error statuses for blocks, these will result in #Invalid entries in the resource report table. To address this:
- Create a filter (or modify your existing filter) to discard blocks with an invalid status, and select this filter in the Filter field above the resource report table, or
- Create a calculation that sets invalid values to an appropriate acceptable value, and select this column instead.
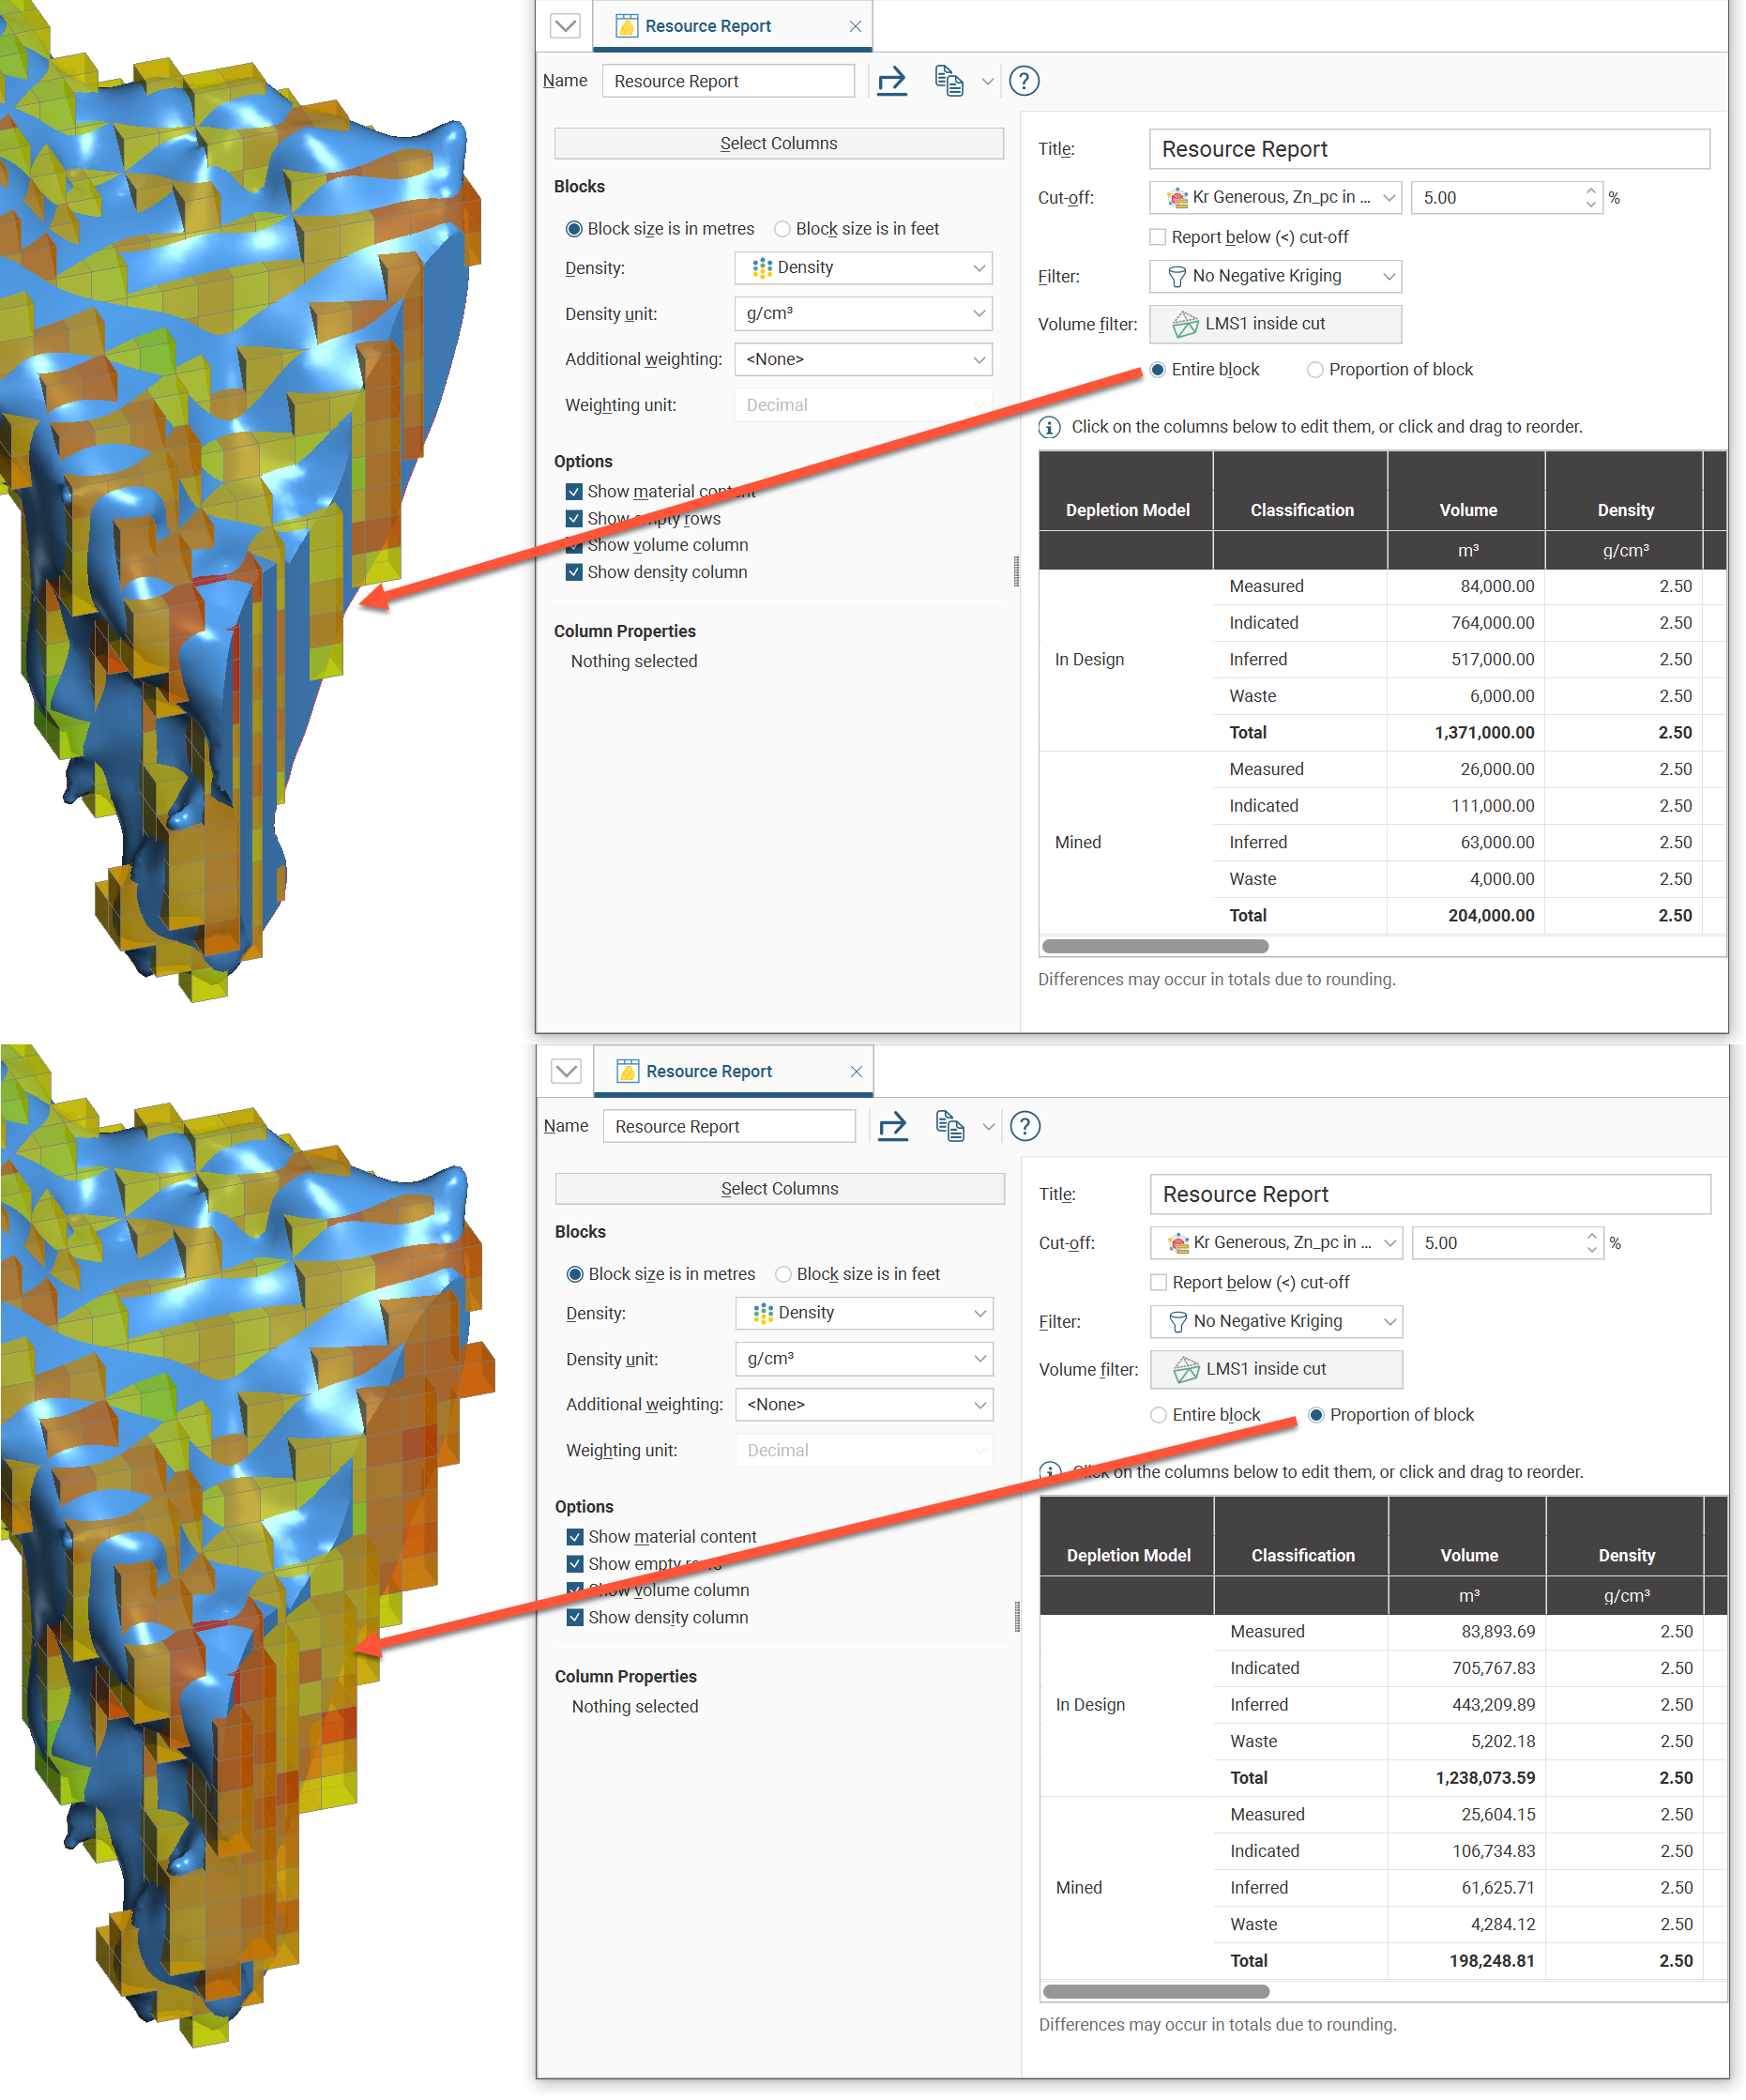
If you select one of the options in the Volume filter dropdown, only blocks within the selected volume will be reported on in the report.
- If Entire block is selected, an entire block will be included in the report as long as the block centroid is within the volume being used as a filter.
- If Proportion of block is selected, only the proportion of a block that is within the selected volume will contribute to the report.
It is also possible to select None as a Volume filter so the reporting will not be restricted.
It is not advisable to use a stored proportion Additional weighting along with a Proportion of block volume filter. This is because the report would be calculating a proportion of a proportion. To make this calculation assumes these proportions can be simultaneously applied, which may not be the case, resulting in incorrect results. Note also that Entire block applied with a stored proportion weighting will result in slightly different results to an unweighted Proportion of block report.
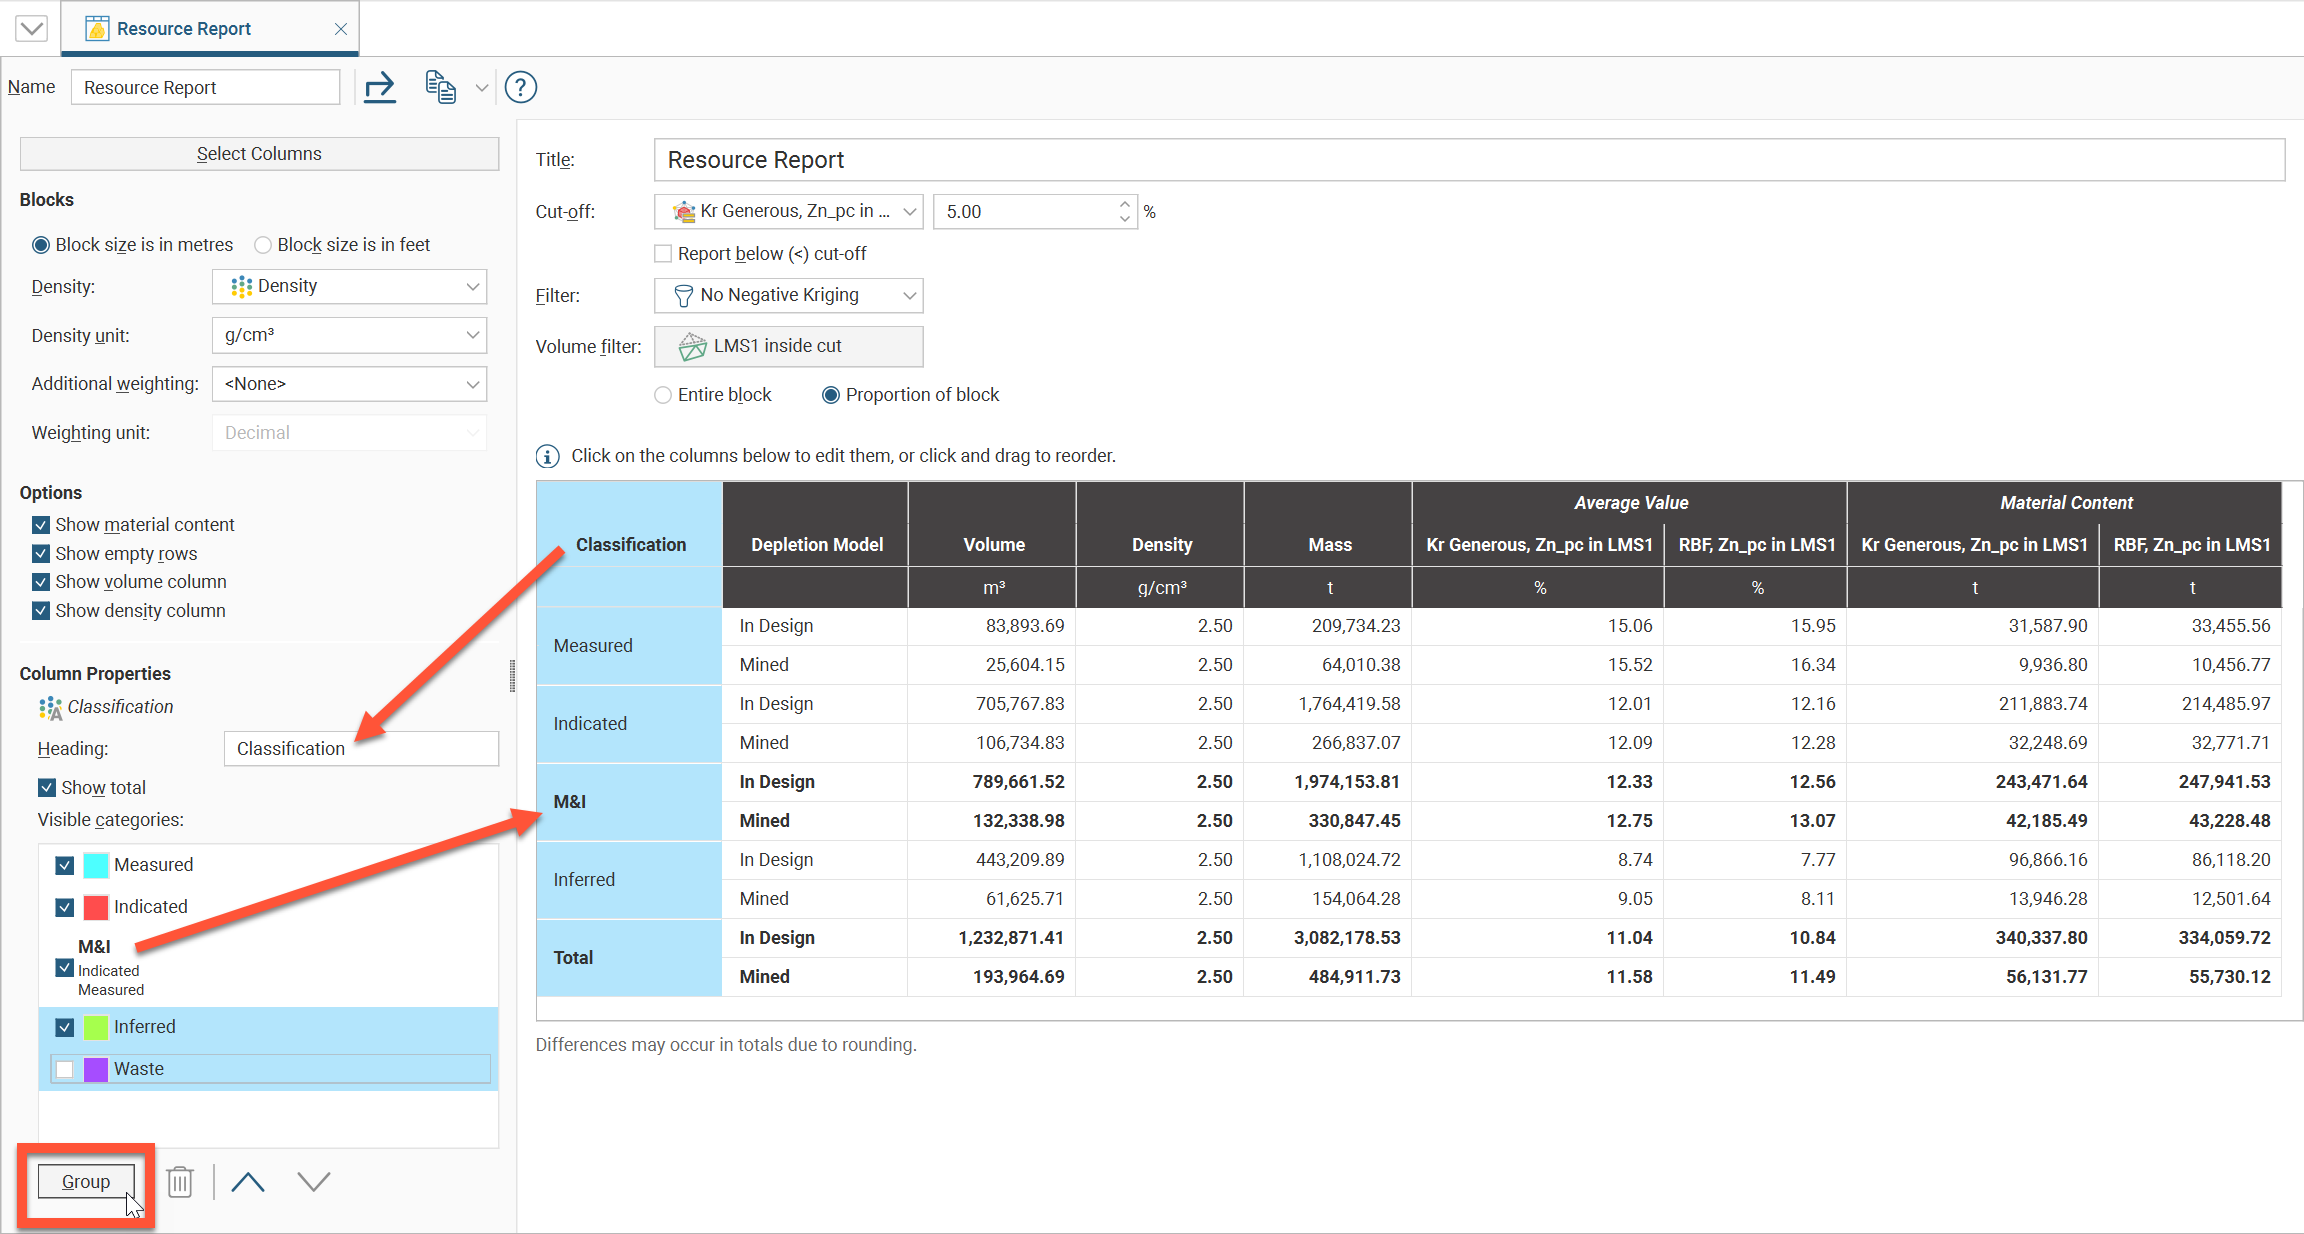
Click on a column to customise how the information is displayed. You can change the column title by editing the Heading field.
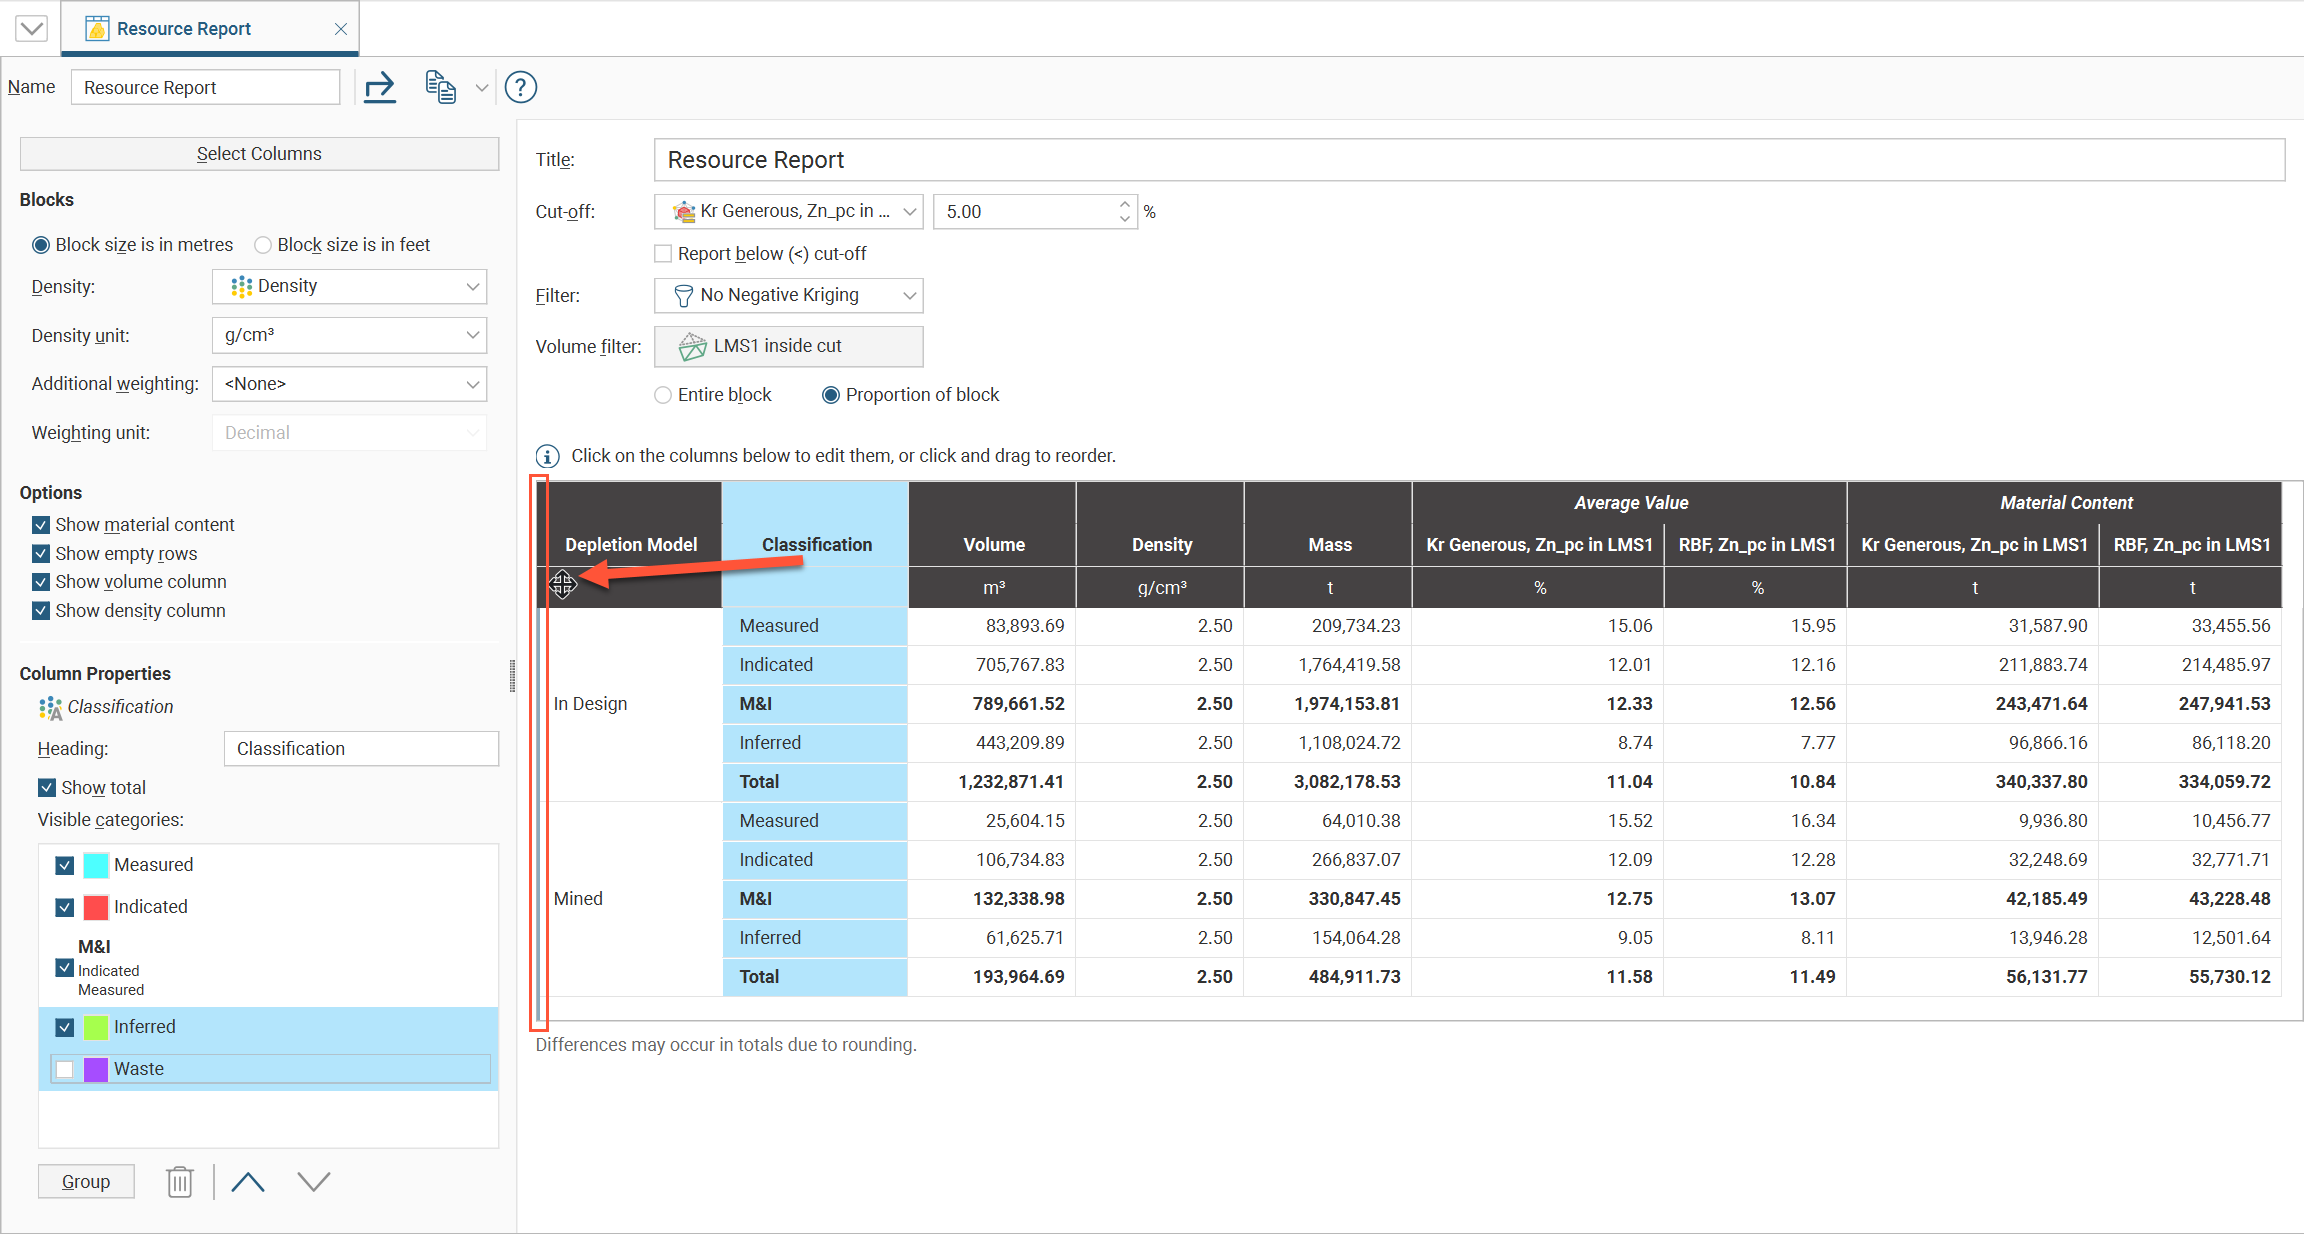
Enabling Show total will add a category row called Total with a summation for the categories. Any row that is a summation of categories will appear in bold in the table. It is possible to get a sub-total of some of the categories by grouping them, and these will also be shown in bold. To group categories, select multiple items in the Visible categories list by holding down the Ctrl key as you click the mouse. Click the Group button to add the new category.
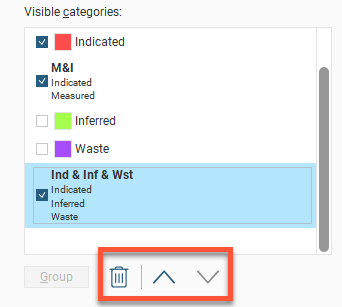
Note that some of the Visible categories can be unticked to hide them; these hidden categories can still be included in a grouped category:
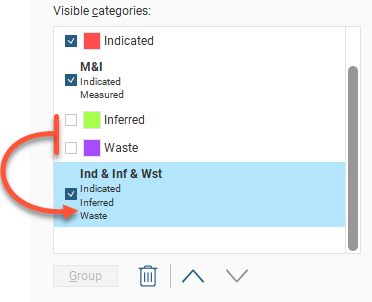
Select a category and click the up or down buttons to reorder them in the list. Delete a grouped category by selecting it and clicking the Delete button (![]() ).
).
If there are multiple category columns, these can be reordered to select one as the primary categorisation, with the others shown as sub-categories. Click anywhere in a category column and drag it to a new location. While you hold down the mouse button, a vertical bar will appear where the column will be inserted:
When Average Value columns are selected, it is possible to change:
- The Heading
- The Data unit
- The Display unit to use in the table, which may be the Same as data or some other unit to convert to
- The number of Decimal places to display in the table
Data unit has the options Unknown, Grams per tonne, Parts per million, Parts per billion, Percent, Troy ounces per short ton, Dollars per tonne, Dollars per short ton, Milligrams per kilogram, Micrograms per kilogram, Milligrams per gram and Micrograms per gram. The Data unit may be automatically set based on indicators in the selected column name, but must be checked for correctness. Make sure that the column data matches the Data unit selected. Note that "dollars" is used as a general term to refer to whichever currency you are using.
When Dollars per tonne or Dollars per short ton are selected as the Data unit, the Display unit option is not selectable, and must be Same as data.
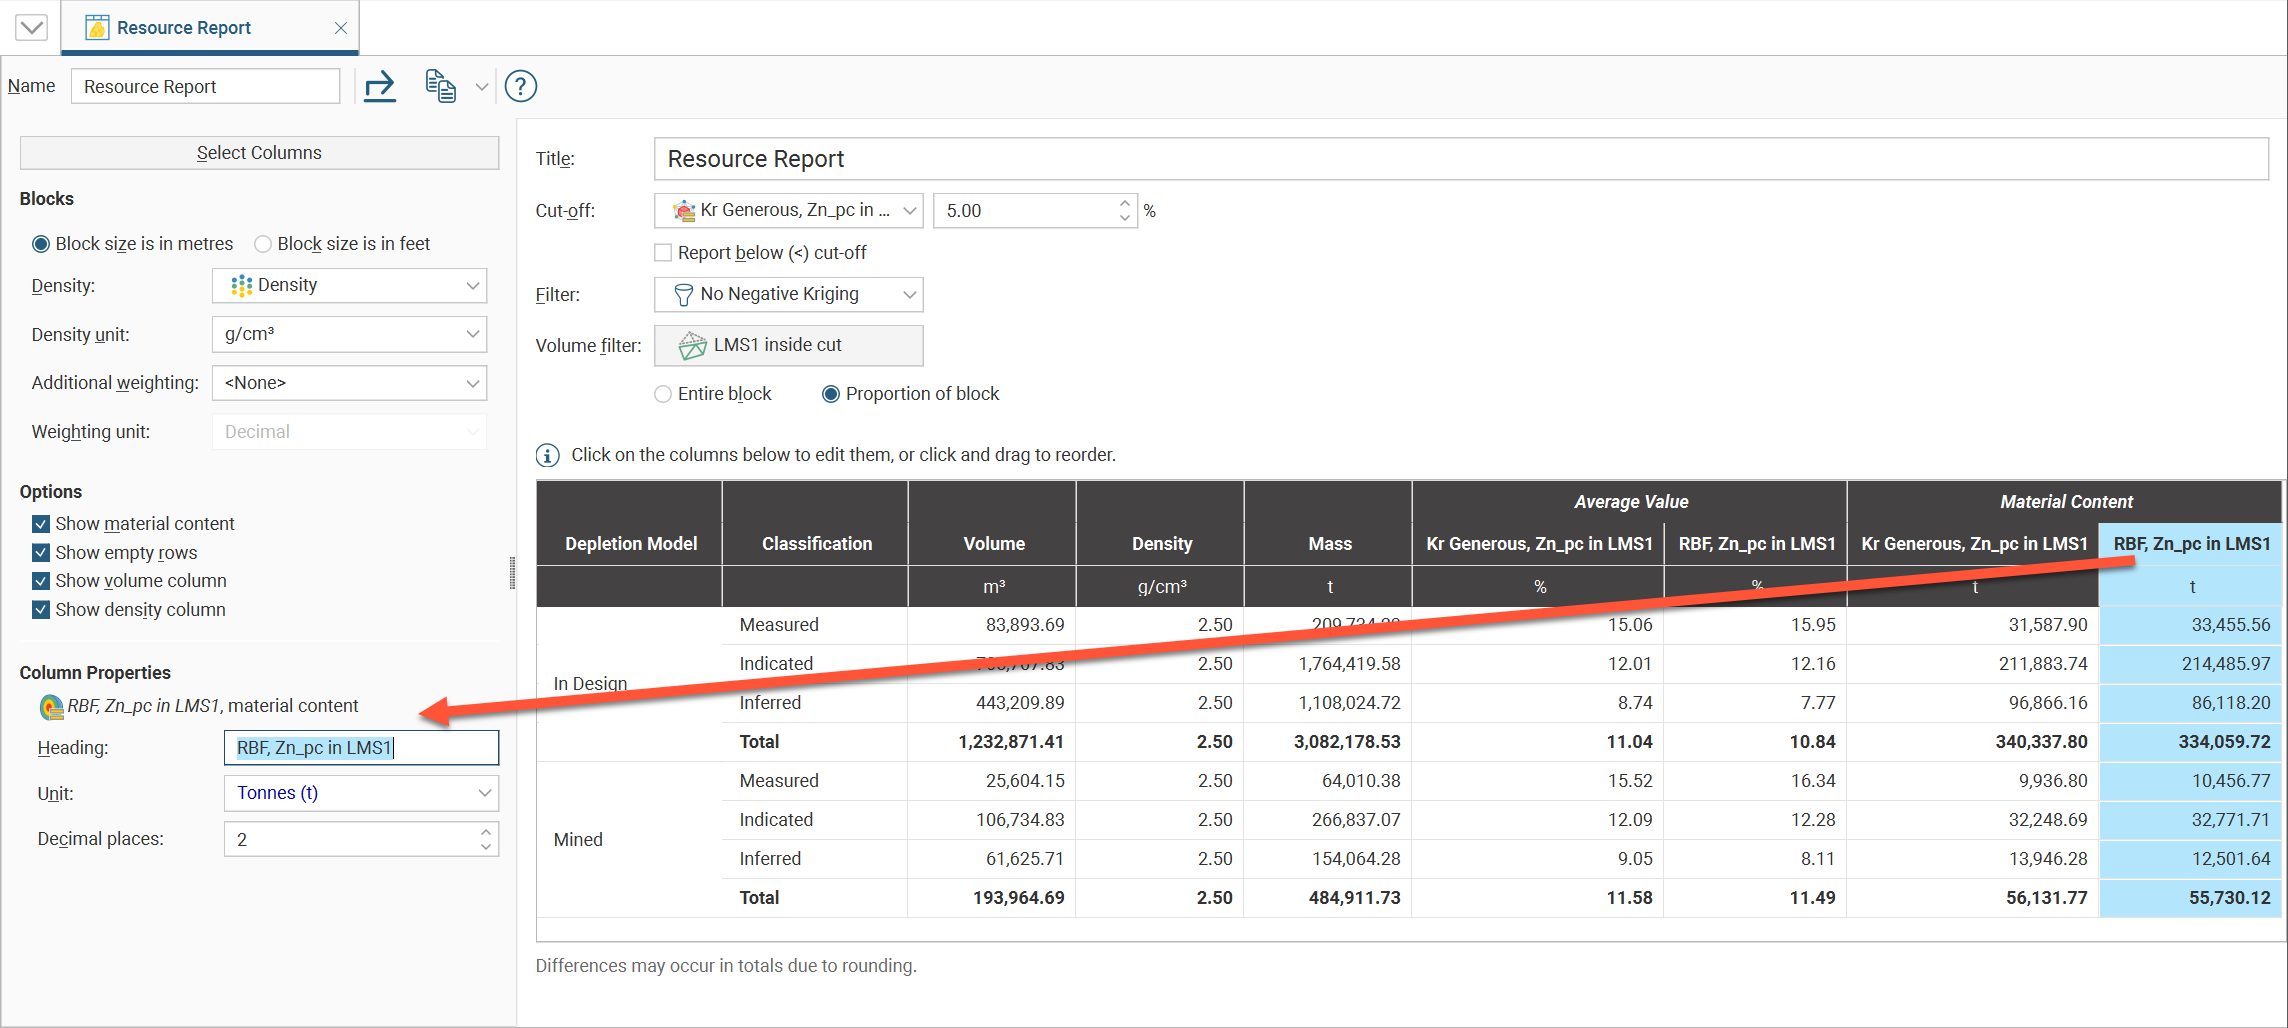
Material Content columns can have the Heading changed, as well as the column’s Unit and Decimal places.
The Report tab has Export and Copy options for making use of the resource report in external documents.
- Select Export to save the table as a Microsoft Excel spreadsheet, a CSV file, or an HTML file. Formatting is preserved in the spreadsheet and HTML file so the table will be arranged identically to the report in Leapfrog Geo. CSV files do not contain formatted data. If you select CSV, you will also be asked if you would like to use the Rounded numbers used in the table, or Full precision numbers. You can also select between ASCII characters only and Allow all characters, with UTF-8 encoding, as required by the software you are exporting to.
- If you select Copy, then Copy Table, the table is copied to the operating system clipboard, and you can paste it into another application such as Microsoft Excel or Microsoft Word. Formatting is preserved so the table will be arranged identically to the report in Leapfrog Geo and only the column and row sizes need to be adjusted to your preferences.
Reports you create appear in the Graphs and Tables section under the relevant block model. To delete a report, right-click the report and select Delete from the context menu.
In Leapfrog Geo 2023.1 there may be a small difference in the values in a report using proportion of block volume filtering compared to the values in reports from earlier versions. Leapfrog Geo 2023.1 introduced some improvements to how proportions are calculated and combined. Because computers do not store real numbers but convert them to binary, this can result in slight imprecisions when combining volume proportions that should add up to a whole 1. With the improvements introduced in Leapfrog Geo 2023.1 that ameliorate this effect, there can be a slight change at about the fifth or sixth significant figure in reports making use of the proportion of block volume filter.
Proportions of Proportions Not Advised
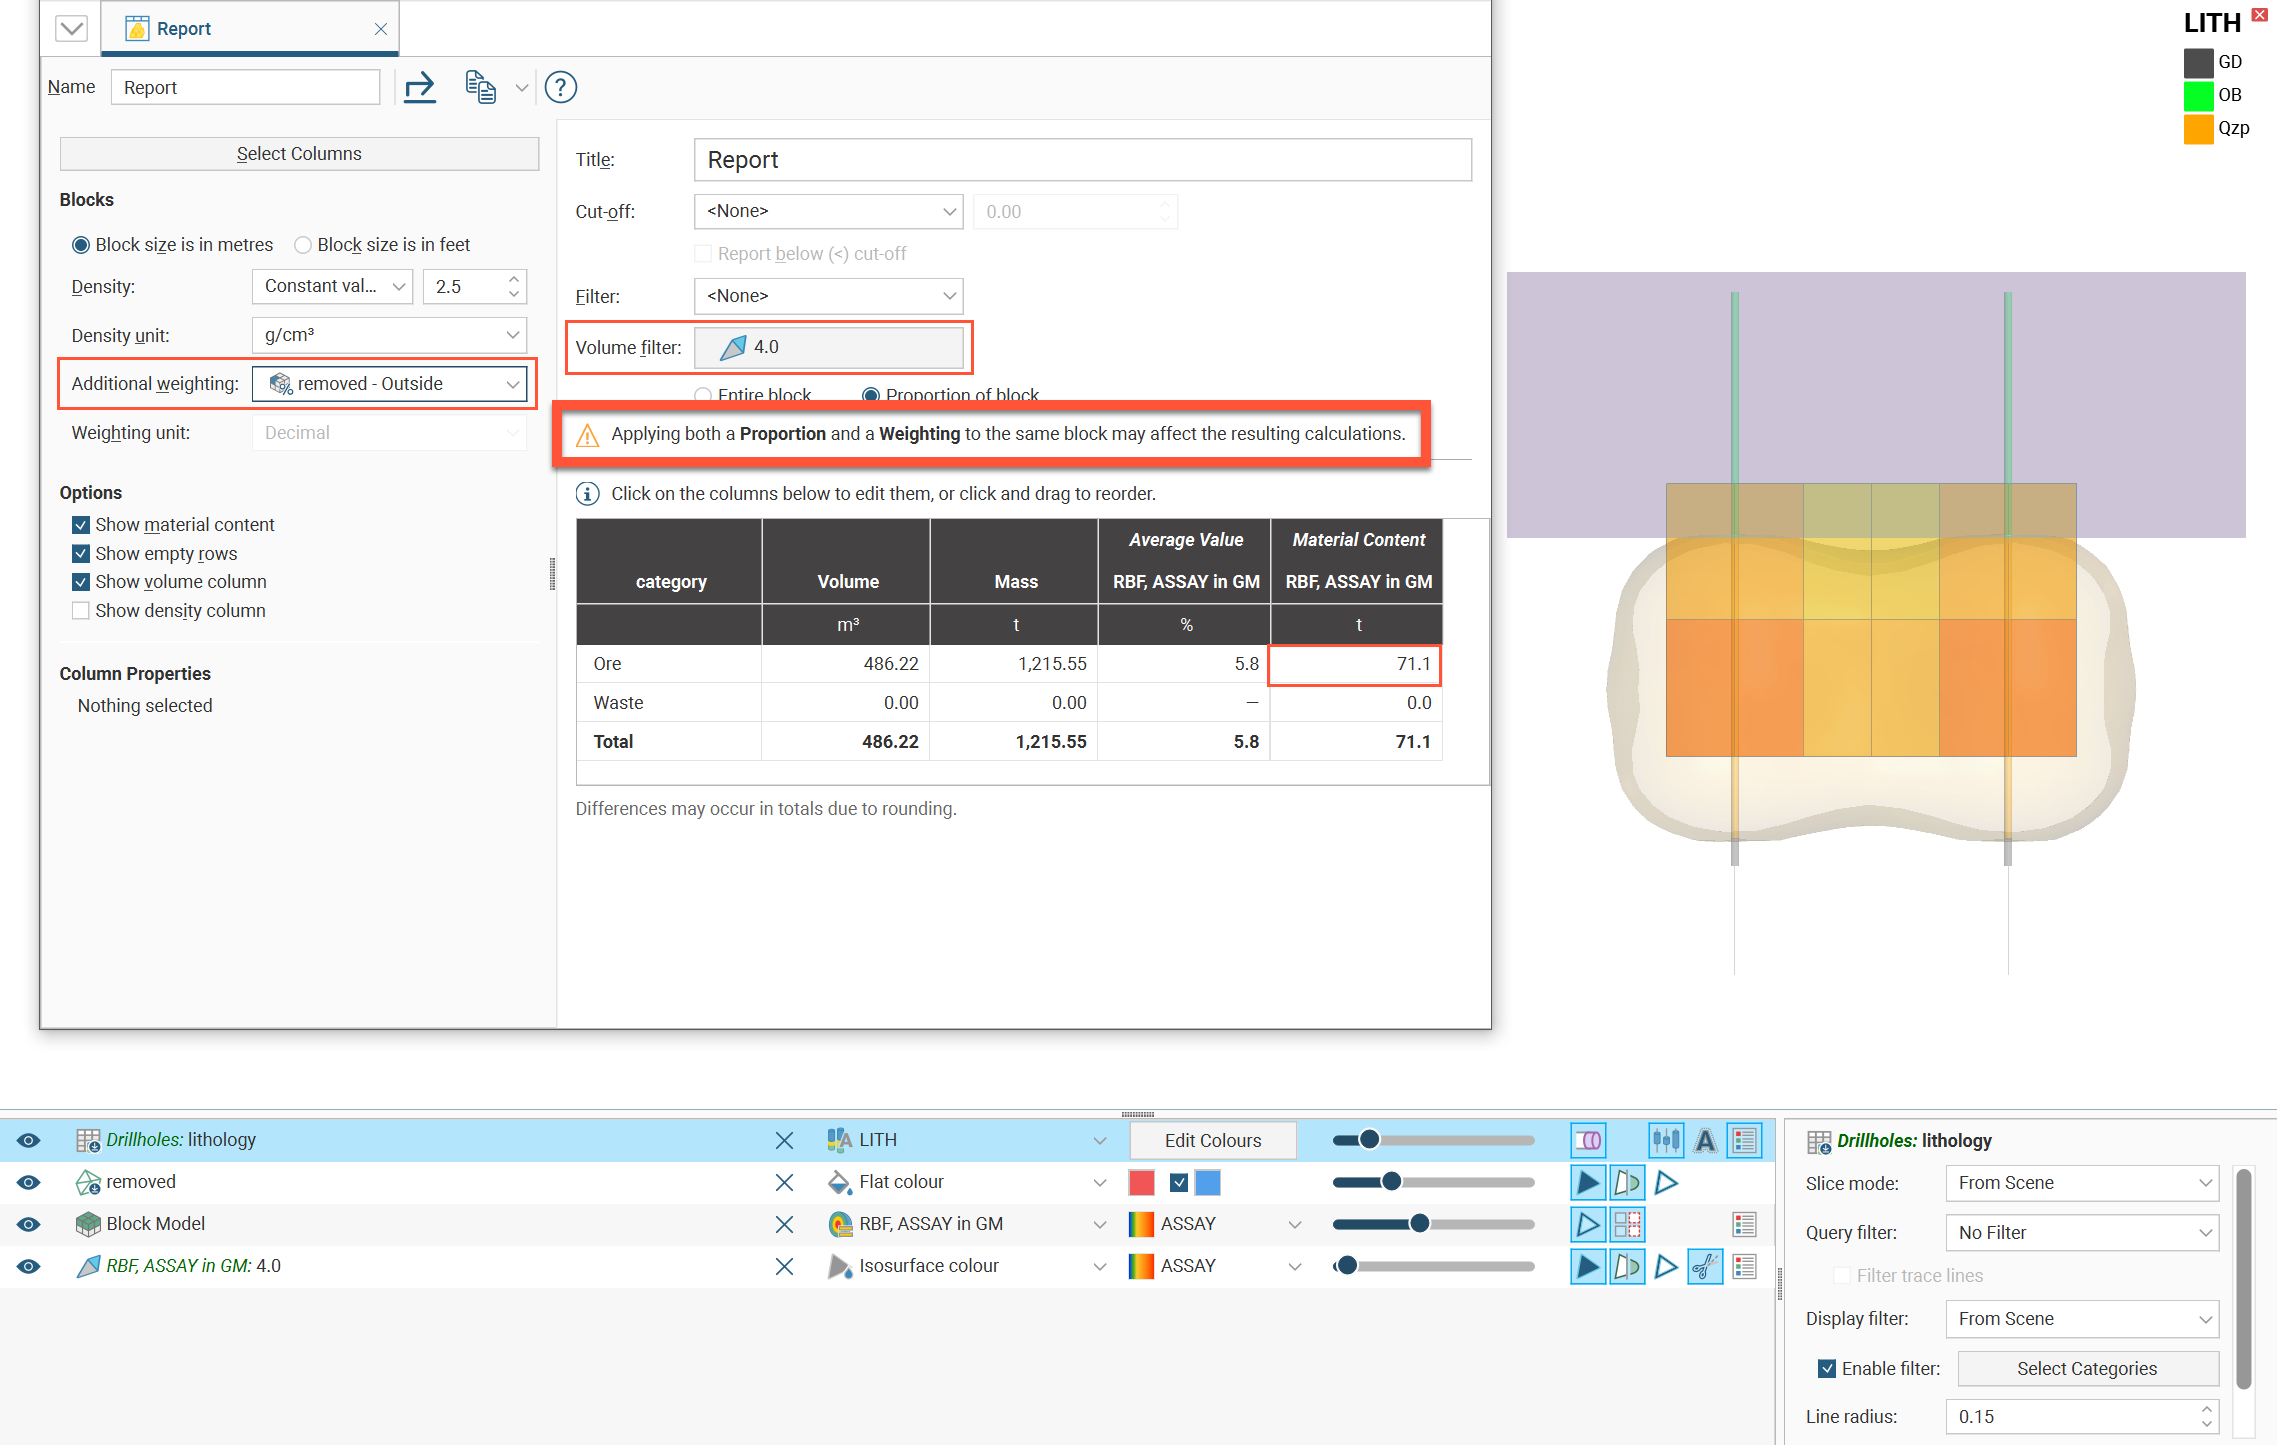
When Additional weighting is set to something other than <None> while Volume filter is set to Proportion of block, Leapfrog Geo shows a warning: Applying both a Proportion and a Weighting to the same block may affect the resulting calculations. This standard caution is displayed to make sure the combination being selected makes sense.
Often, it is not advisable to use a stored proportion Additional weighting along with a Volume filter. This is because the report would be calculating a proportion of a proportion. To make this calculation assumes these proportions can be simultaneously applied, which may not be the case, resulting in incorrect results. If the Additional weighting selected is not a volumetric proportion, there should be no conflict with a Proportion of block.
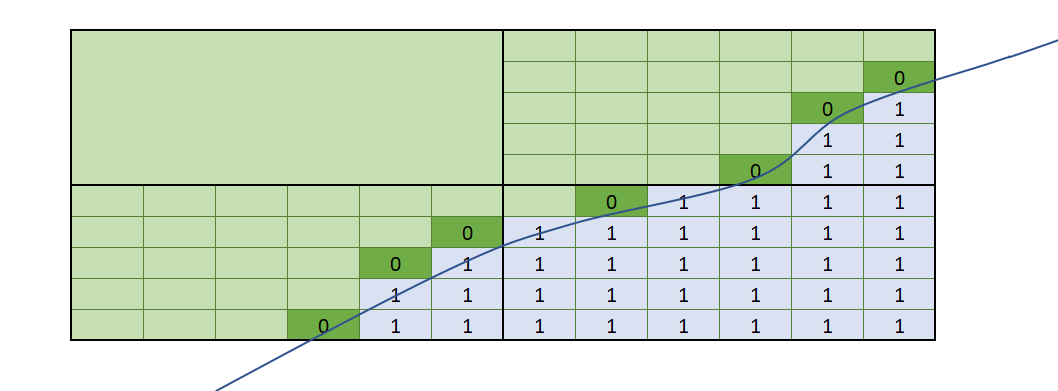
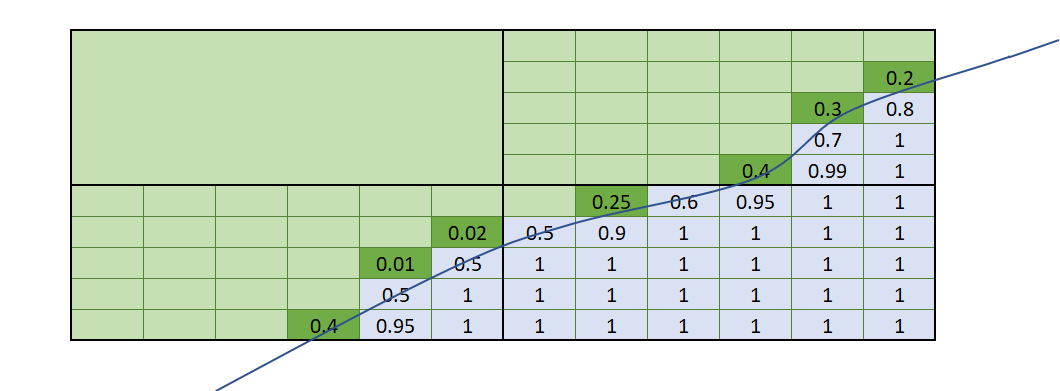
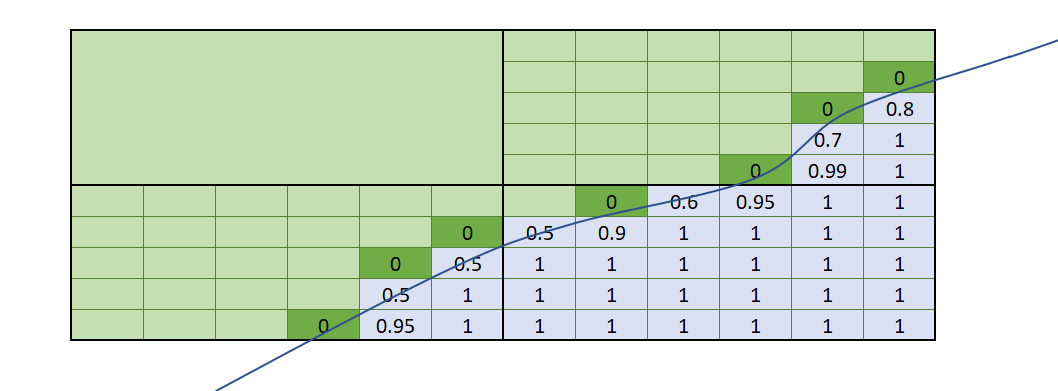
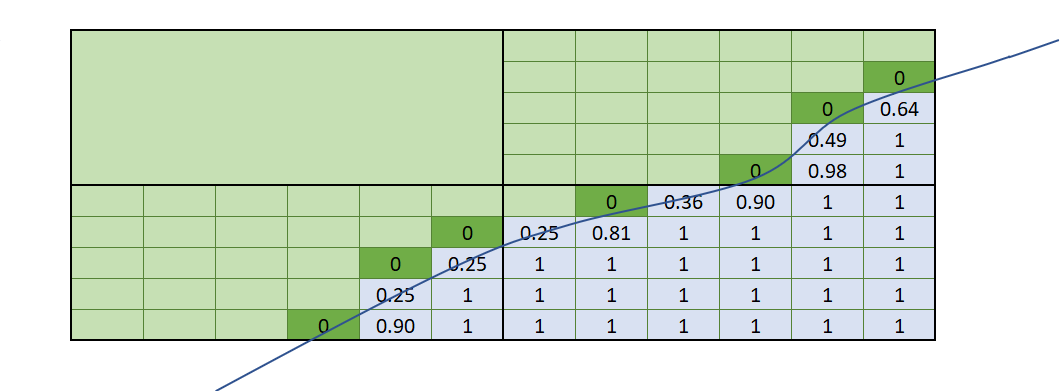
This matrix shows the results of the combinations of the volume filter’s Entire block and Proportion of block options against Additional weighting being selected as none or the volume of interest. The line crossing through the boxes shows part of a closed mesh volume. Blocks shaded grey have their block centroids within the mesh volume. Note that even though the same volume of interest is used in all cases, when both Proportion of block and Additional weighting are applied at the same time, the values in the blocks are undervalued because the proportion has been applied twice.
| Entire block (where centroid is inside mesh volume) | Proportion of block inside volume filter determined by mesh | |
| Additional weighting = <None> |
|
|
| Additional weighting of proportion inside mesh |
|
|
Note that the combinations:
- Additional weighting = <None> plus Proportion of block volume filter
- Additional weighting = proportion of block inside volume plus Entire block volume filter
do not result in precisely matching data. Take note of the dark green boxes that depict blocks with the block centroids outside the volume of interest. The Entire block volume filter selects only blocks that have the block centroid within the volume, so these dark green blocks get 0 values. When Proportion of block is used, even though the block centroid is outside the volume, the amount of the block within the volume is assigned as a value. Each approach is valid, and which you choose depends on the result you want to achieve.
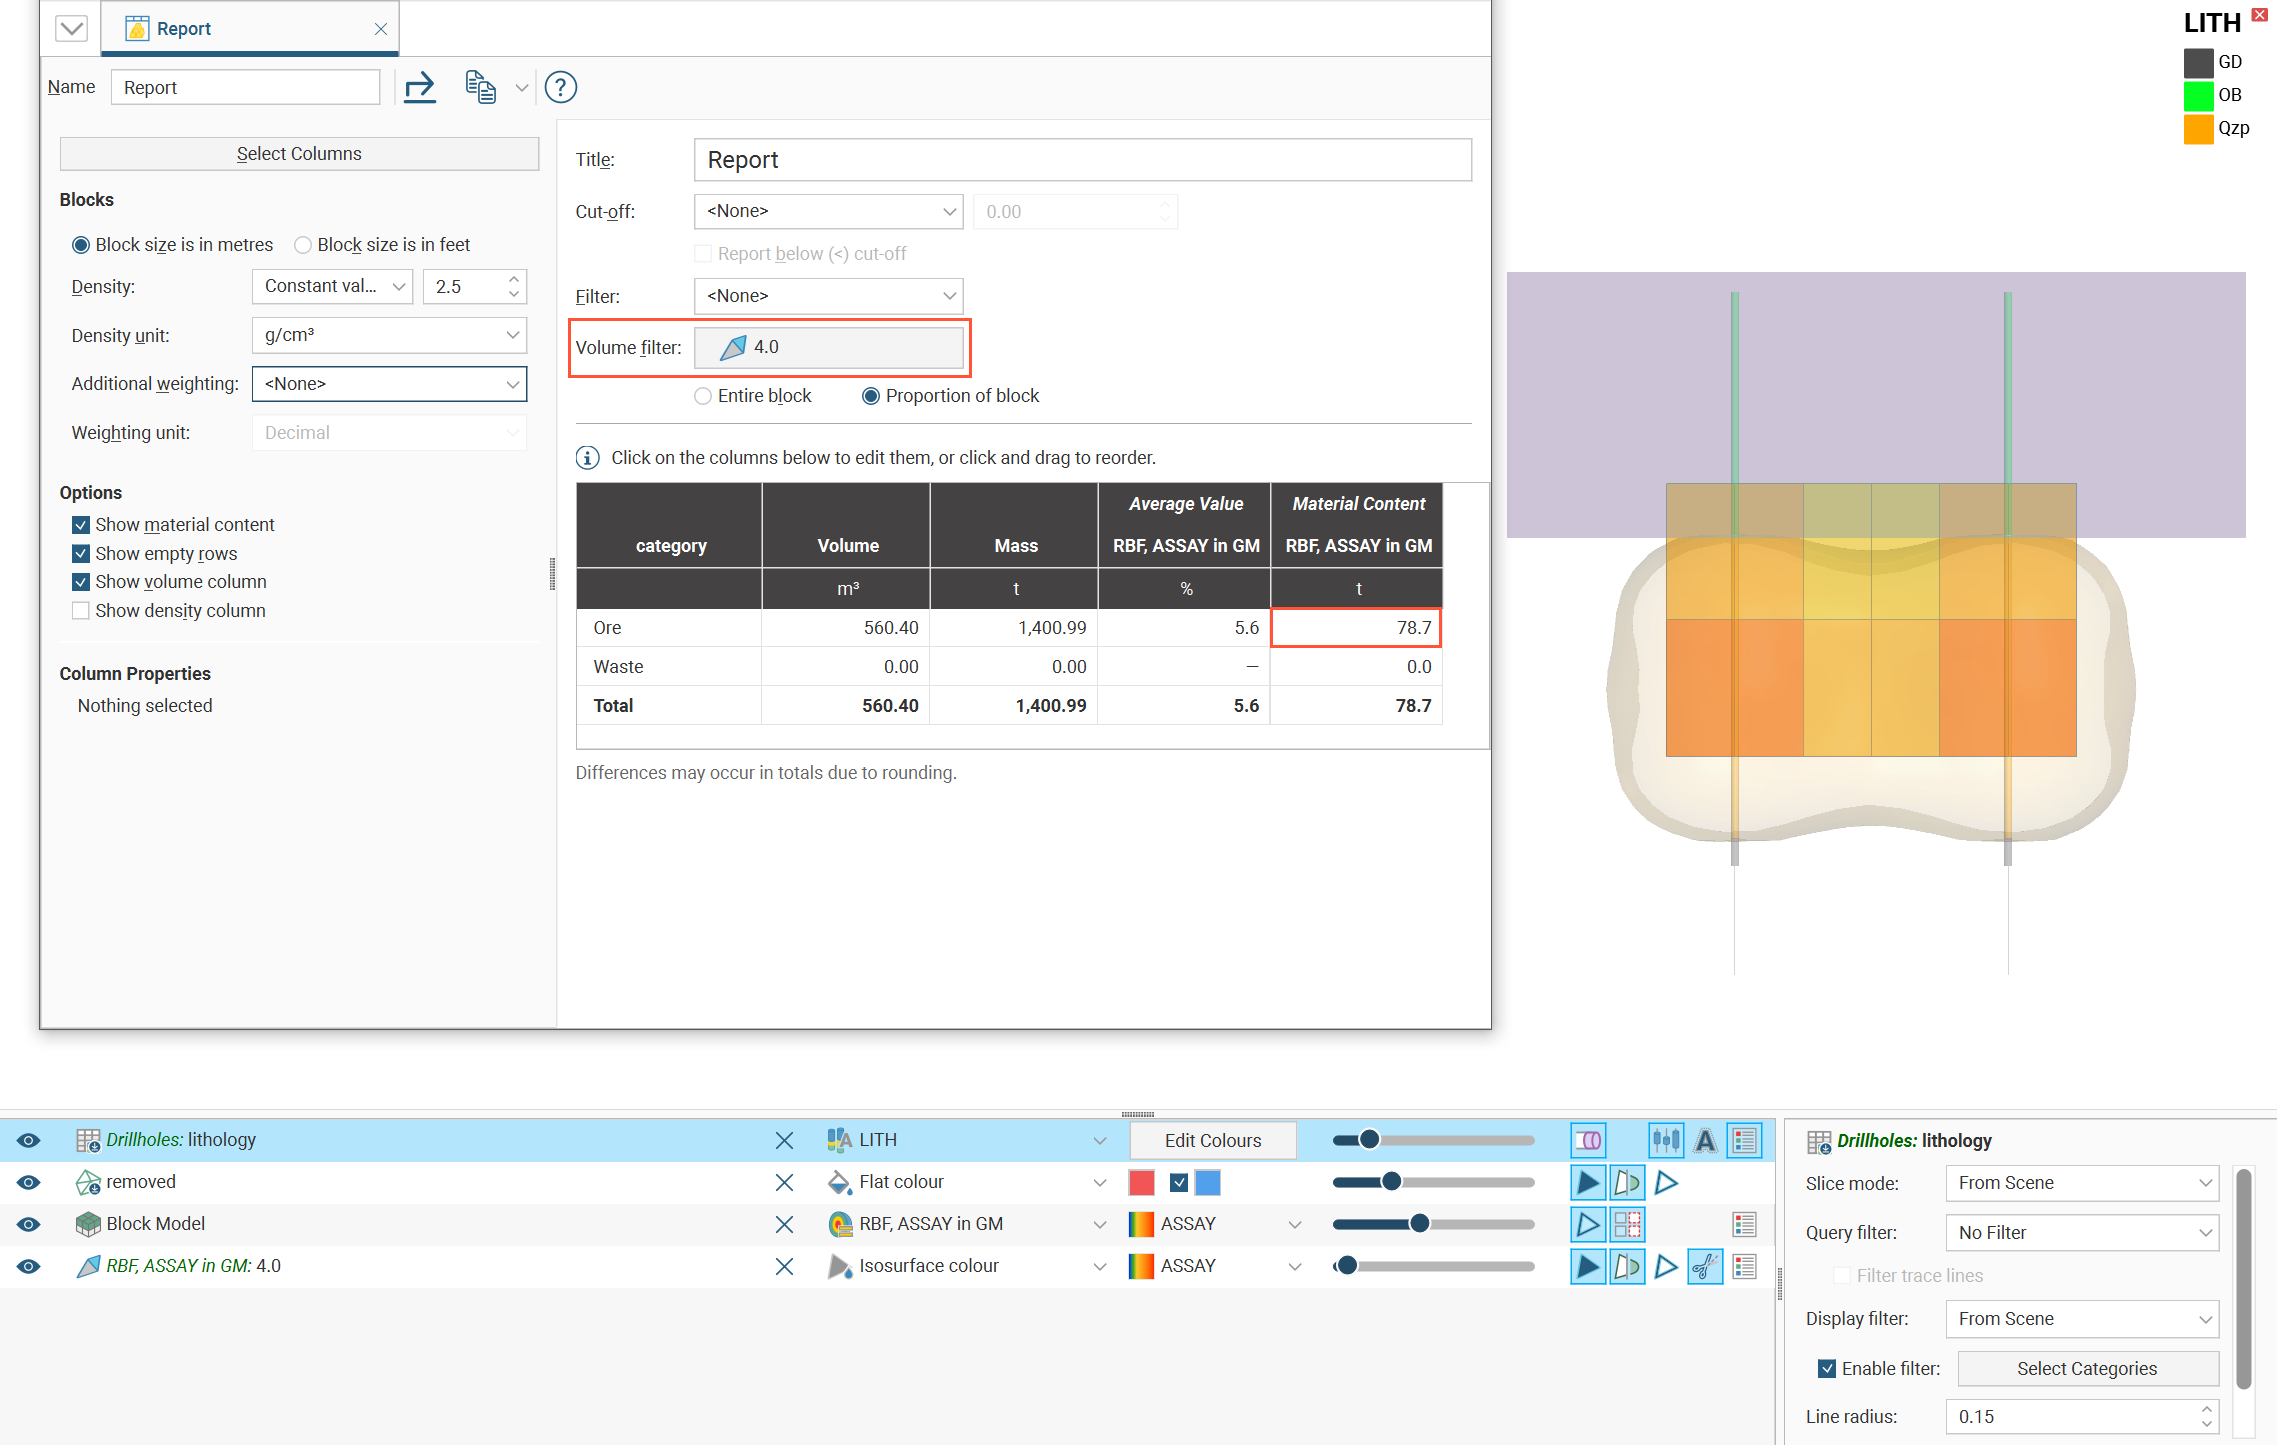
The effect of proportions-of-proportions undervaluing estimates is further illustrated using this simplified example. The geological model comprises three layers, with the middle layer being a rich ore-bearing layer topped with an overburden of waste rock. An isosurface shell has been created using the limited drilling data identifying a region of rich ore, and a simple block model has been created between the drillholes.
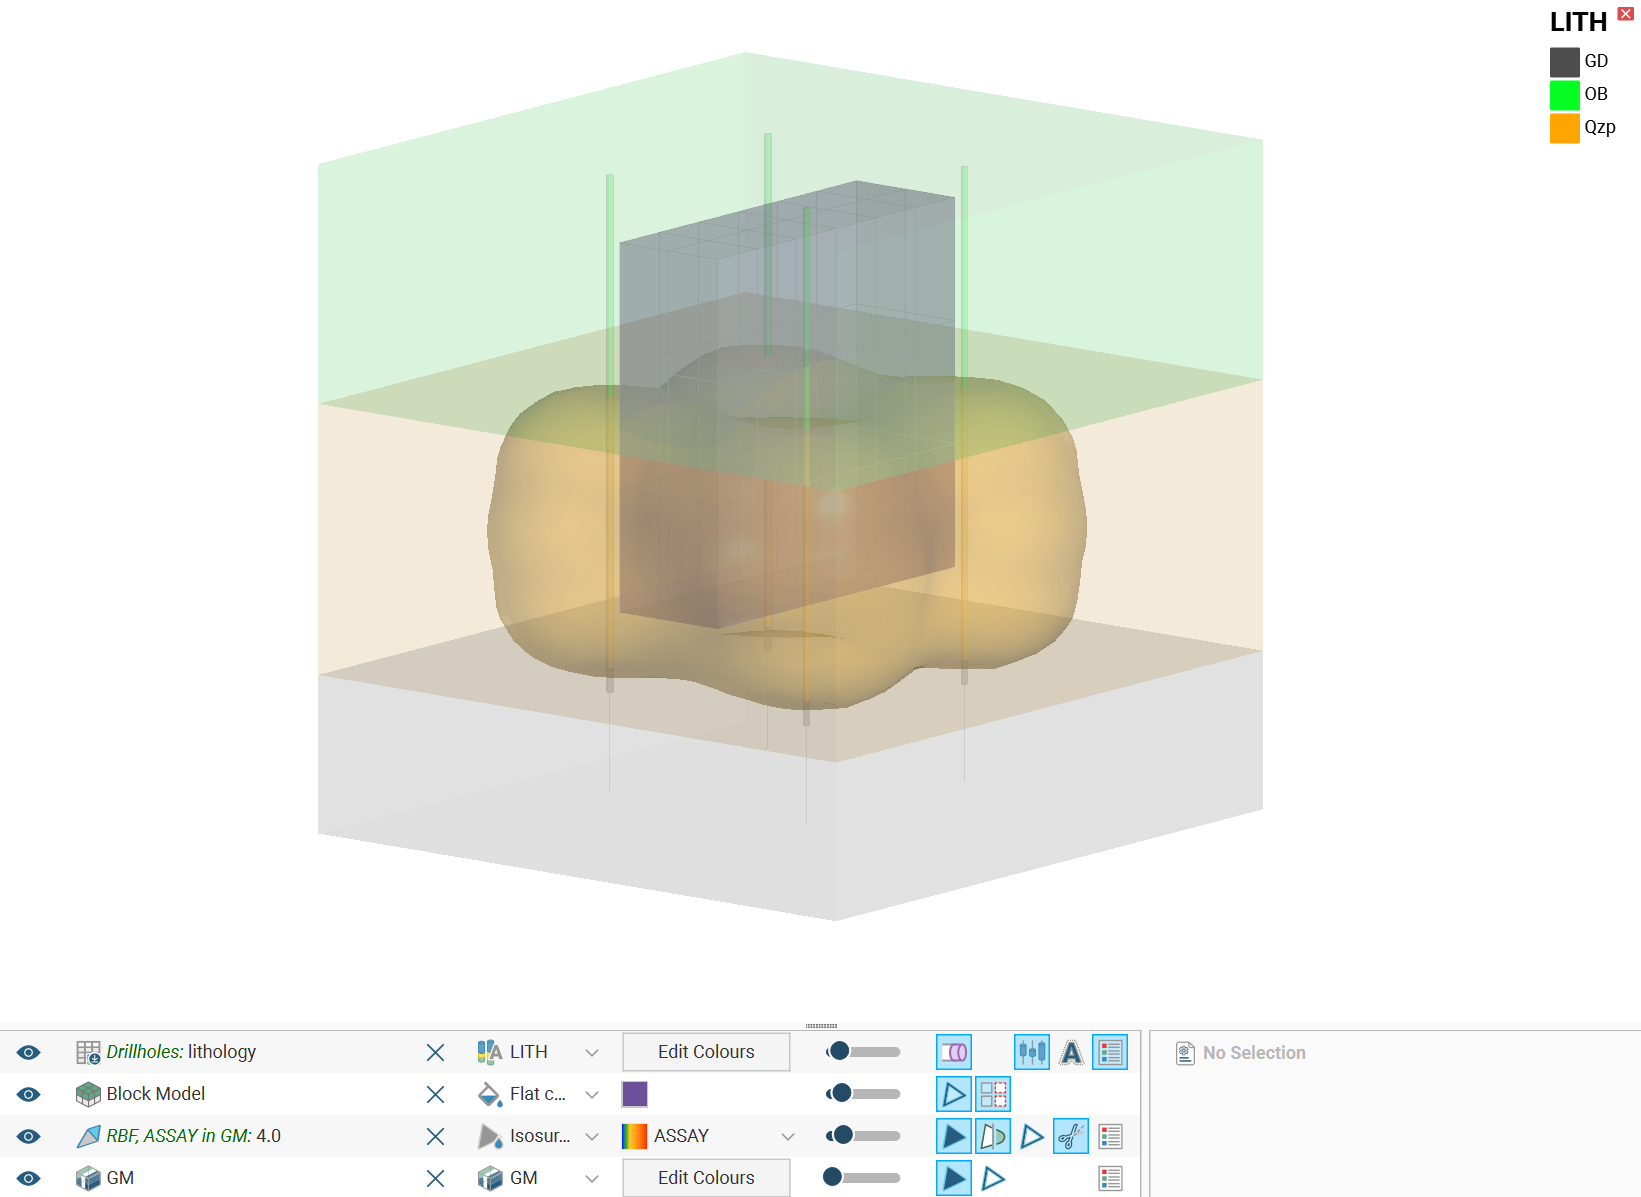
A resource report using the mesh shell as a volume filter calculates 78.7t of material in the blocks.
Another mesh called “removed” models the removed overburden that was all waste rock with no ore. It has been used to create a stored proportion column for the block model, indicating the percentage of each block outside the “removed” region. If this proportion is used as an additional weighting for the resource report along with a volume filter, two independent volume-weighted proportions are being applied, resulting in an inaccurate result. We would intuitively expect that because the removed rock is all waste overburden, that the reported material content should not be substantially different, but because each block has been scaled by the value calculated in the proportion column, the material content is now reported as 71.1t.
Block Model Query Filter Using Report
When you have a report open, you can use the category selections and other filters in the report to filter blocks in the scene.
Detach the dockable report tab and position the window so you can see both the report and the scene. With a block model selected in the shape list, the shape properties panel has a Query filter selector. The name of the report should appear in this dropdown list. When the report is selected, the blocks shown in the scene will only be the blocks the report is reporting based on the Visible categories selected, the Cut-off specified, that satisfies the Filter used by the report (if any), and is within any selected Volume filter.
Got a question? Visit the Seequent forums or Seequent support
© 2023 Seequent, The Bentley Subsurface Company