
Estimation Parameters Report
The features described in this topic are only available if you have the Leapfrog Edge extension.
The Estimation Parameters Report provides a tabulated overview of estimation configuration settings. This can be used to easily check consistency of settings across domained estimations where required. It can also can be used as a shortcut to adjust settings and is especially useful for making bulk changes.
To view the Estimation Parameters Report, right-click on the Estimation folder or on a combined estimator and select Parameter Report.
Estimation parameters reports with many estimations may take time to open.
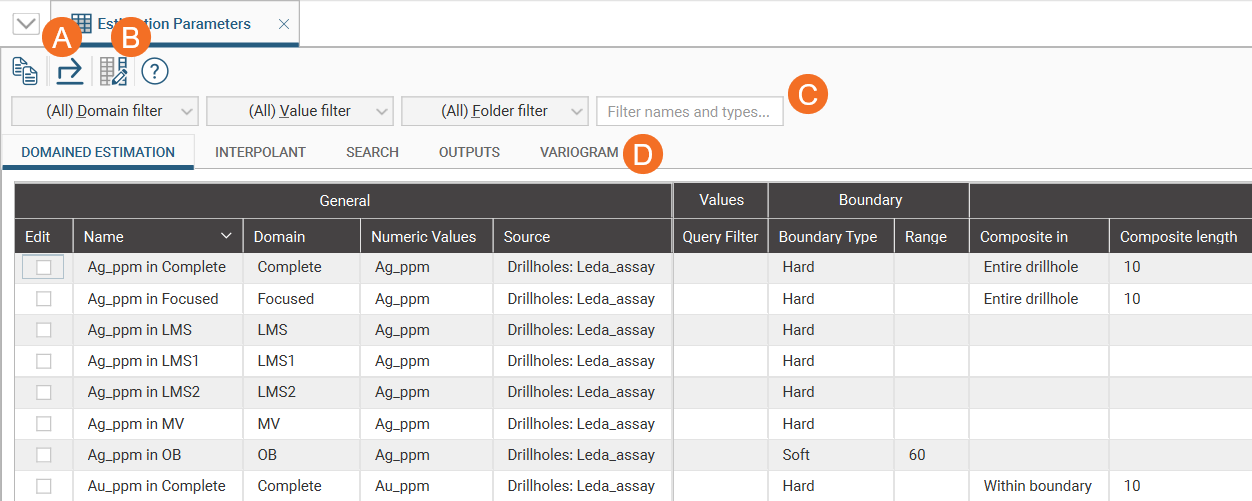
- The Export button (A) provides an Excel file of all the parameters. See Exporting Parameters below.
- Use the Edit table columnsbutton (B) to select which columns are displayed in the estimation parameters report table. See Selecting Columns below.
- The filters (C) enable a variety of options for filtering the table to show only rows of interest. See Filtering Options below.
- Five tabs (D) organise the estimation parameters into related parameter sets: Domained Estimation, Interpolant, Search, Outputs and Variogram.
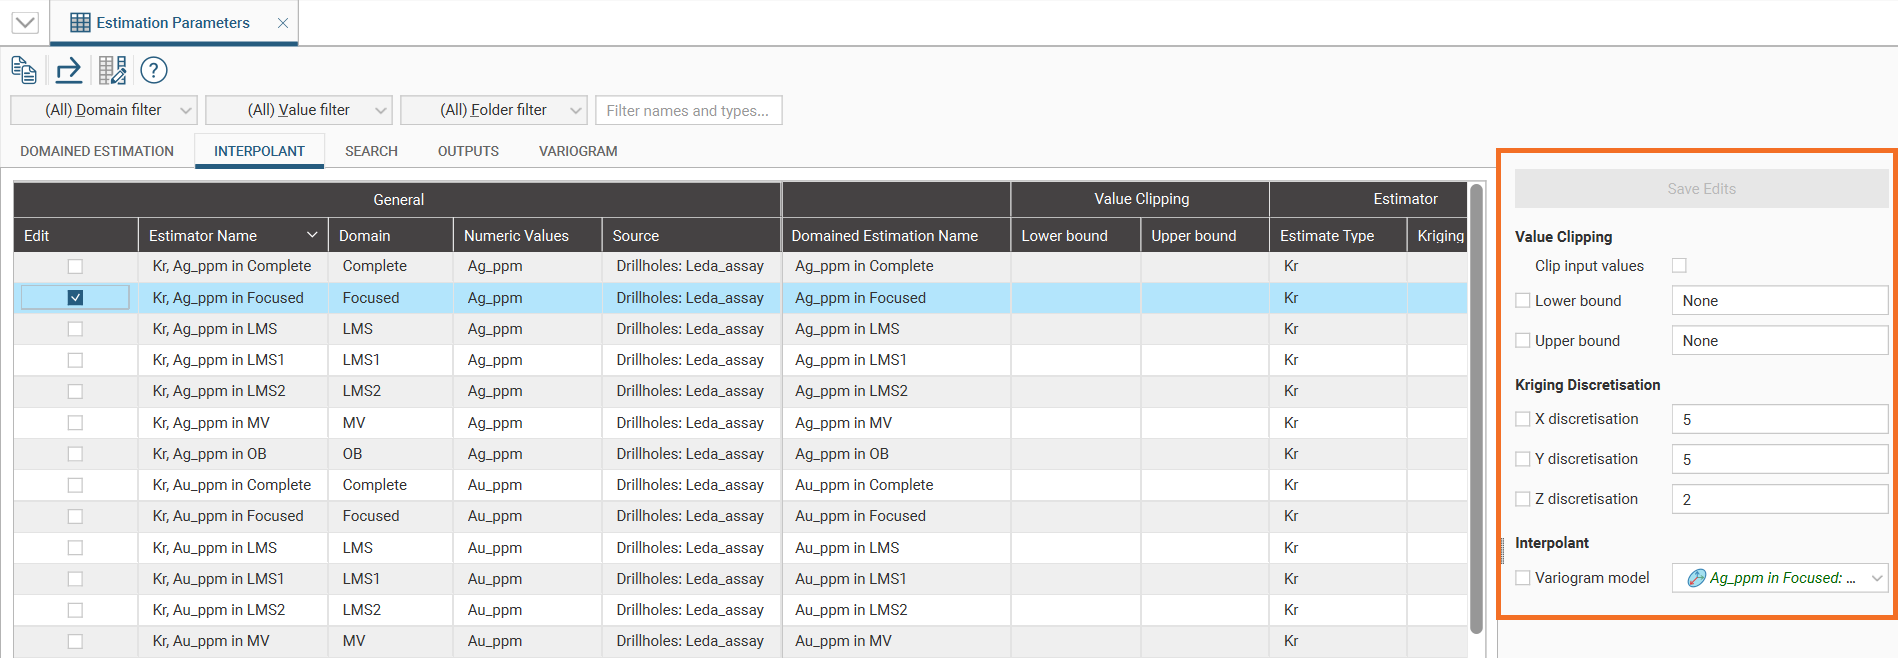
When one or more rows in the table are selected, a quick edit panel appears beside the table. For more information on using the quick edit panel, see Modifying Parameters below.
The rest of this topic describes how to work with the information in the report. It is divided into:
Selecting Columns
By default, the Parameters Report is shown with all available columns. To make it easier to work with the table, especially on smaller screens such as laptops, you can choose to hide columns that are currently not of interest. Click the Edit table columns button (![]() ) and select or de-select columns to choose the ones displayed in the table.
) and select or de-select columns to choose the ones displayed in the table.
Filtering Options
There are four filtering options for the table: by domain, by value, by a subfolder in the project tree Estimation folder and using a string-matching filter.
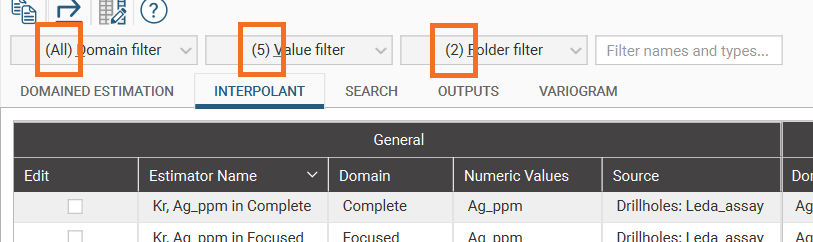
The first three have drop-down lists with selectable options. When all options are selected, (All) will appear next to the filter name. When all options are de-selected, (None) will appear next to the filter name. If only some of the options are selected, the number of selected options will appear next to the filter name. This provides a quick visual indicator so you can see if filters are currently applied to the table.
When a dropdown list filter is selected, the available options are shown grouped so identical variable names can be distinguished by their parents.
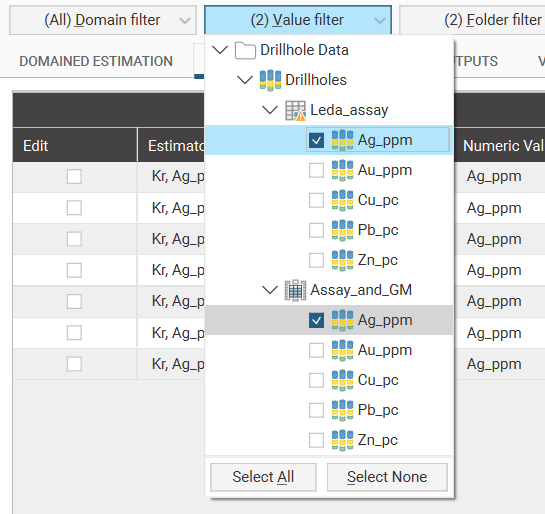
Note also that there are Select All and Select None buttons at the bottom of the dropdown list. These are handy to expedite the selection of most or just a few options.
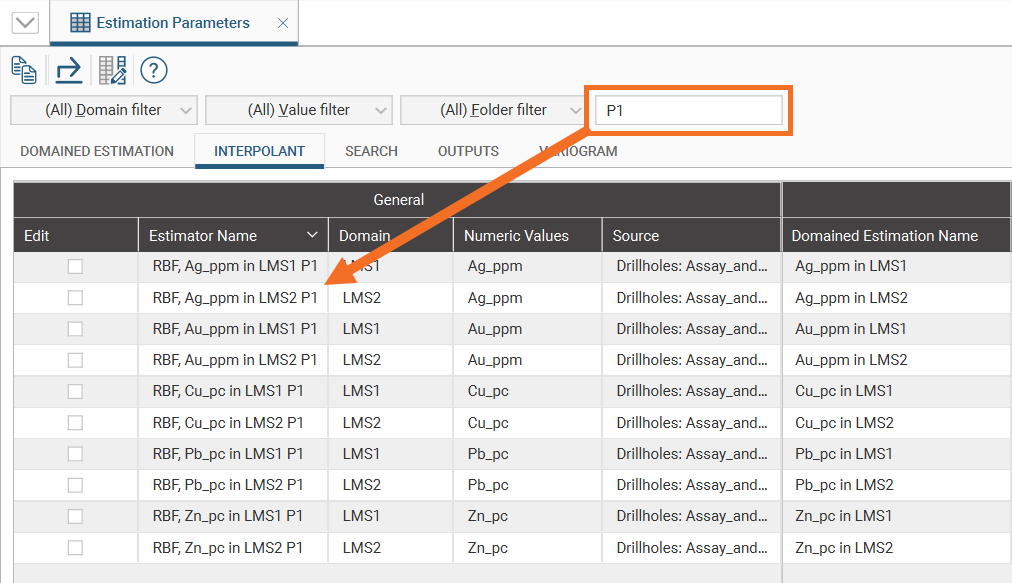
The string-matching filter searches for the character sequence you enter in the names and types columns. If you are using consistent naming conventions, these can be used to further reduce the table to your rows of interest. For example, if you are using “P1” to indicate a first pass estimation, searching for “P1” will show all your first pass estimation rows.
Several filters can be used at the same time to further refine your search.
Opening a parameter report from a combined estimator will open the report with pre-populated filters suited to the combined estimator.
Sorting Parameters
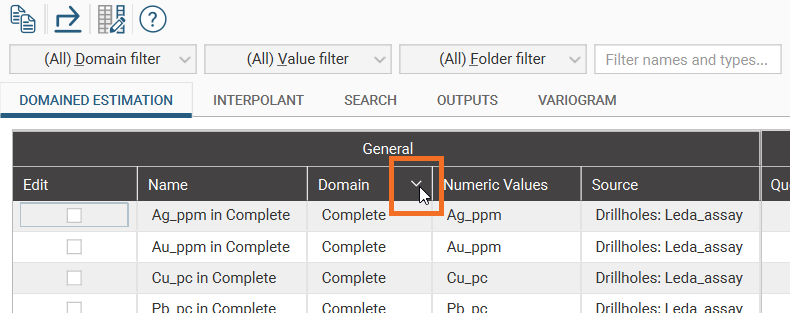
Click any of the column headers to sort the current table by that column. The column that is being used as the sort column is marked with a chevron that also indicates the sort order. Clicking this chevron will invert the sort order. If the chevron looks like a caret (^), the current sort order is descending, and clicking the chevron will change the order to ascending. If the chevron looks like a v, the current sort order is ascending, and a click will change it to descending.
Modifying Parameters
The Parameters Report makes it easy to modify values.
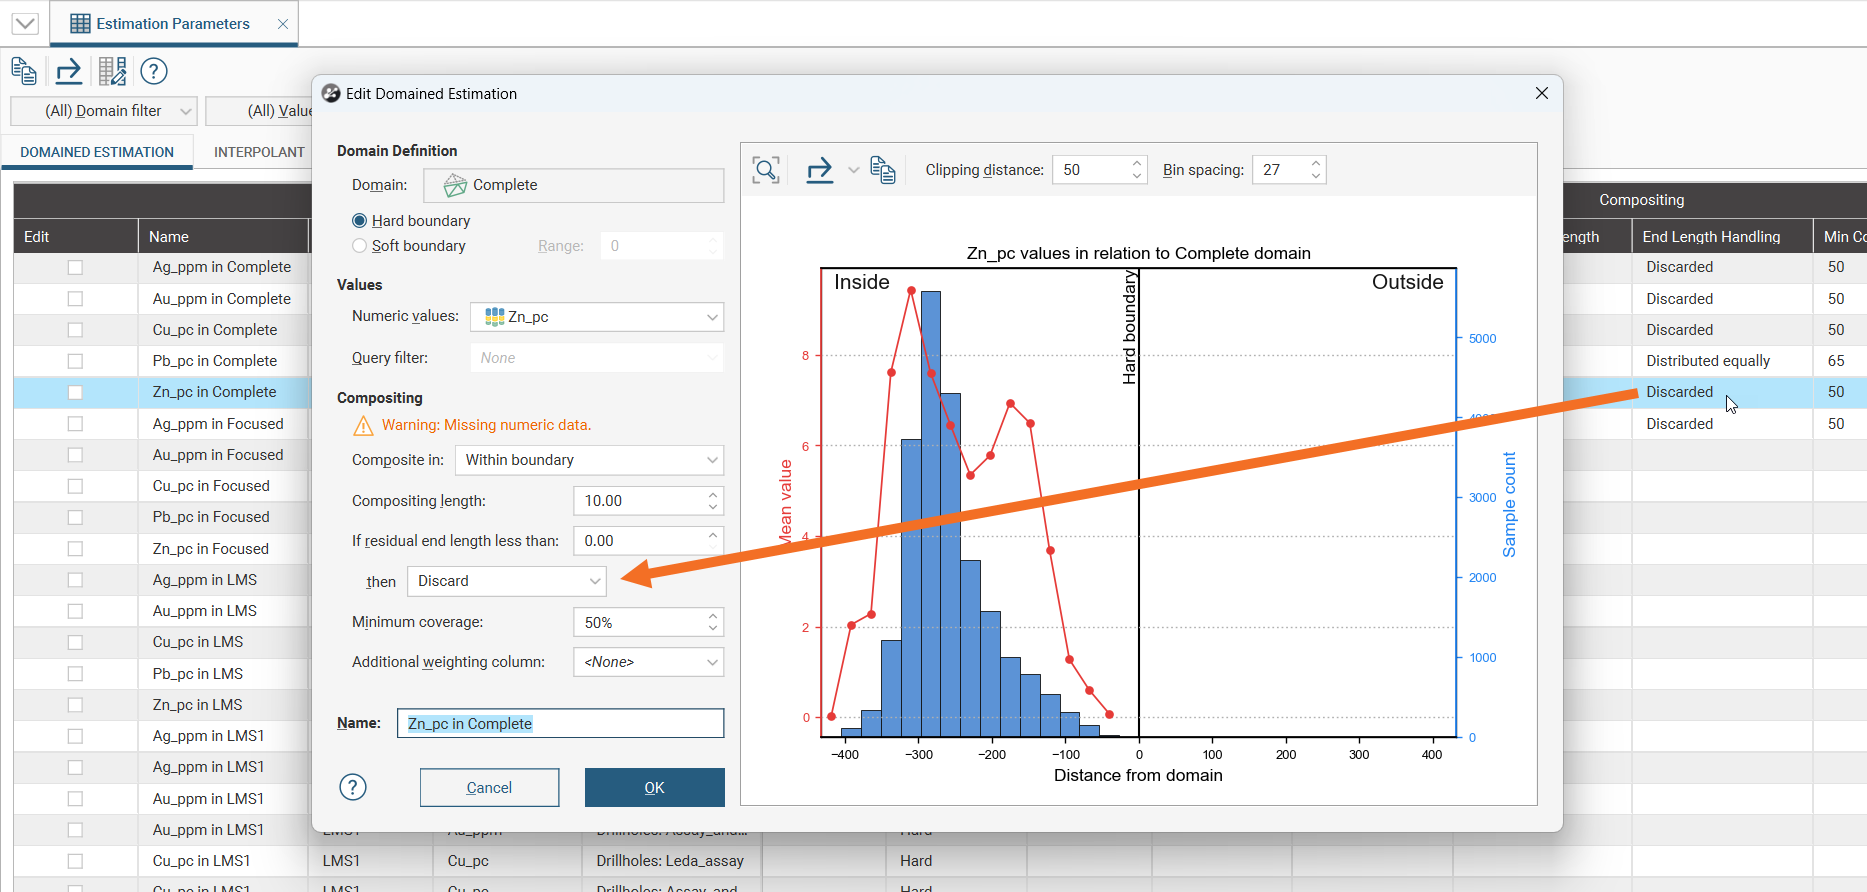
To change a specific value, double-click on any cell in the table and the associated window will open.
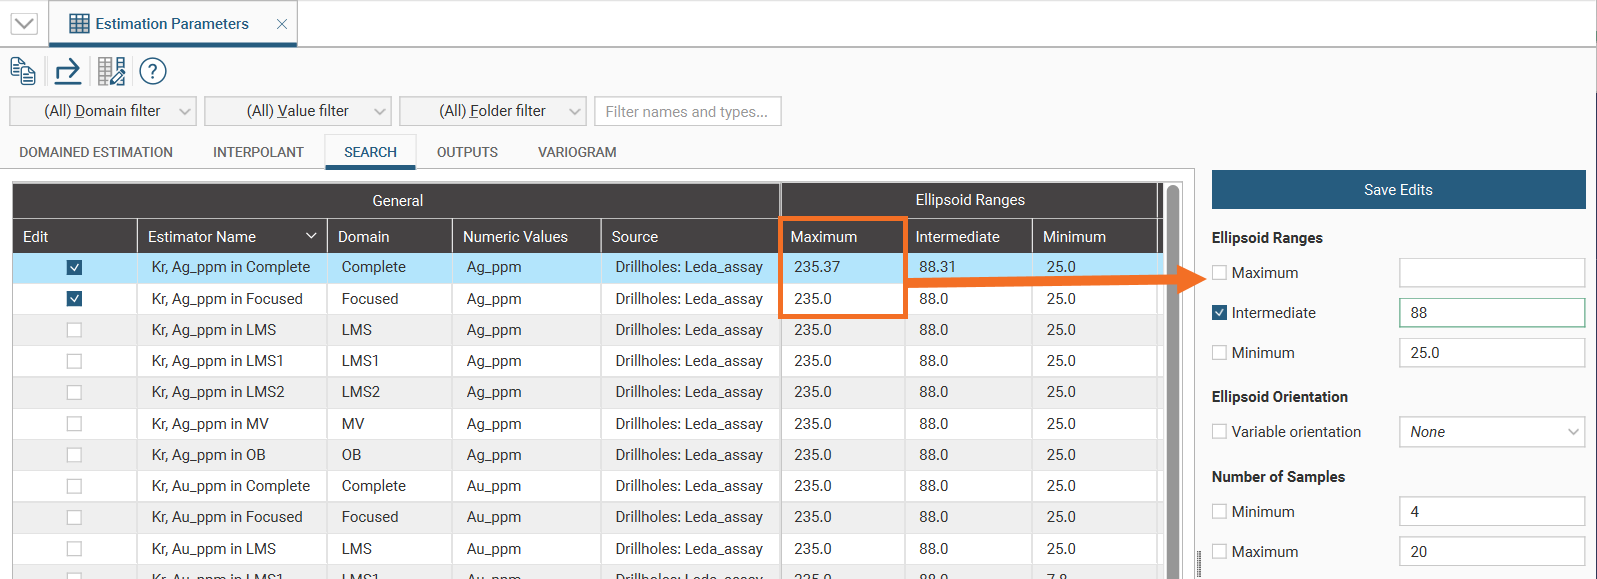
Tick the Edit box for a row; a quick edit panel will open that contains all the editable fields for that row.
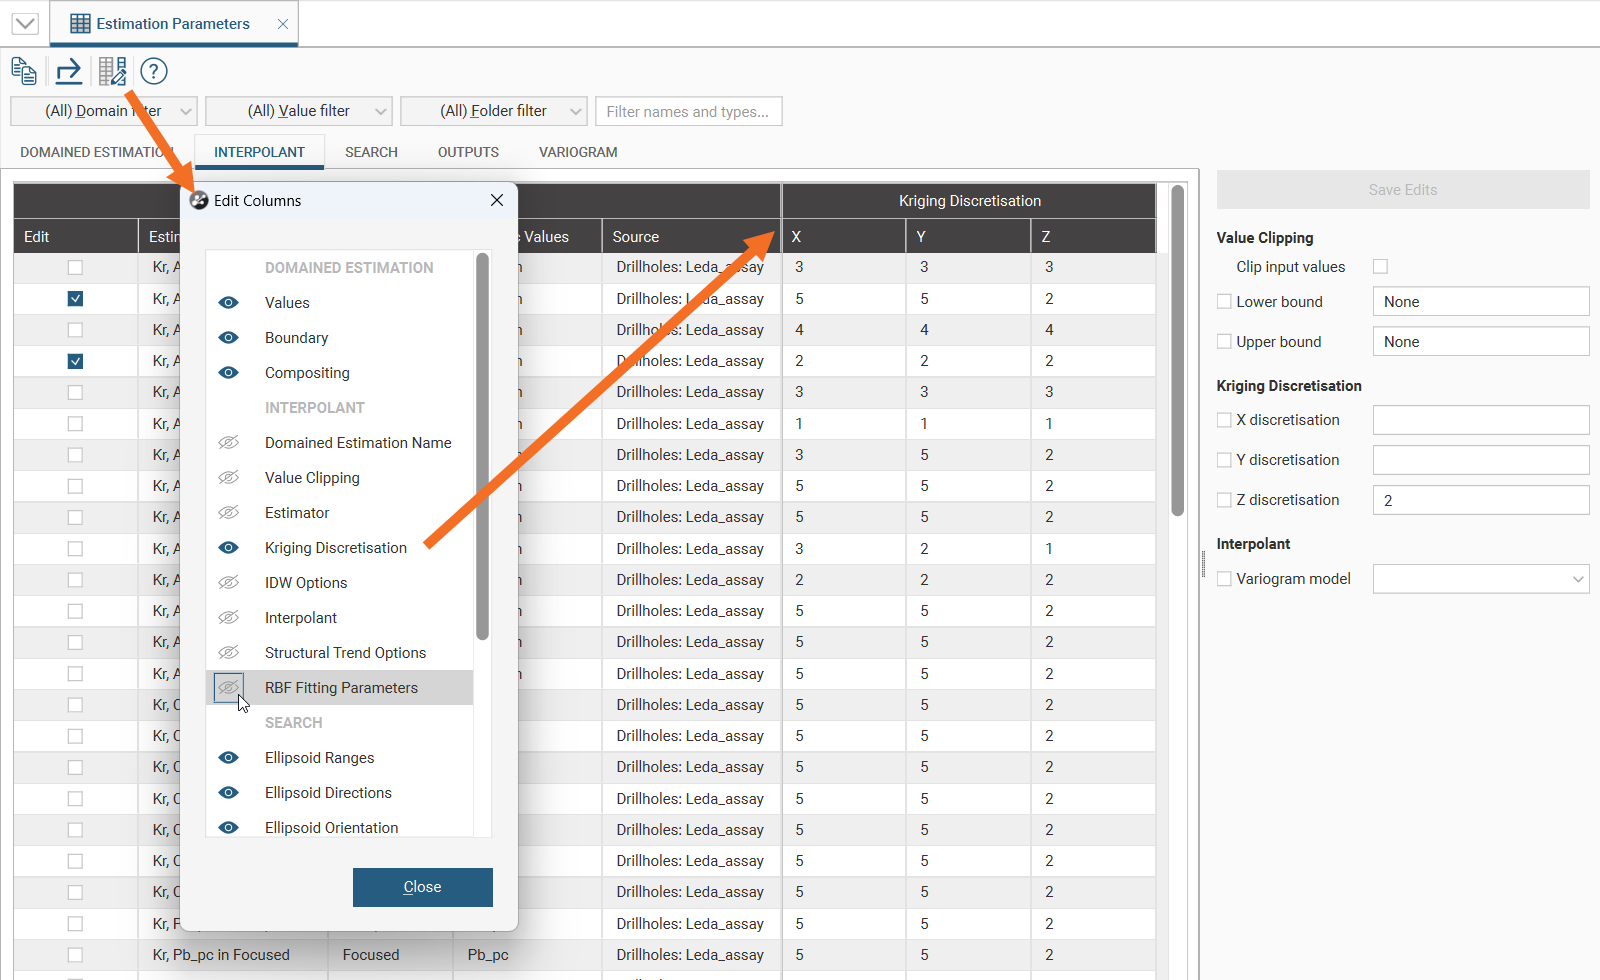
Bulk editing of parameters is supported in the Parameters Report by ticking more than one row's Edit box. In this situation, if there are conflicting values for any of the fields, those fields in the quick edit panel will be blank. Enter new values in the quick edit panel to apply the specified value to the fields across all the selected rows, replacing whatever values were there previously. A tick will be displayed for any field that will be changed when the Save Edits button is clicked. For example, here the Intermediate value will be updated for the selected rows when changes are saved, but the other fields have no pending changes:
Elsewhere in Leapfrog Geo, changes made to a field are immediately applied. Because of the number of estimations these changes may be applied to and the time that will be required to apply and process these changes, here the changes to the fields are not applied until you are ready to Save Edits. Closing the window or switching to a different tab without clicking on Save Edits will discard the changes prepared.
Exporting Parameters
Select the Export button (![]() ) to create an Excel spreadsheet containing the estimation parameters for use in another application. Each of the estimation parameter tabs in the Parameters Report will appear as worksheets within the Excel spreadsheet.
) to create an Excel spreadsheet containing the estimation parameters for use in another application. Each of the estimation parameter tabs in the Parameters Report will appear as worksheets within the Excel spreadsheet.