Displaying Structural Data
Planar structural data is displayed as disks, lineations are displayed as cones, and triaxial trend ellipsoids are displayed as ellipsoids.
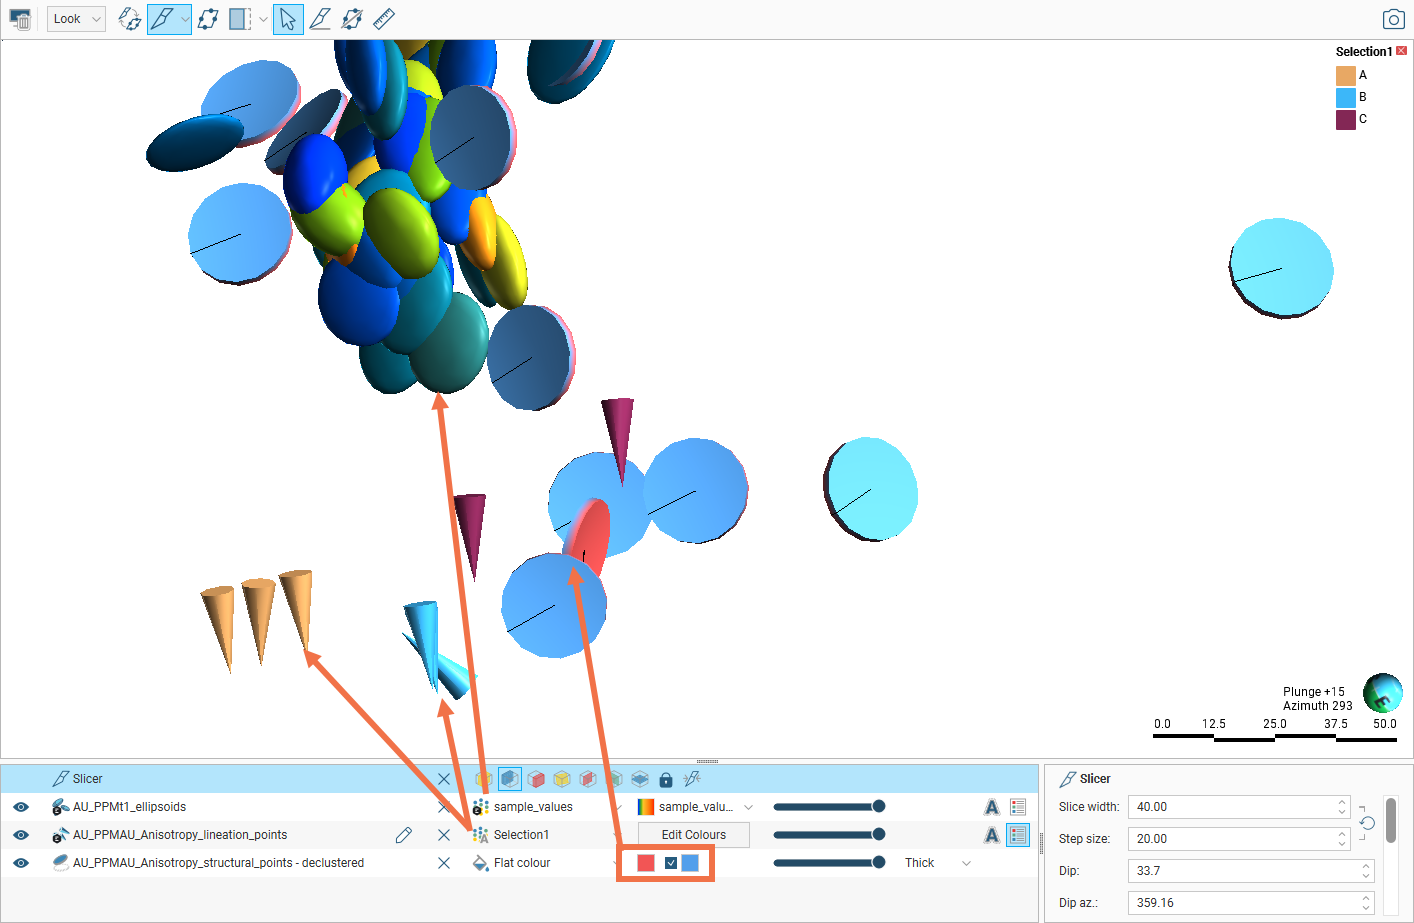
There are several ways to change how each data type is displayed. In the scene below:
- Planar structural data is displayed using the Flat colour option, with positive (red) and negative (blue) sides shown.
- Lineations are displayed using the colours assigned to category types.
- Ellipsoids are coloured according to a colourmap associated with a selected column.
You can change the flat colours, including both colours used to display the positive and negative sides of a disk, category colour selections and numeric column colourmaps, as described in Colour Options in the Visualising Data topic.
To set multiple categories to a single colour, use the Shift or Ctrl keys to select the colour chips you wish to change, then click on one of the colour chips. The colour changes you make will be made to all selected categories.
The categories displayed can also be filtered by other columns in the data table, as described in Using the Display Filter in the Visualising Data topic.
Planar Structural Data Display Options
For planar structural data, you can display the disk data points as Thick disks, Flat disks or as Outlined Flat disks:
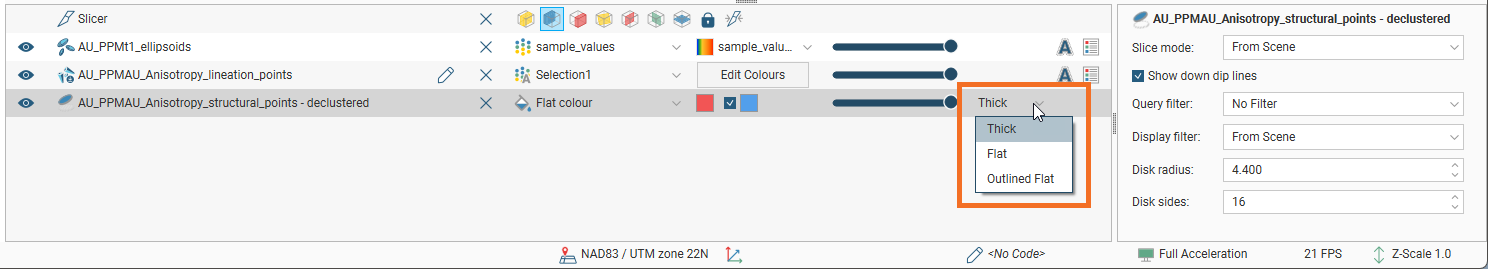
You can change the Disk radius and the number of Disk sides using the controls in the shape properties panel.
Lineation Display Options
Then length of the cones used to display lineations is set in the properties panel using the Cone length and Scale Values settings.
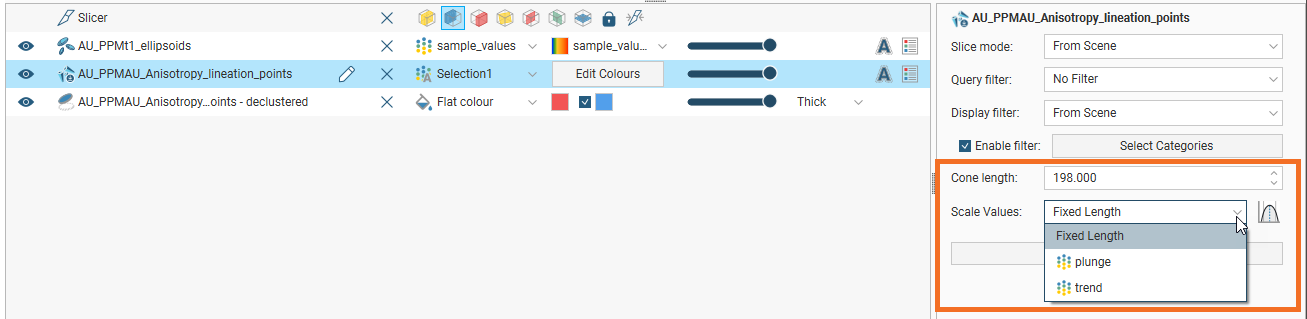
When Scale Values is set to Fixed Length, the Cone length setting will be used.
When Scale Values is set to one of the table’s columns, the values from that column are used in combination with the Cone length setting.
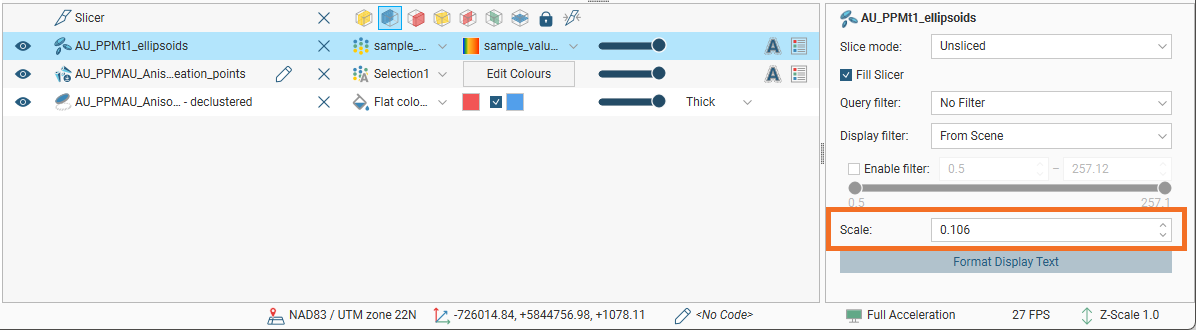
Ellipsoid Display Options
The size of ellipsoids in the scene can be modified by changing the Scale value in the shape properties panel: