Displaying GIS Data
In Leapfrog Geo, there are three ways of viewing GIS data:
- In its “native” form, as it was imported to the project. Add the GIS data object to the scene as you would any other object.
- On the topography. GIS data objects added to a project are automatically projected onto the topography and saved in the Topographies > Draped GIS Objects folder. Add the draped GIS object to the scene.
- Combined with other data draped on the topography. See Custom Topography Views below.
The reason for having different ways of displaying GIS data is the difficulty posed by inconsistent height data. Not all height data is correct or wanted. In practice, it is important for all the data to be consistent. For this reason, a single elevation field is defined as part of the topography and available data is assigned heights from this object. The native height information is available and can be used to define the height of layers in the models.
Custom Topography Views
In Leapfrog Geo, topography can be displayed with any of the GIS data and images available in the project. With a custom view, you can display multiple GIS data objects, maps and aerial photos.
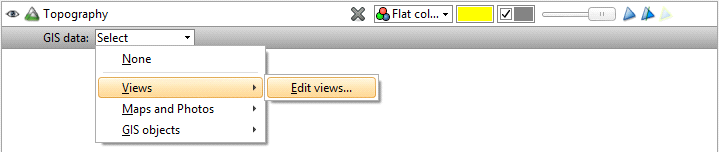
To create a custom view, add the topography object to the scene. Select Views > Edit views from the GIS data list:
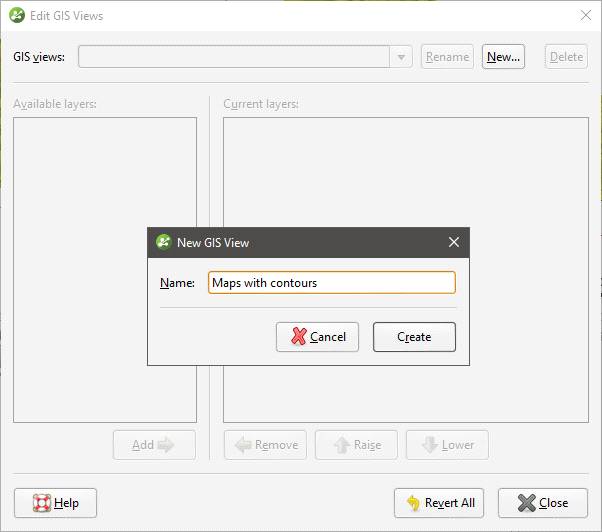
The Edit GIS Views window will appear. Click New to create a new view. Enter a name for the new view and click Create:
The new view will be created in the Edit GIS Views window, together with a list of Available layers. Click the Add button to move layers into the Current layers list and use the Raise and Lower buttons to arrange them:
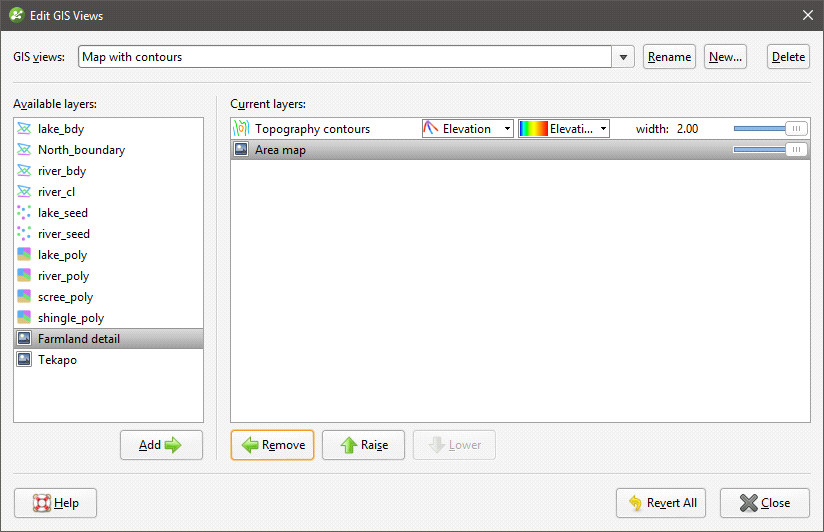
Use the transparency and point and line size controls to emphasise data.
Click Close. The topography will be displayed in the scene with the new view applied:
