Visualising Data
Visualising data is an important part of interpreting and refining data and making modelling decisions.
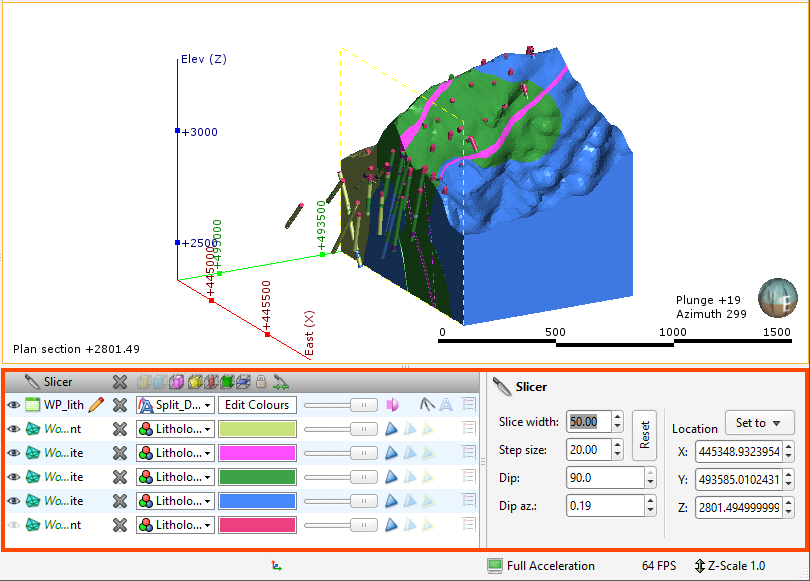
This part describes the tools available in Leapfrog Geo for visualising data. These tools are accessed via the shape list and the shape properties panel:
The tools available depend on the type of object being displayed:
- Drillholes can be displayed as lines or points and with the data associated with each segment. Data can be filtered using the shape properties panel controls and by applying query filters.
- Multiple drillhole data tables can be displayed in the scene so that relationships between data in different tables can be explored.
- Some data can be displayed using a colour gradient, with the colourmap adjusted to enhance values of interest. Discrete colourmaps can also be applied to view numeric data in groups.
- Points data can be viewed as simple points or using the size of spheres to display associated values.
- GIS data can be viewed in its native form, on the topography or as part of a custom topography view.
Many objects in Leapfrog Geo can be displayed evaluated on other objects. See Evaluations.
Presentation describes how to display data and create scenes, movies and scene files for presentation purposes.