Grade Tonnage Graphs
The features described in this topic are only available if you are licensed to use Leapfrog EDGE with Leapfrog Geo.
A grade tonnage curve combines two or three equations together to produce one of the more important tools for analysing the data indicating the potential amount of material obtained when varying the cut-off grade applied.
Leapfrog Geo can display multiple grade tonnage curves on one graph.
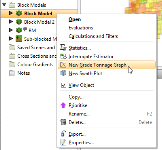
To create a grade tonnage graph, right click on a block model and select New Grade Tonnage Graph:
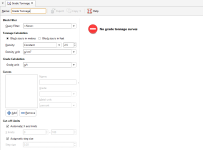
A new Grade Tonnage window will open:
You can select a Block Filter query by choosing a filter from the Query Filter list. To add a new filter to this list, create a new filter in Calculations. See Filters and the subsequent sections in Calculations and Filters on Block Models for more information.
There are several Tonnage Calculation settings.
Select between the Block size is in metres and Block size is in feet options, as appropriate for your data.
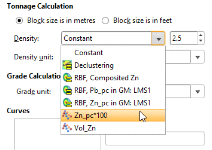
The Density can be set to a specified Constant, or one of the numerical data columns in the data can be selected, perhaps to provide a calculated density for each block.
Select the Density unit as appropriate. The options are: g/cm3, t/m3, lb/ft3, sh. ton/ft3, ft3/sh. ton.
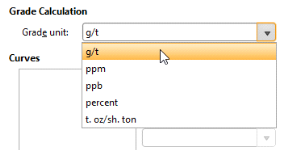
Select the desired Grade unit for the Grade Calculation.
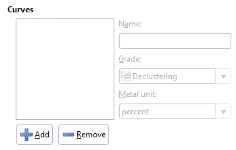
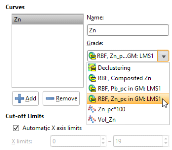
Multiple grade tonnage Curves can be added. Initially there are none listed. Click the Add button to add a new curve. Provide an identifying Name for the curve, and select the Grade calculation from the list of numeric columns in the data. If you need to write a grade calculation, you can add it as a numeric calculation in Calculations. See Numeric Calculations and the subsequent sections in Calculations and Filters on Block Models for more detail.
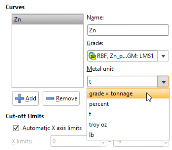
The Metal unit field does not change any aspect of the grade tonnage chart. It selects the metal unit that will be exported with the grade tonnage calculation data when Copy Data is selected.
Once a curve is selected, a graph will be generated, using the automatic Cut-off Limits. You can manually override these by unticking Automatic X axis limits and specifying your preferred minimum and maximum X limits, and/or by unticking Automatic step size and specifying a preferred Step size.
You can click the Add button under Curves to add more grade tonnage curves to the graph.
Provide a Name for the grade tonnage graph in the window’s toolbar.
The Export button in the window’s toolbar saves the current grade tonnage graph as a PDF file. You will be asked to provide a file name and storage location for the new PDF file.
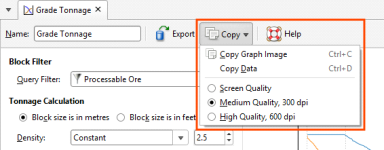
The Copy button provides two additional ways to export grade tonnage graph information:
- The Copy Graph Image will put an image on the operating system clipboard at the selected quality: Screen Quality, Medium Quality, 300 dpi, or High Quality, 600 dpi.
- The Copy Data option will put CSV data on the operating system clipboard.
The objects on the clipboard can then be pasted into other applications you are using, such as Microsoft Word or Microsoft PowerPoint.
Got a question? Visit the My Leapfrog forums at https://forum.leapfrog3d.com/c/open-forum or technical support at http://www.leapfrog3d.com/contact/support
