Section Layouts
With the Section Layout Editor, you can create a section layout for an existing section and then export the section. You can customise the section layout by:
- Adding models and surfaces the section has been evaluated against
- Adding drillholes and planned drillholes
- Changing the page size, orientation and margins
- Adding titles, a scale bar, legends, annotations and images, such as a standard form or logo
The appearance of all objects can be customised without changing how objects from the project tree are displayed in the scene.
This topic describes how to work with section layouts. It is divided into:
- Creating New Section Layouts
- The Section Layout Editor
- Displaying Section Layouts
- Exporting Section Layouts
- Batch Exporting Section Layouts
- Copying Section Layouts
Once you have created a section but before you start creating the section layout, take the following steps.
1. Check the section’s extents and orientation.
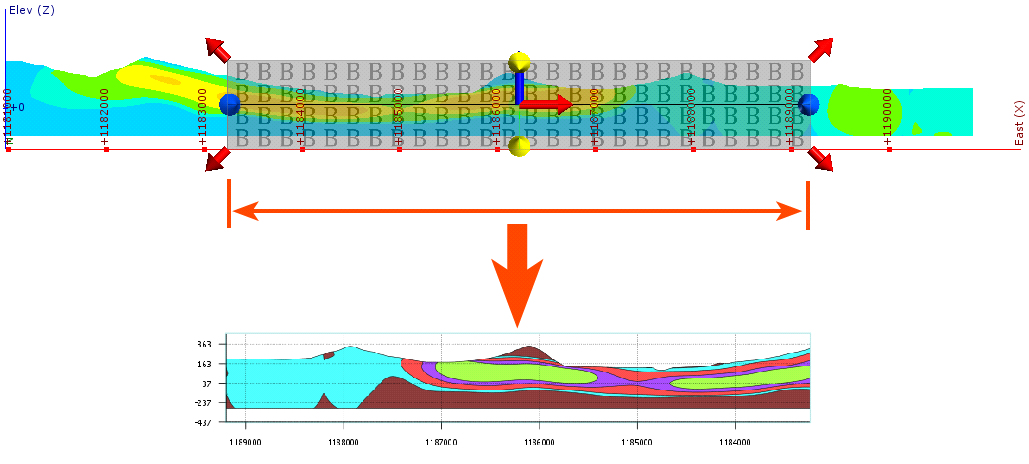
The initial dimensions of the section on the page are determined by the size of the section plane, and its orientation on the page is determined by the front (F) and back (B) faces of the section plane. Here, the front and back faces of the section have been swapped, which results in the section displayed on the page being flipped:
2. Check that the section has been evaluated against objects you wish to display on the page.
To do this, right-click on the section in the project tree and select Evaluations or Evaluate Surface.
3. Add planned drillholes to the project.
Planned drillholes can be displayed on the section, but these must be defined before you start the process of laying out the section.
Creating New Section Layouts
To create a new section layout, right-click on an existing section in the project tree and select New Section Layout. The New Section Layout window will appear, together with the Section Layout Editor:
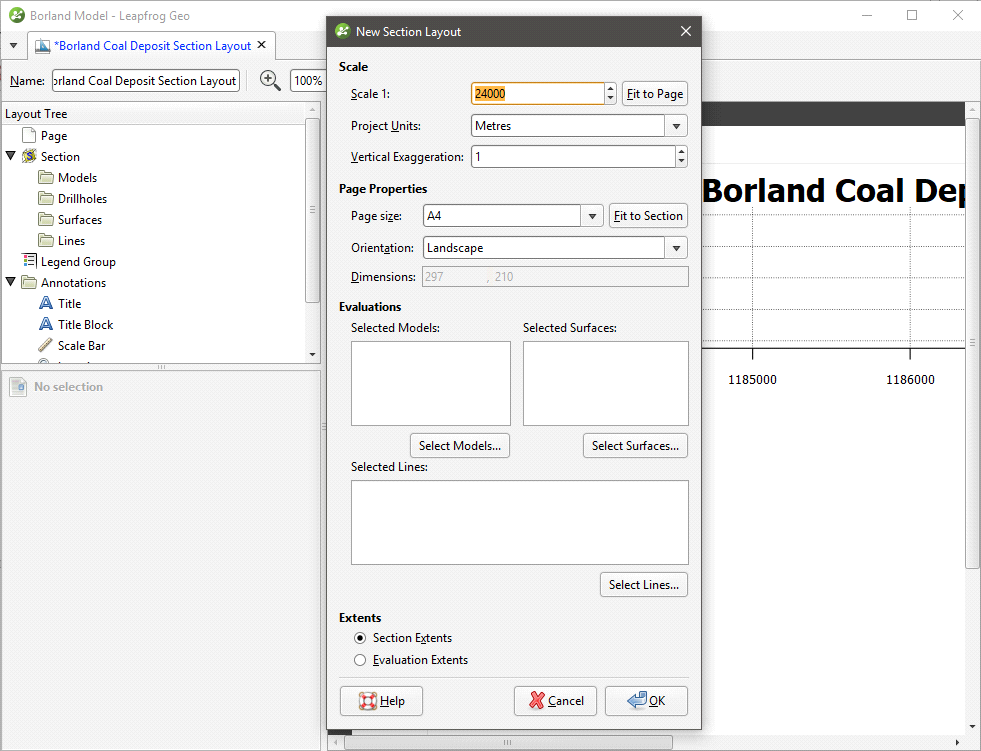
The settings in the New Section Layout window determine the basic section layout. Each setting is described below. All settings in the New Section Layout window can be changed once the layout has been created.
Changing how objects are displayed on the section page does not change those objects in the project.
As you add objects to the section, the preview in the Section Layout Editor window will be updated.
Click OK to close the New Section Layout window. You can then make further changes to the page layout in the Section Layout Editor. See The Section Layout Editor.
Scale
The Scale settings determine the scale used to display the section on the page. As you change the scale settings, the layout of the section on the page will be updated in the preview. If you want a specific page size, select Fit to Page to set a scale that best fits the page width. You will be able to change the page margins once you have closed the New Section Layout window.
Page Properties
The Page Properties settings determine the page size and orientation. If you wish to use a specific Scale, select the Orientation required, then click Fit to Section to choose the best page size.
Evaluations
For Evaluations, select from the models, surfaces and lines the section has been evaluated against. When you select an evaluation, it will be added to the preview. Note that when you add a model to the page, a legend for the model is also added.
If you wish to use the extents from a model evaluation, select only that model and then select the Section Extents option below. Once you have closed this window, you will be able to add further models using the section layout editor.
Extents
For Extents, choose whether to use the Section Extents or Evaluation Extents.
The Section Layout Editor
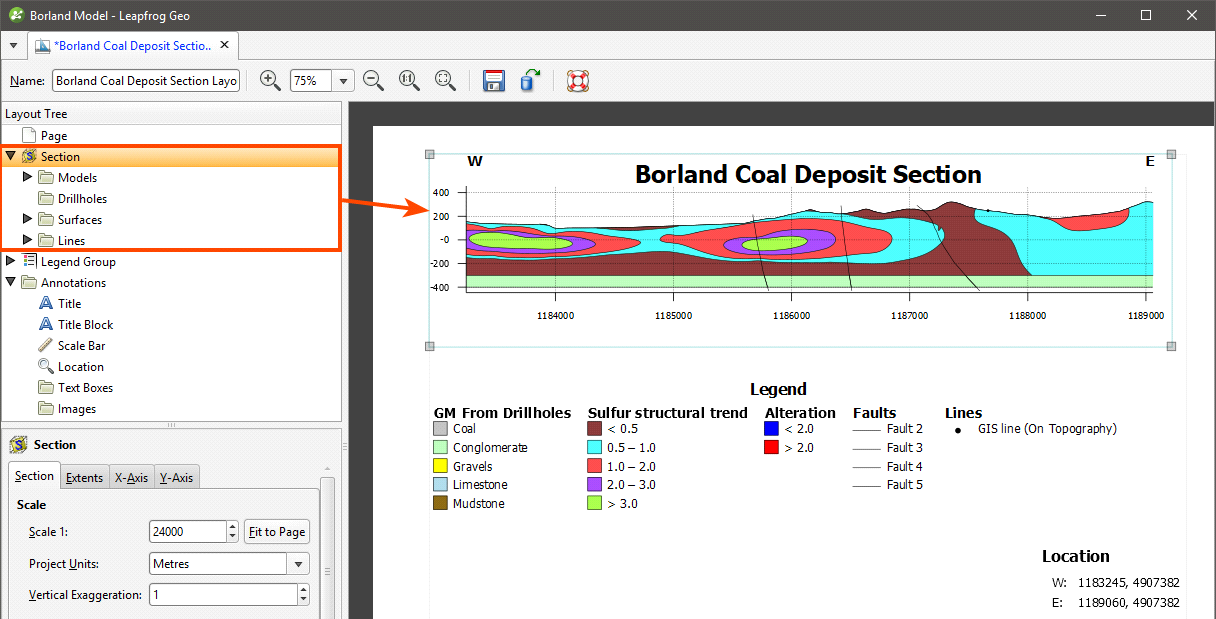
In Section Layout Editor, the Layout Tree shows the different layers that can be added to the page. The different parts of the Layout Tree as they relate to the page preview are shown below:
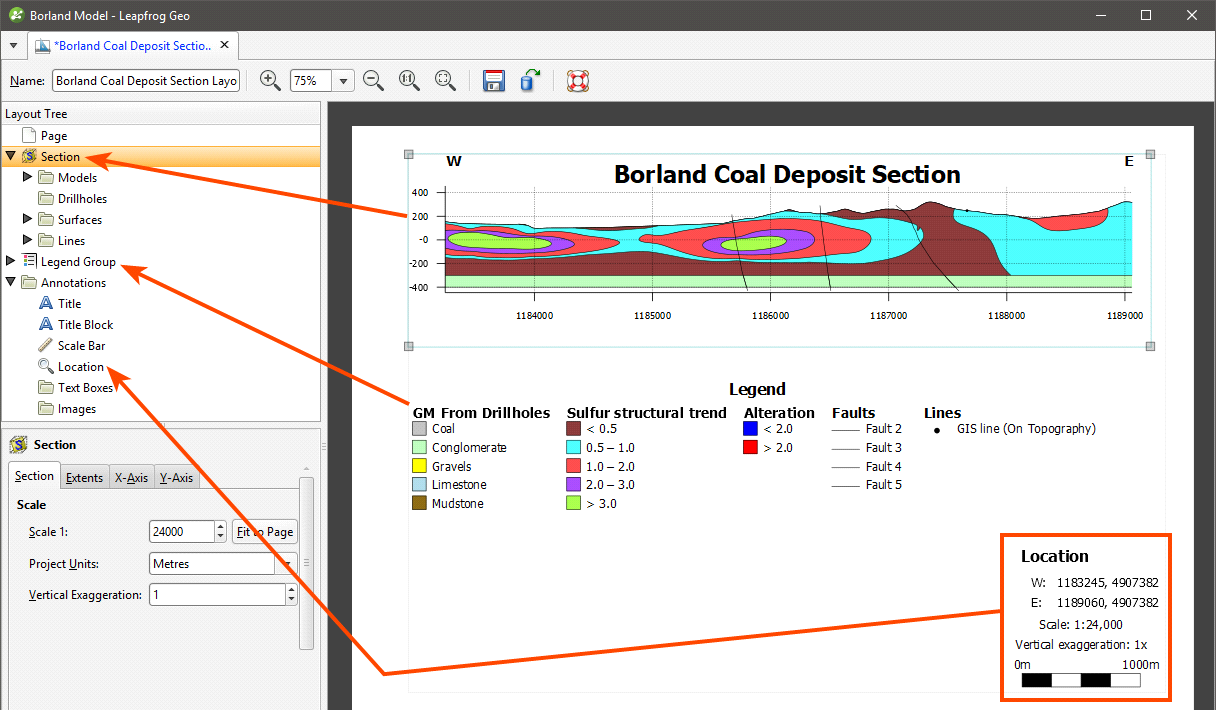
When you select an object in the layout tree, it will be highlighted by a blue line on the page. In this example, the Section object is selected.
For more information about working with the different parts of the section layout, see:
- Setting Up the Page
- Organising the Section
- Organising the Legend Group
- Adding and Organising Annotations
Click on an object in the page preview to move or resize it. This will also select the object in the Layout Tree and you can see what properties can be changed. For example, in the preview, click on the Title to view its styling options:
The Section object controls all the models and surfaces displayed on the section:
Models and surfaces selected in the New Section Layout window are automatically added to the page preview. Further objects can be added by right-clicking on Models, Drillholes or Surfaces. When models are surfaces are added to the layout, entries are automatically made in the Legend Group.
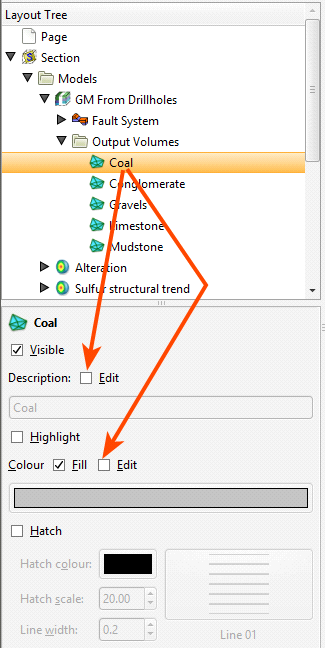
Object Names and Colours
The names and colours of objects in the layout are linked to their parent objects in the project tree. You can override them by selecting the object in the Layout Tree, then ticking the Edit box:
If Edit is disabled for an object’s text or colour and changes are made to the parent object while the Section Layout Editor window is open, the changes will not be reflected in the section layout until it is next opened.
If Edit is enabled for an object’s text or colour, then that property will not change when the parent object’s colour or title are changed.
Styling Layout Objects
All layout objects are styled by clicking on them in the Layout Tree, then adjusting their appearance in the properties panel.
Text displayed in the section layout is controlled by a style sheet that can be accessed whenever you are editing a text object. For example, clicking on Edit Styles for the Title opens the list of Text Styles with the Title selected, but also allows you to change the appearance of styles used for other text objects visible in the preview:

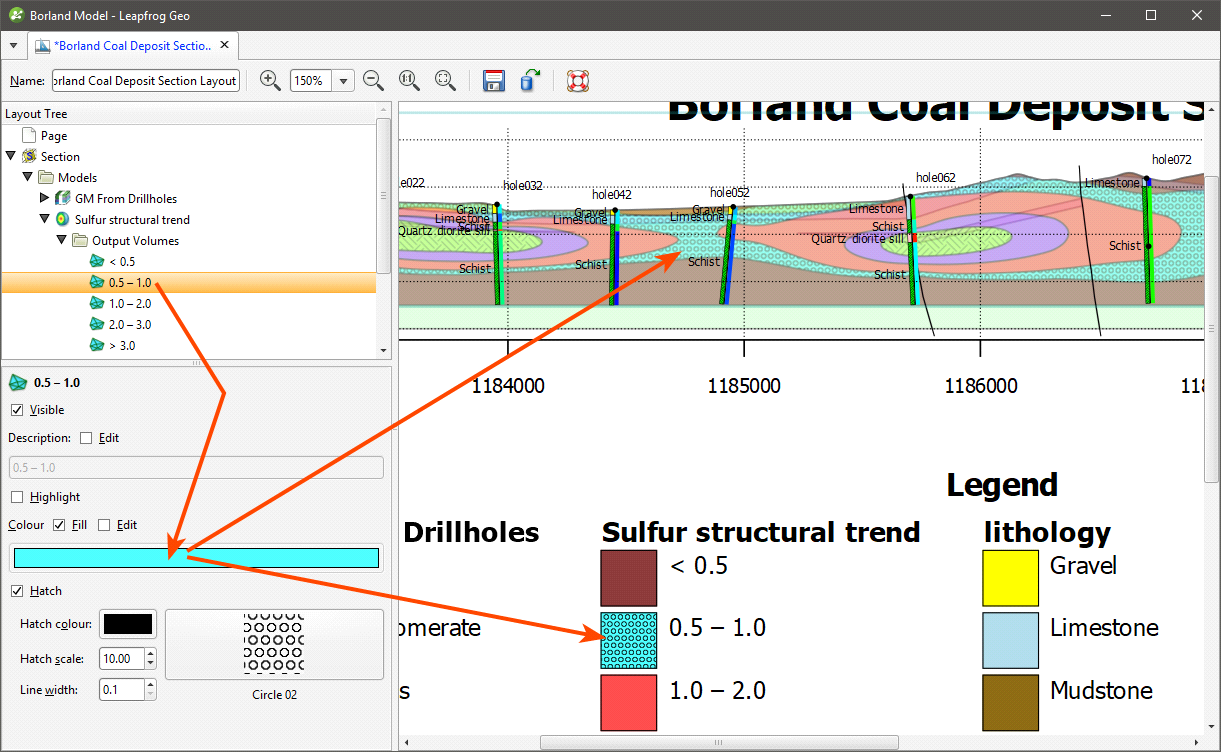
Line, border and swatch properties are also changed in the properties panel. Swatches for output volumes can be displayed using a hatched fill, which is enabled by clicking on the output volume in the project tree, then changing its properties:

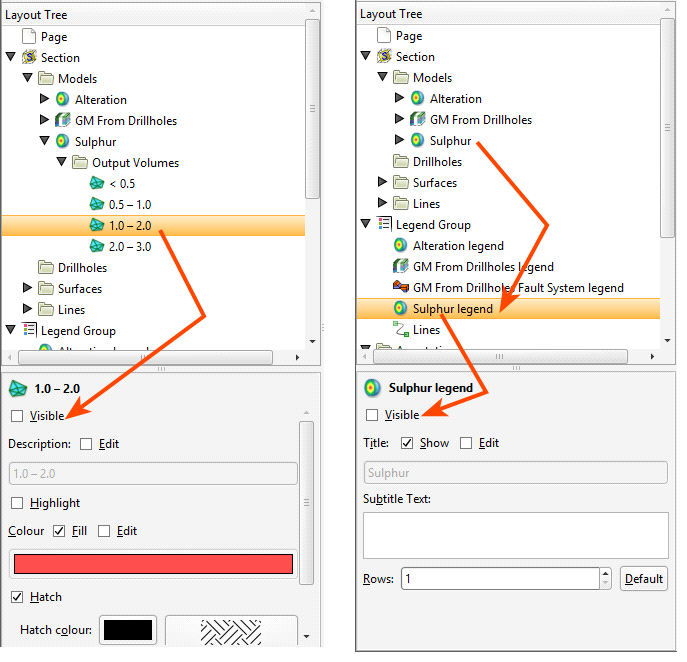
The styling of objects in the Layout Tree controls how they appear in their associated legend. The Legend Group object controls the position and size of the legend, but not the colour, line style and fill used to display each object. For example, the appearance of the volume <0.5 in the interpolant is controlled from the Models object (left). Whether or not the legend is visible on the page and how it is displayed is controlled from the Legend Group object (right):
When a model or other object is added to the section, a legend for that object is added to the Legend Group.
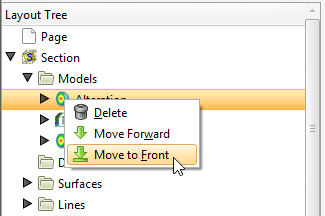
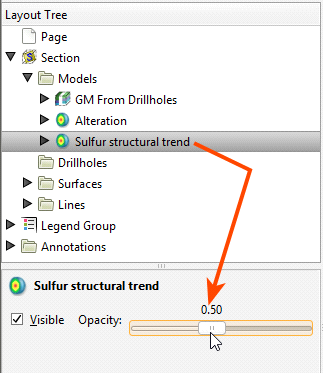
Some objects, such as models, drillholes and surfaces, occupy the same space on the page. These objects can be organised into layers, and opacity settings changed to emphasise relevant information. To change the order of objects on the page, right-click on them and select how you wish to organise the layers:
To change the opacity of an object, click on it, then adjust the object’s Opacity using the slider:
Setting Up the Page
Page Properties are set in the New Section Layout window, but these can be changed in the Layout Tree. Click on the Page object to change the Page Size, Orientation and Margins:
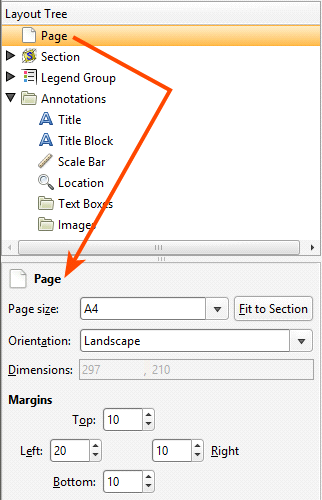
If you wish to use a specific Scale, select the Orientation required, then click Fit to Section to choose the best page size.
Organising the Section
The Section object controls the appearance of the section and the objects in the project that are displayed on the section. The properties for the Section object itself control the size of the section on the page and how the axes are displayed. Any changes made in these tabs are displayed in the preview so you can experiment with these settings.
- The Section tab includes the Scale settings from the New Section Layout window.
- The Extents tab includes the settings from the New Section Layout window and additional options for displaying Additional sky and end point labels.
- The settings in the X-Axis and Y-Axis tabs determine how the axes are displayed. By default, the axes are displayed only on the left-hand side and along the bottom of the section. To display axes along the right-hand side and above the section, tick the Secondary option.
The other objects that are part of the Section object are used to add models and surfaces that are displayed on the section and to customise how they are displayed. For cross sections and serial sections, you can also add drillholes and planned drillholes.
Changing how objects are displayed on the section layout does not change those objects in the project.
Adding and Styling Models
If you selected models and surfaces in the New Section Layout window, these are automatically added to the Models and Surfaces objects in the Layout Tree. To add more models, right-click on the Models object and select Add Model. The models the section has been evaluated on will be listed. Select those required and click OK. The new models will be added to the Models object and legend items added to the Legend Group.
Different objects in the project can be evaluated on sections, as described in Evaluations. Such objects include:
- Geological models
- Numeric models
- Distance functions
- Surfaces
- GIS lines
- Polylines
- Combined models
When evaluating objects on sections, you can limit the evaluation to the section extents. To do this, enable the Clip evaluations to section extents option when selecting what objects you are evaluating.
Block models can be evaluated on cross sections but not on serial sections and fence sections.
If you selected a geological model with a fault system, the faults will automatically be added to the section and to the Legend Group. Change a fault system’s properties by expanding the geological model in the Layout Tree and clicking on the Fault System and its faults.
When you display multiple models on the section:
- Use the Opacity setting for each model to expose and emphasise information.
- Right-click on the models to move them up or down in the layer hierarchy.
- Expand each model in the Layout Tree to change the Fill and Hatch for each output volume to make some volumes more apparent.
- Hide some of the Output Volumes.
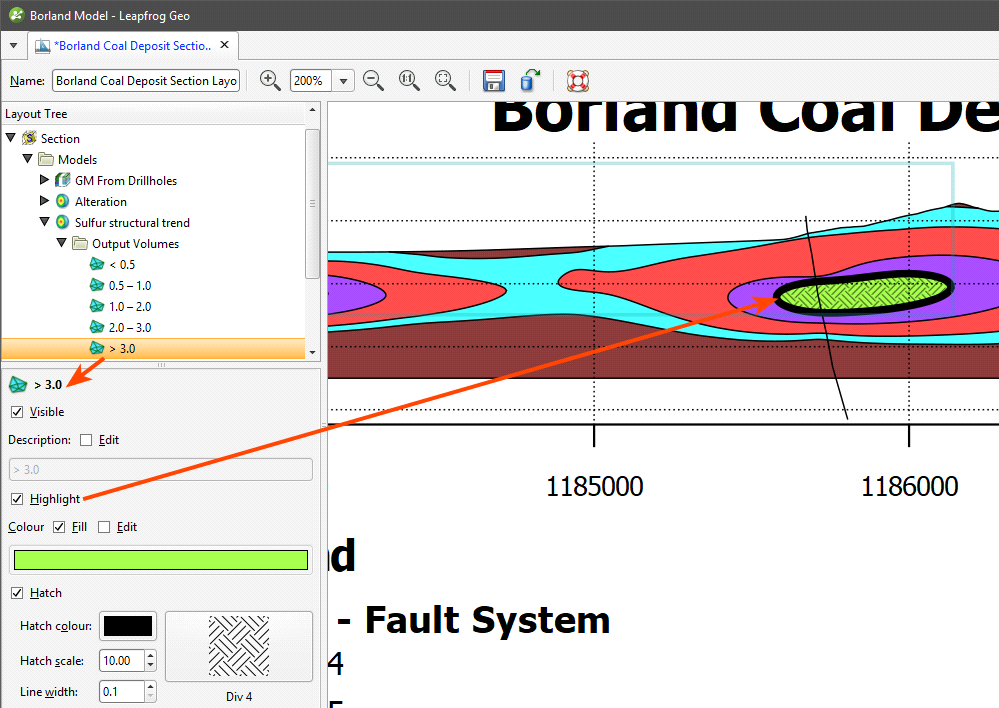
A single line style is used to display a model’s output volumes. There is, however, a Highlight option that can be enabled to make a volume of interest stand out from the other volumes:
The Opacity setting for each output volume in a model is inherited from the model as a whole. You cannot change the Opacity on a volume-by-volume basis; however, you can hide individual volumes.
For geological models with a fault system, the fault system does not inherit its Opacity setting from the parent model.
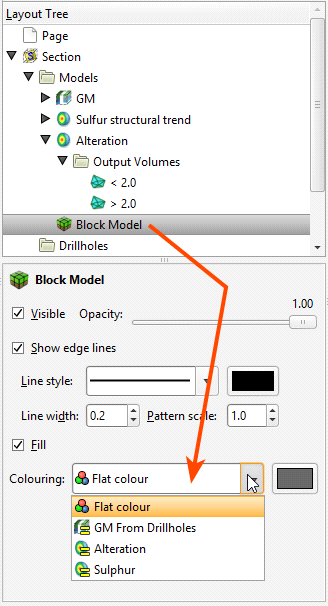
Block models and flow models evaluated on the section can be displayed using a flat colour or any of the Colouring options available for the model:
Click Options to change the colours used to display the model:
- For category evaluations, you can change what categories are visible and the colours used to display them.
- For numeric evaluations, you can filter values and use a different colourmap.
If a block model or flow model is too big for the section layout, changing the section extents or the section layout extents will effectively “crop” the model and make it small enough to display on the section layout. There are two ways to do this:
- Change the section layout extents by clicking on Section in the Layout Tree, then clicking on the Extents tab. If Extents is set to Evaluation Extents, change it to Section Extents.
- Change the size of the section by double-clicking on it in the project tree and then editing its dimensions in the scene.
Adding and Styling Drillholes and Planned Drillholes
Drillholes and planned drillholes can be added to the cross section. Up to three columns of data can be displayed, and numeric data can be displayed as a graph.
To add drillholes to the section, right-click on the Drillholes object and select either Add Drillholes or Add Planned Drillholes.
For adding drillholes, you will be prompted to select the interval table to display.
For both drillholes and planned drillholes, you can filter the drillholes based on a minimum distance from the section plane:
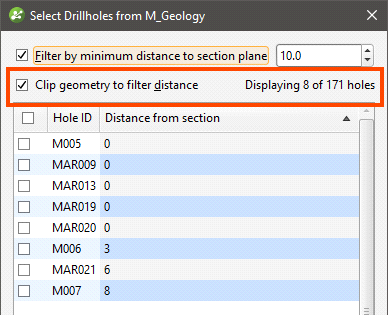
This is the minimum distance to any point on each drillhole trace.
If you tick the Clip geometry to filter distance option, only parts of the drillhole within the filter distance will be included in the section layout. Select the required drillholes and click OK.
When drillholes and planned drillholes are added to a curved section, a projection is made based on the locations of neighbouring segments of the section, using the bisectors of the angles between each segment and its neighbour. These determine the projection point of origin for a given segment of the section. When drillholes are filtered by the distance to the section plane, the distance is measured at 90 degrees from the section. Some drillholes may report a distance that is greater than the specified minimum distance; if this is the case, it is because the evaluation distance is relative to the projection origin.
On the inside of a tight corner, a single drillhole may be projected multiple times onto the section. If this is the case, the multiple instances of the drillhole will appear in the boreholes list and you can turn individual instances off, if required.
When a fence section is updated, drillhole evaluations are updated. If there are multiple instances of a drillhole evaluation, how they appear on the section may change when the section is updated:
- If all instances of a drillhole evaluation have been enabled, then all remain enabled when the section is updated.
- If all instances of a drillhole evaluation have been disabled, then all will remain disabled when the section is updated.
- If only some instances of a drillhole evaluation have been enabled, then all instances will be enabled when the section is updated.
When a section layout is copied to another section from a fence section, drillhole evaluations will not be copied with the section layout.
To hide or change the appearance of drillhole labels, click on the drillhole table, then on the Points and labels tab. Click Options to change how the labels are displayed. You can rotate labels and have a line connecting the label to the collar:
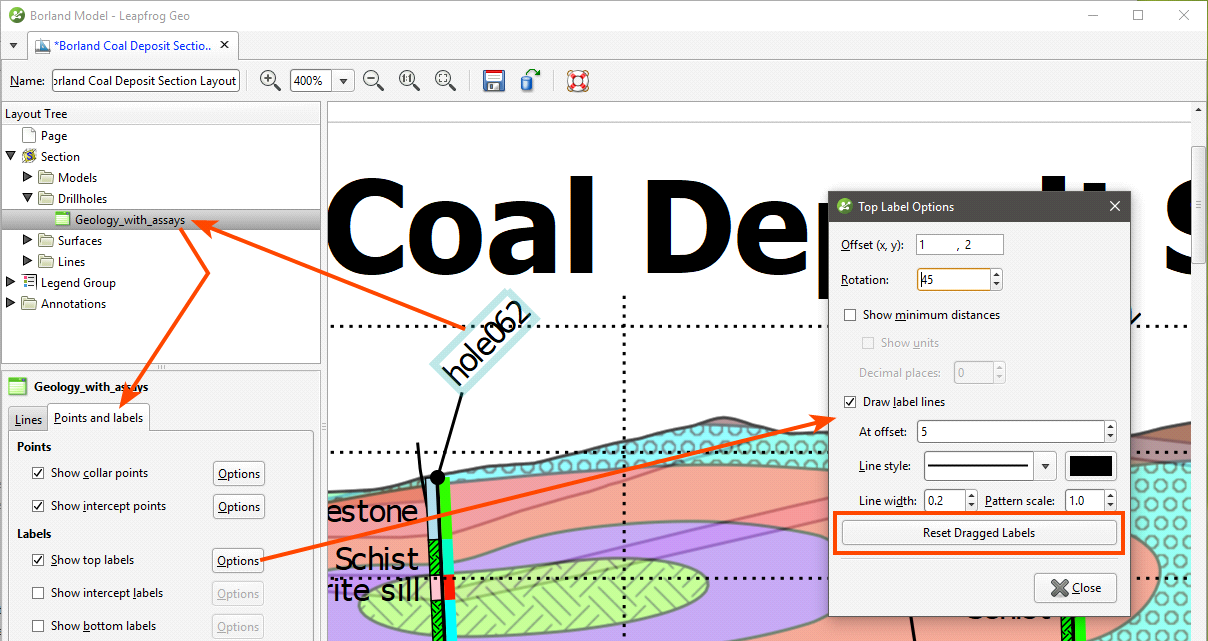
You can also click on the labels in the layout and move them. Note that the label lines will only appear once the drillhole label has been moved away from the collar.
If you want to return all labels to their default positions, click Reset Dragged Labels in the Points and Labels > Label Options window.
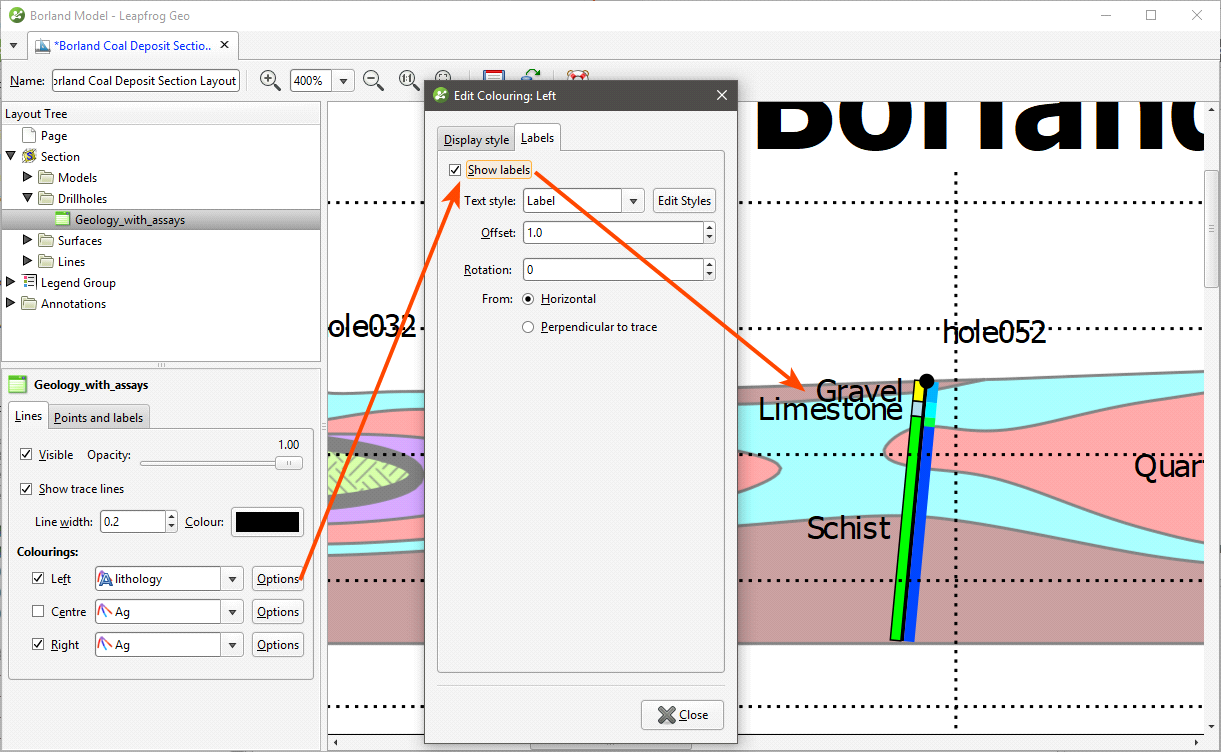
How drillholes are displayed is controlled by the Colourings settings in the Lines tab:

Click the Options button to display data (category data) or filter values (numeric data) on the drillholes:
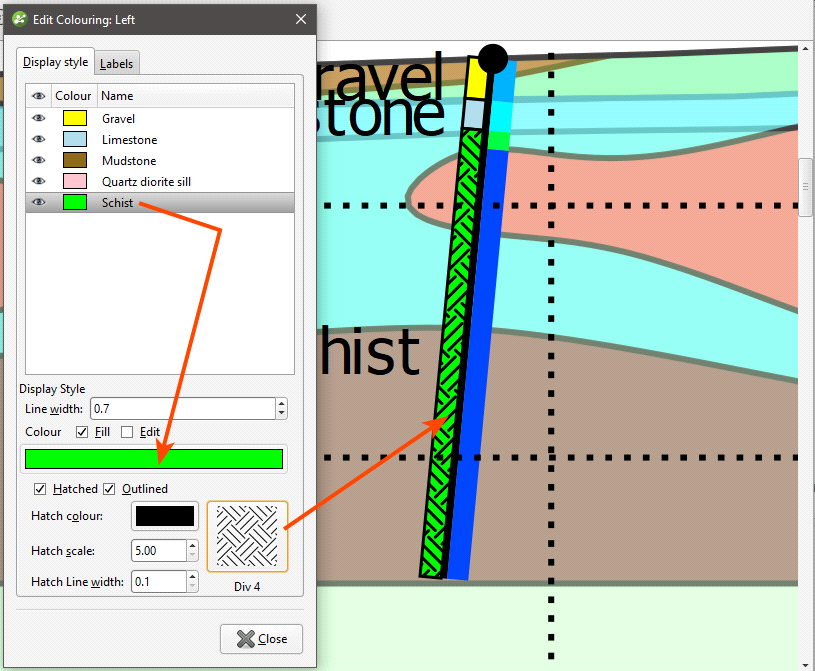
Drillholes can be displayed using hatching patterns. In the Display style tab, tick the Hatched option, then select from the patterns available:
For columns of numeric data, you can display data as a bar graph or line graph. These options are available in the Display style tab. Here, data is displayed as a bar graph:
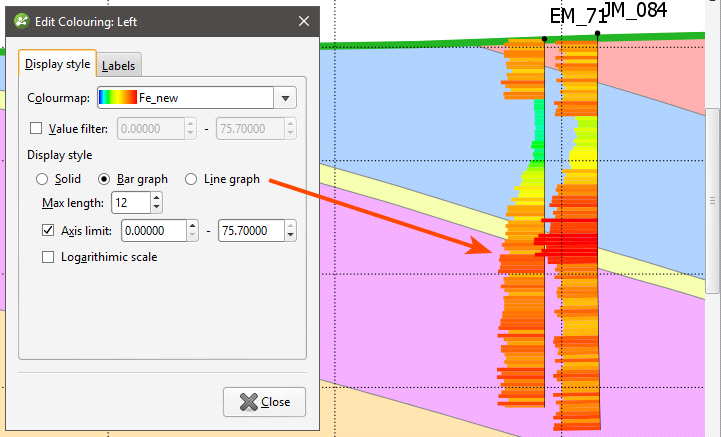
Select a Max length that means that displayed data does not interfere with other drillholes or data displayed on the section layout. This is especially useful when two graphs are displayed:

If you only want to plot a limited range of data, tick the Axis limit box and set the required range.
Displaying data with the logarithmic scale enabled may enhance differences in the values, and negative values can be scaled.
The bar and line graph options are not available for the centre of the drillhole, although the solid option can be used.
Adding and Styling Lines
To add a line to the section, right-click on the Lines object and select Add Line. The lines the section has been evaluated on will be listed. Select those required and click OK.
The options for styling lines are the same as for lines. A line can be displayed in the legend, if required.
Adding and Styling Surfaces
To add a surface to the section, right-click on the Surfaces object and select Add Surface. The surfaces the section has been evaluated on will be listed. Select those required and click OK.
Click on the line in the layout tree to view styling options, including the size, shape and colour of the pierce point:

A line can be displayed in the legend, if required.
Organising the Legend Group
The Legend Group controls how the legend is displayed on the page.
When you add a model, surface, line or drillhole object to the section, a legend for that object will be added to the Legend Group.

Note that:
- The Surfaces that appear on the section have been added to a single legend.
- Because the drillholes displayed on the section use Left and Right Colourings, a legend has been added for each, a lithology legend and a numeric data legend.
Changing the Legend Group Layout
Select the Legend Group itself to change its layout. These settings apply to the Legend Group as a whole. Columns can be laid out vertically or horizontally:

You can also change the swatch size and gradient and add a Boundary box.
For each individual legend, you can change the number of Rows used to display the values
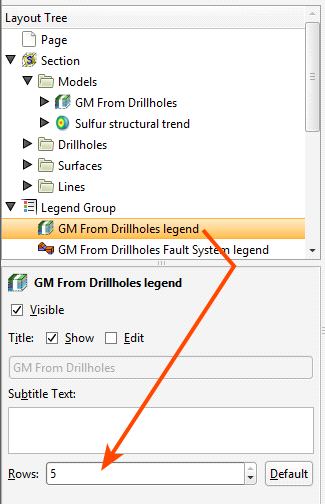
The order in which legends appear in the Legend Group is the order in which they appear in the Layout Tree. To change the order in which the legends appear, right-click on them and select a Move option.
Use the Legend GroupLayout > Columns setting and the Rows setting for each individual legend to make the best use of the space available on the page.
Styling Legend Swatches
The colours, line widths, fills and hatches displayed in the Legend Group are controlled by the objects themselves. For example, to change how a shell is displayed for the interpolant, click on the output volume, under the Models object:
Making Legends Visible and Invisible
If you do not wish to include a legend in the Legend Group, click on it in the Legend Group and untick Visible:

This does not change whether or not the object itself is visible, it simply excludes it from the Legend Group.
Adding and Organising Annotations
Once you have laid out the main Section object and organised the Legend Group, you can add a number of different types of annotation to the layout.
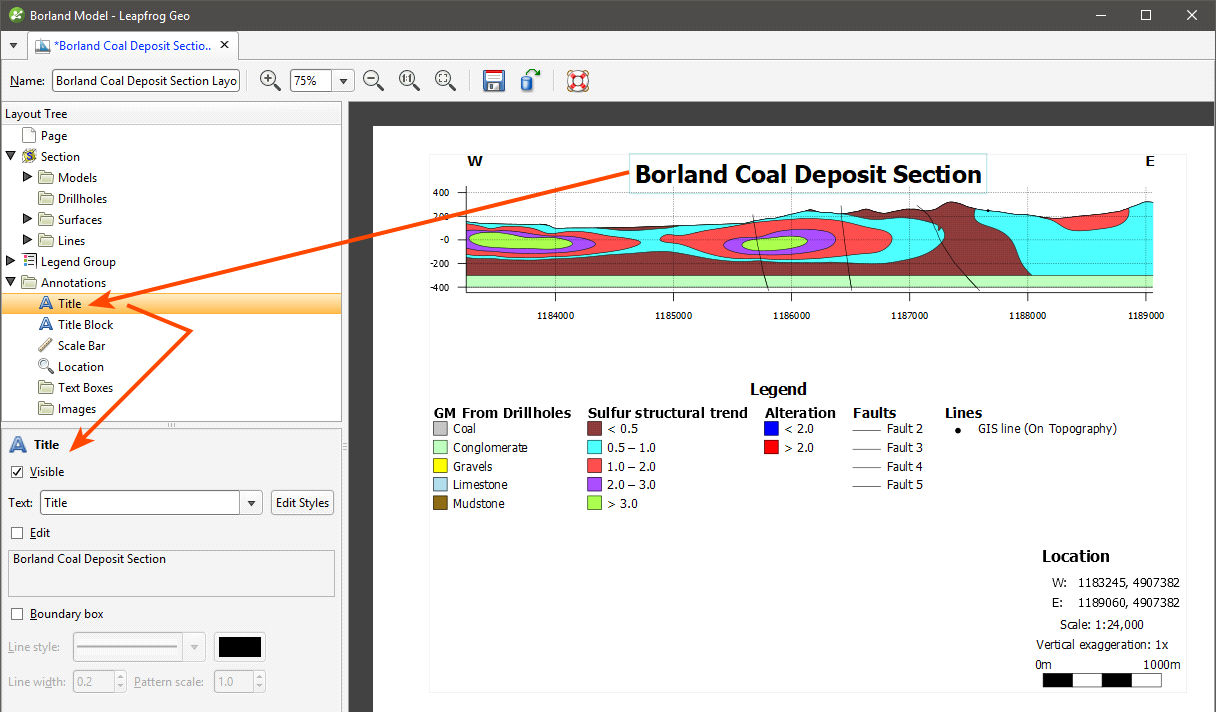
Title
The Title object formats the title displayed on the page. To move the title, click on it in the layout preview. The text used for the Title is the name for the section in the project tree, but this can be changed in the properties panel.
Title Block
The Title Block object adds a title block based on ISO 7200:
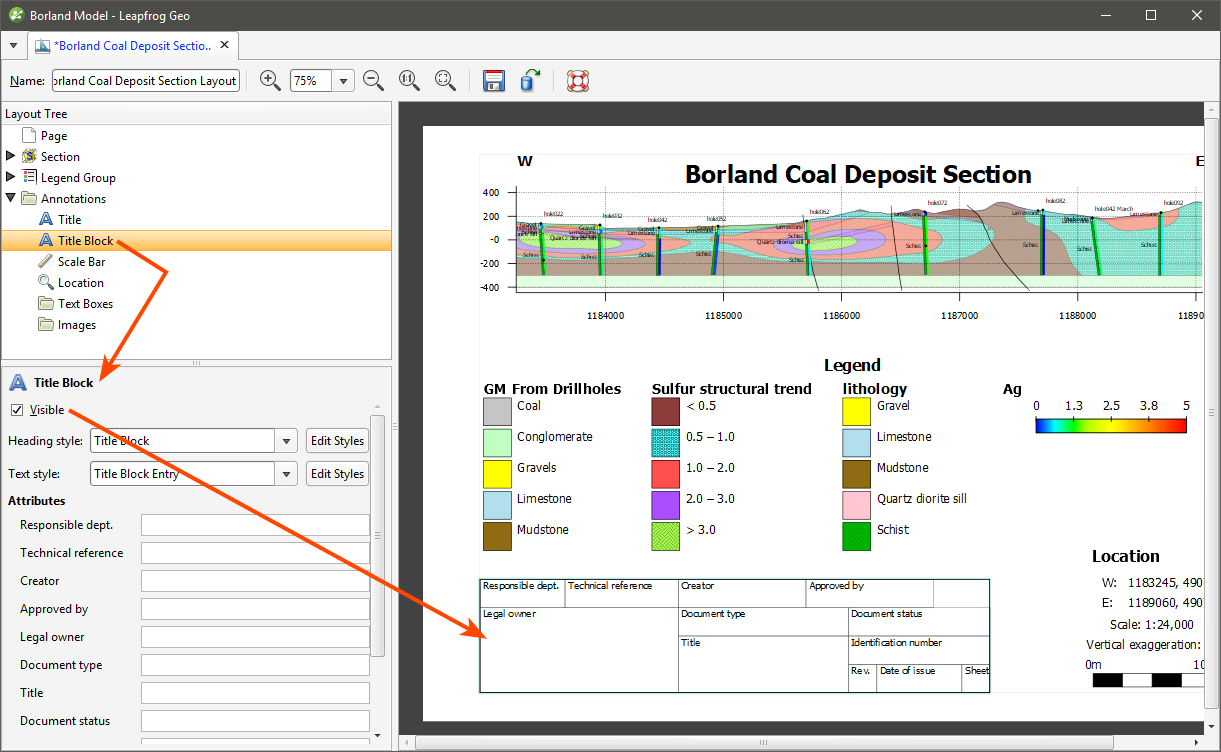
To display the Title Block on the section, select it in the Layout Tree, then tick the Visible box.
Scale Bar
The Scale Bar object controls the size and format of the scale bar. Its position is controlled by moving it in the preview.
Location
The Location object controls how location information is displayed.
Text Boxes
With the Text Boxes object, you can add text boxes and arrows to highlight information and details on the section:
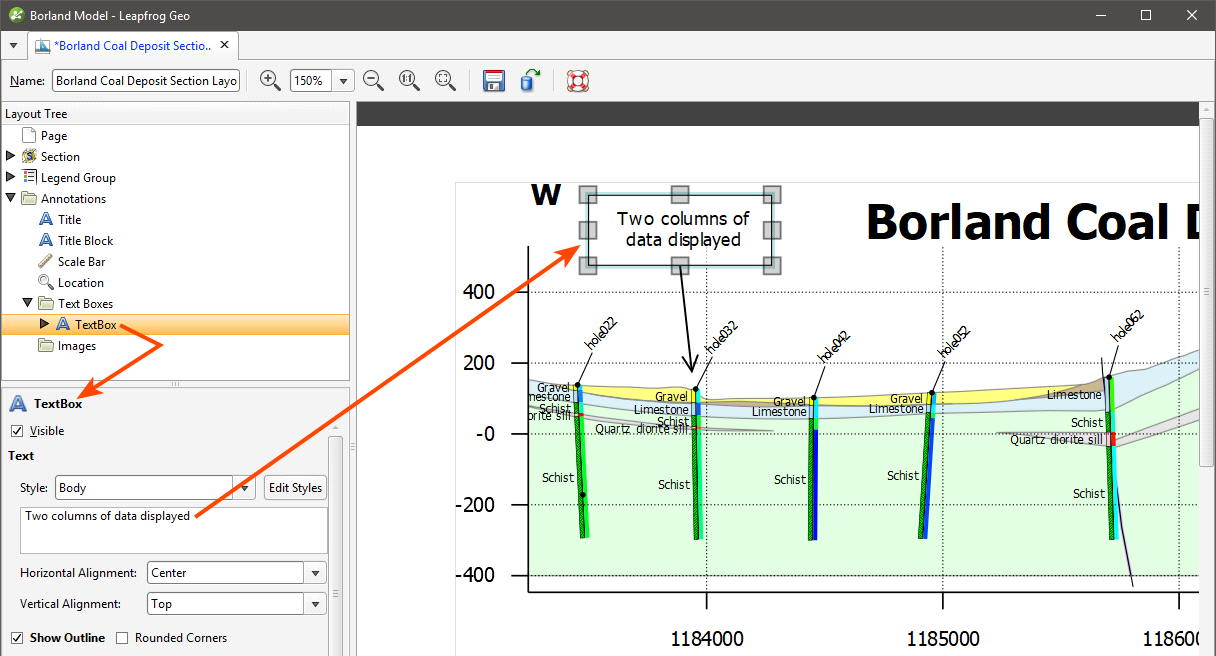
Arrows are connected to text boxes, and so initially only text boxes can be added. Right-click on a text box to add an arrow to it. When the Automatic anchoring option is enabled for an arrow, the arrow’s anchor will move when its associated text box is moved. If this option is disabled, the arrow will move when you move the text box, but you will have to place its anchor manually.
Images
If you wish to import an image such as a logo or map, right-click on the Images object and select Add Image. Navigate to the folder that contains the image file and select the file. Click Open to import the file, which will automatically be added to the section layout.
Displaying Section Layouts
You can display section layouts in the scene. Dragging a layout into the scene displays the layout evaluated on the section:

Some sections will be too large to display in the scene, which will be indicated in the section layout editor.
Displaying section layouts in the scene is useful when you are editing a section layout and wish to see the effect of changes. Detach the section layout tab from the main window and position it adjacent to the scene window. Periodically save your changes to the section layout to see the effects of those changes in the scene.
Exporting Section Layouts
Once you have finished adjusting the section layout, you can export it in one of the following formats:
- PDF Files (*.pdf)
- Scalable Vector Graphics Files (*.svg)
- PNG Image Files (*.png)
- GeoTIFF Files (*.tiff, *.tif)
Click the Save and Export button (![]() ) at the top of the window. You will be prompted for a filename and location.
) at the top of the window. You will be prompted for a filename and location.
Batch Exporting Section Layouts
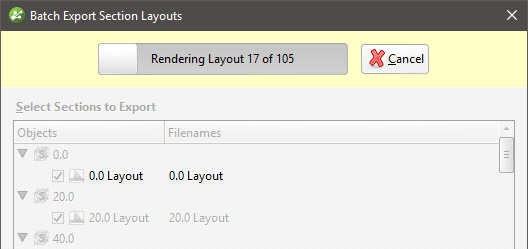
You can export multiple section layouts as a single PDF or individually in the formats shown in Exporting Section Layouts above. To do this, right-click on the Cross Sections and Contours folder and select Batch Export Layouts.
In the window that appears, selection the layouts you wish to export, then select a format. If you select a format other than Single PDF, you can combine all outputs into a zip archive. Select where you wish to save the outputs, then click Export. Progress will be displayed at the top of the Batch Export Section Layouts window:
Copying Section Layouts
If you have already created a section layout and wish to reuse it, you can copy it to other sections.
Copying a section layout copies the evaluations used in the original section layout, together with the page size and orientation and the position of the Layout Tree objects on the page. How models, surfaces and drillholes are copied depends on the section to which the layout is being copied:
- All models and surfaces that can be displayed on the section will be copied.
- The drillholes copied to the layout will depend on the type of section the layout is being copied from and whether or not a filter is set for the layout:
- If no distance filter was set for the original layout, all drillholes selected for the original layout will be copied.
- If a distance filter was applied to the original section, the filter will be applied and drillholes selected that are within that distance of the section to which the layout is being copied.
- When the original layout is from a fence section, drillhole evaluations will not be copied with the section layout.
To copy a layout, right-click on the layout you wish to copy and select Copy Layout To. In the window that appears, a summary of the information that will be copied is displayed so you can see what information will be copied to the selected sections. Move the sections you wish to copy the layout to into the Selected Sections list, then click OK. A copy of the layout will appear in the project tree under each section you selected. The layout copies are not linked to the original layout and so will not be updated when the original is updated.
Copying section layouts to multiple sections can result in numerous section layouts in a project, which can be difficult to work with. The recommended workflow for creating a section layout that you intend to make multiple copies of is to first get the layout right on one section before copying it to other sections.
Got a question? Visit the My Leapfrog forums at https://forum.leapfrog3d.com/c/open-forum or technical support at http://www.leapfrog3d.com/contact/support