Resource Report
The features described in this topic are only available if you are licensed to use Leapfrog EDGE with Leapfrog Geo.
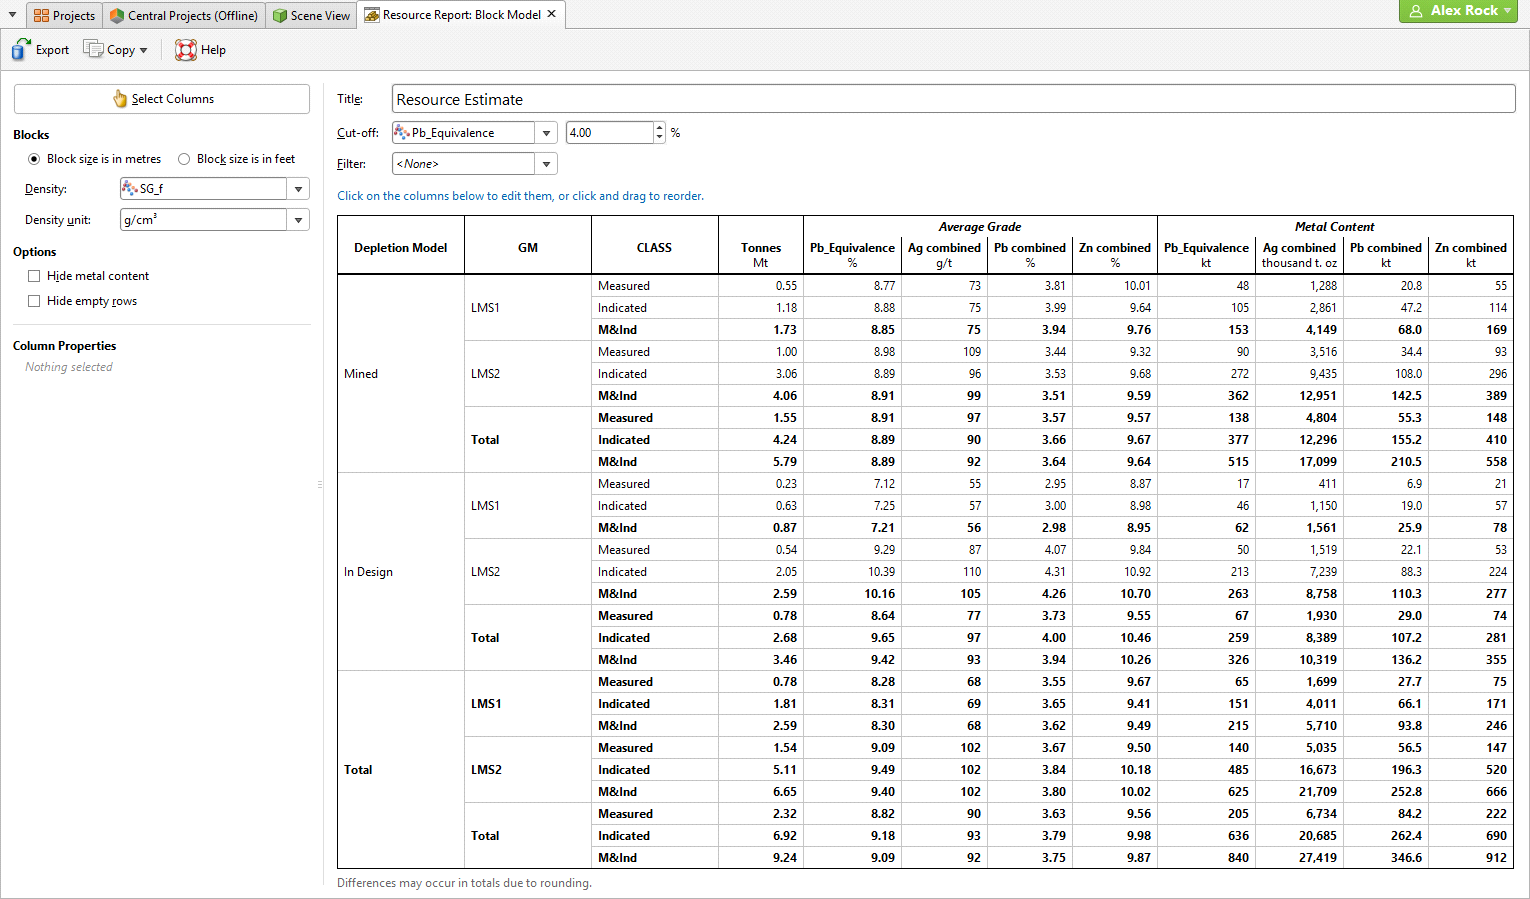
The resource report is a pivot table for reporting on resources and reserves in accordance with standards, with the freedom to customise the table to the unique needs of the project requirements. A resource report can display multiple categories and multiple numeric columns.
To create or view a resource report, right-click on a block model in the project tree and select Resource Report. In the window that appears, click the Select Columns button to choose from the Category and Grade columns evaluated onto the block model. If you wish to set a Cut-off value, select one of the grade columns. You can also apply a Filter to the report.
Select between Block size in metres and Block size in feet to ensure units are correctly converted. Select Constant value from the list of Density options and specify a numeric constant, or select a density data measurement from the numeric columns listed. Specify the appropriate Density unit to match the Density selection.
You can also choose to Hide metal content columns and Hide empty rows.
If you have an estimator that produces outside, blank, without_grade or error statuses for blocks, these will result in #Invalid entries in the resource report table. To address this:
- Create a filter (or modify your existing filter) to discard blocks with an invalid status, and select this filter in the Filter field above the resource report table, or
- Create a calculation that sets invalid values to an appropriate acceptable value, and select this column instead.
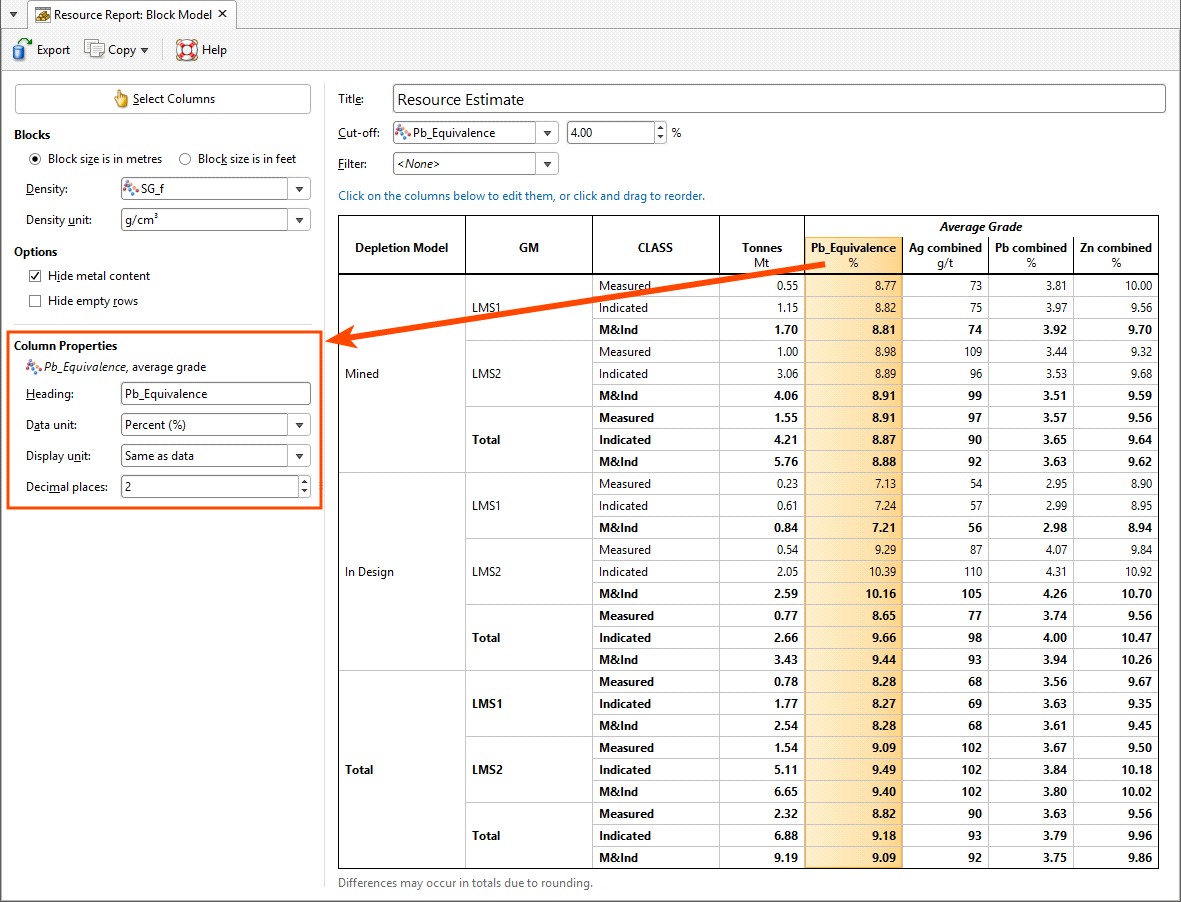
Click on a column to customise how the information is displayed. You can change the column title by editing the Heading field.
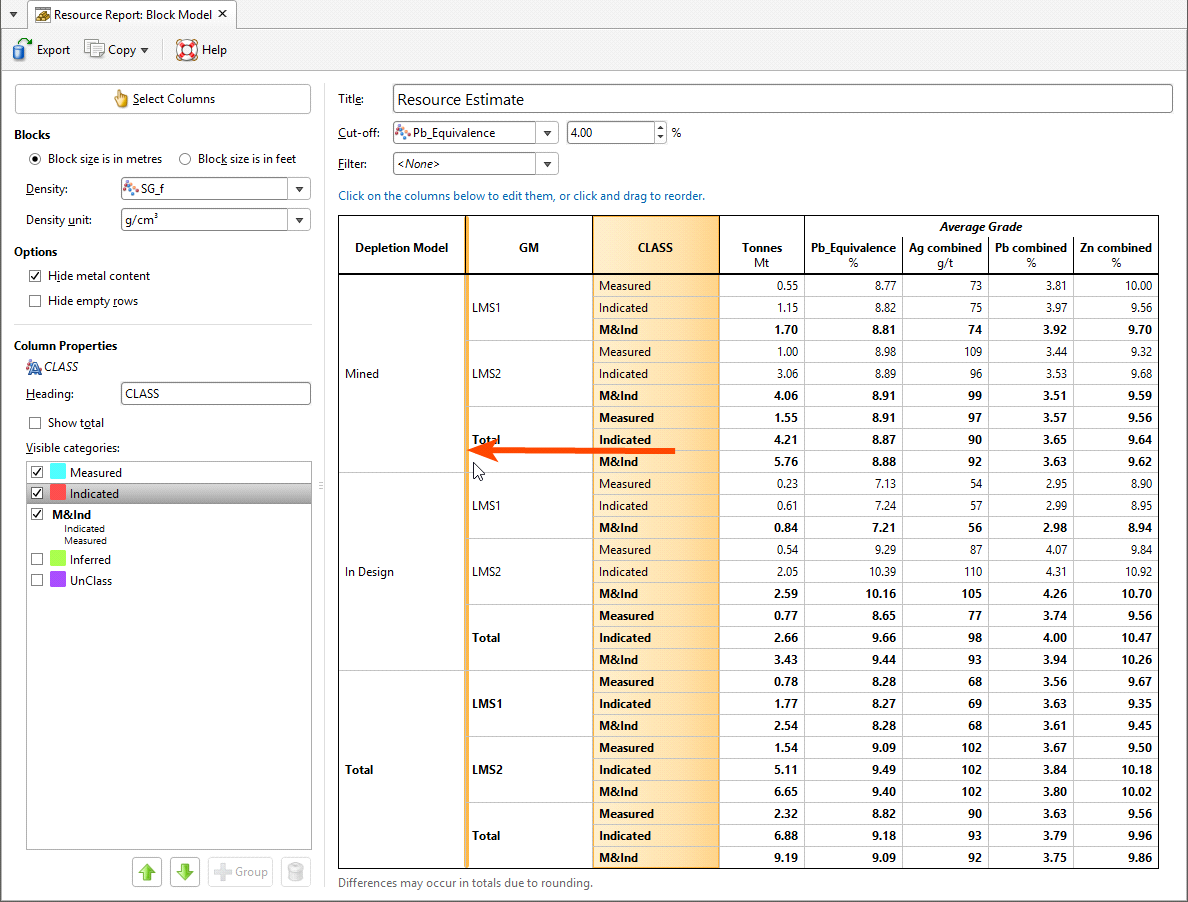
Enabling Show total will add a category row called Total with a summation for the categories. Any row that is a summation of categories will appear in bold in the table. It is possible to get a sub-total of some of the categories by grouping them, and these will also be shown in bold. To group categories, select multiple items in the Visible categories list by holding down the Ctrl key as you click the mouse. Click the Group button to add the new category.
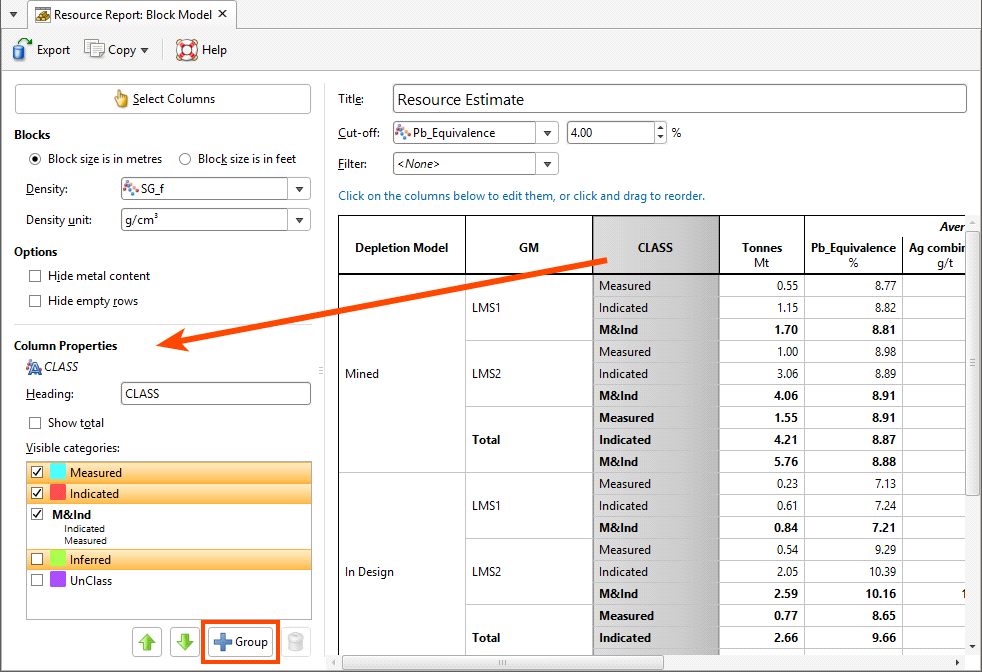
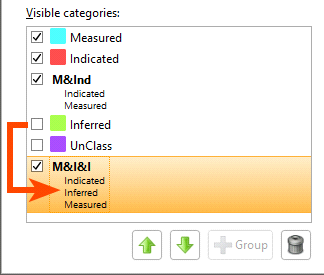
Note that some of the Visible categories can be unticked to hide them; these hidden categories can still be included in a grouped category:
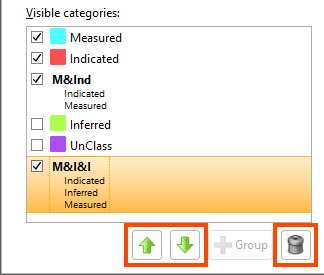
Select a category and click the up or down buttons to reorder them in the list. Delete a grouped category by selecting it and clicking the Delete button (![]() ).
).
If there are multiple category columns, these can be reordered to select one as the primary categorisation, with the others shown as sub-categories. Click anywhere in a category column and drag it to a new location. While you hold down the mouse button, a vertical bar will appear where the column will be inserted:
When Average Grade columns are selected, it is possible to change:
- The Heading
- The Data unit
- The Display unit to use in the table, which may be the Same as data or some other unit to convert to
- The number of Decimal places to display in the table
Metal Content columns can have the Heading changed, as well as the column’s Unit and Decimal places.
The Resource Report tab has Export and Copy options for making use of the report in external documents.
- Select Export to save the table as a Microsoft Excel spreadsheet, a CSV file, or an HTML file. Formatting is preserved in the spreadsheet and HTML file so the table will be arranged identically to the report in Leapfrog Geo. CSV files do not contain formatted data. If you select CSV, you will also be asked if you would like to use the Rounded numbers used in the table, or Full precision numbers. You can also select between ASCII characters only and Allow all characters, with UTF-8 encoding, as required by the software you are exporting to.
- If you select Copy, then Copy Table, the table is copied to the operating system clipboard, and you can paste it into another application such as Microsoft Excel or Microsoft Word. Formatting is preserved so the table will be arranged identically to the report in Leapfrog Geo and only the column and row sizes need to be adjusted to your preferences.
When you close the report, the options you have selected will persist for the next time the report is viewed.
Got a question? Visit the My Leapfrog forums at https://forum.leapfrog3d.com/c/open-forum or technical support at http://www.leapfrog3d.com/contact/support