Sample Geometries
The features described in this topic are only available if you are licensed to use Leapfrog EDGE with Leapfrog Geo.
This topic describes the declustering object available in the Sample Geometry folder. This topic is divided into:
- Creating a New Declustering Object
- The Declustering Object in the Project Tree
- Applying a Declustering Object
The declustering object is a tool for calculating local sample density. It can be used to provide confidence in an estimate, a value for determining boundaries, or a declustering weight that can be used to remove sampling bias from a set of values. Common traditional techniques for declustering utilise a grid or polygonal cells.
In Leapfrog Geo, the declustering object is used to calculate declustering weights that are inversely proportional to the data density at each sample point. A declustering object can be used by an inverse distance estimator.
Creating a New Declustering Object
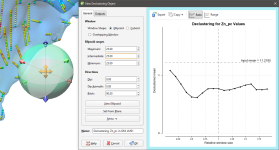
To create a new declustering object, right-click on the Sample Geometry folder and select New Declustering Object. The New Declustering Object window will appear and an ellipsoid will be added to the scene:
The ellipsoid has two sets of handles; click on the ellipsoid to toggle between them. The red, green and blue arrow set on the outer edge is for setting the Ellipsoid Ranges. The yellow, blue and red set of arrows on the outer edge is for setting the Directions.
In the middle will either be another set of red, green and blue arrows for repositioning the widget along the scene axes, or a set of orange arrows for repositioning the widget along the camera’s perspective of the screen plane. Once the declustering object has been created, you will be able to switch between these using the Align movement handles to Axes or Camera options in the properties panel.
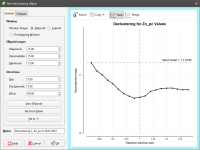
On the right side of the New Declustering Object window is a declustering chart. This is used to guide the selection of settings for the declustering object, particularly the ranges for the search ellipsoid. There are two chart views. The default view, Ratio, shows a chart of the declustered mean against relative window size:
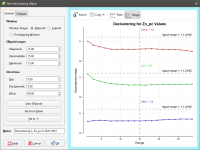
Range shows three declustering charts, one for each axis of the search ellipsoid:
All charts indicate the naïve mean using a dotted horizontal line.
You can interact with the charts by dragging the dotted vertical line to the left or right. In the Ratio view, this changes the current ellipsoid range settings by a proportional ratio, as indicated on the x-axis of the chart. In the Range view, the selected range setting is updated accordingly. Select a place on the chart that minimises the effect of declustering on the mean of the data, where the range is close to the naïve mean and where there is no significant jump in the data.
Changes made to the declustering options are reflected automatically in the selected chart.
Above the chart are some export options. The Export button saves the declustering chart as either a PDF, SVG or PNG file based on your selection. Copy > Copy Graph Image saves an image to the operating system clipboard at the selected resolution. You can then paste the image into another application.
General Settings
The General tab of the New Declustering Object window is divided into three parts, Window, Ellipsoid Ranges and Directions.
The Window section defines the declustering object’s shape:
- The Window Shape can be Ellipsoid or Cuboid. Select Cuboid to approximate traditional grid declustering. The Ellipsoid option avoids increased density values for sampling oriented away from axes.
- The Overlapping Window option acts similarly to a rolling average by moving the window incrementally in overlapping steps, providing a much smoother result.
- Disabling Overlapping Window approximates a traditional grid behaviour; a single fixed window is used around each evaluation location and the density is simply the count of all input points within the window.
- Enabling Overlapping Window implicitly averages the point count over all possible windows that contain the evaluation location.
The Ellipsoid Ranges settings provide the same anisotropy controls used elsewhere in Leapfrog Geo, determining the relative shape and strength of the ellipsoid in the scene. Including them here provides additional advantages over traditional grid declustering.
- The Maximum value is the range in the direction of the major axis of the ellipsoid.
- The Intermediate value is the range in the direction of the semi-major axis of the ellipsoid.
- The Minimum value is the range in the direction of the minor axis of the ellipsoid.
In the scene window, the ellipsoid’s outer red, green and blue handles adjust the Ellipsoid Ranges.
The Directions settings determine the orientation of the ellipsoid in the scene, where:
- Dip and Dip Azimuth set the orientation of the plane for the major and semi-major axes of the ellipsoid. Dip is the angle off the horizontal of the plane, and Dip Azimuth is the compass direction of the dip.
- Pitch is the angle of the ellipsoid’s major axis on the plane defined by the Dip and Dip Azimuth. When Pitch is 0, the major axis is perpendicular to the Dip Azimuth. As Pitch increases, the major axis points further down the plane towards the Dip Azimuth.
In the Scene View, the ellipsoid’s yellow, blue and red handles adjust the Directions.
The moving plane can also be useful in setting the anisotropy Directions. Add the moving plane to the scene, and adjust it using its controls. Then click the Set From Plane button to populate the Dip, Dip Azimuth and Pitch settings.
You can also use the Set to list to choose different from the variogram models available in the project.
To approximate grid declustering, set the Window Shape to Cuboid, disable the Moving Window and set the Maximum, Intermed. and Minimum ranges to be equal values.
Outputs
The Outputs tab of the New Declustering Object window features Attributes to calculate. Value and Status will always be calculated, but you can optionally include NS (number of samples), MinD (distance to closest sample) or AvgD (average distance to sample).
The Declustering Object in the Project Tree
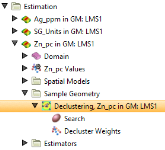
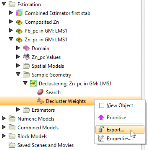
Enter a name for the declustering object and click OK to create it. It will be added to the project tree in the Sample Geometry folder. Expand it to see its parts, which can be individually added to the scene:
Double-click on the declustering object in the tree to edit it.
Export the declustering weights by right-clicking on the values object in the project tree and selecting Export.
Applying a Declustering Object
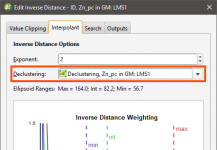
Leapfrog Geo supports declustering in the inverse distance estimator. To decluster data, select a declustering object from the Declustering dropdown list:
When no declustering object is selected, the inverse distance estimator is the standard inverse distance weighted method.
Got a question? Visit the My Leapfrog forums at https://forum.leapfrog3d.com/c/open-forum or technical support at http://www.leapfrog3d.com/contact/support
