Section Layouts
With the Section Layout Editor, you can create a section layout for an existing section and then export the section. You can customise the section layout by:
- Adding models, surfaces and lines the section has been evaluated against
- Adding drillholes and planned drillholes
- Changing the page size, orientation and margins
- Adding titles, a scale bar, legends, annotations and images, such as a standard form or logo
The appearance of all objects can be customised without changing how objects from the project tree are displayed in the scene.
Section layouts can be displayed in the scene by dragging a layout into the scene:

Some sections will be too large to display in the scene, which will be indicated in the section layout editor.
Displaying section layouts in the scene is useful when you are editing a section layout and wish to see the effect of changes. Detach the section layout tab from the main window and position it adjacent to the scene window. Periodically save your changes to the section layout to see the effects of those changes in the scene.
This topic describes how to work with section layouts. It is divided into:
- Setting Up the Section
- Creating New Section Layouts
- Copying Section Layouts
- Working With the Section Layout Editor
- Changing Page Properties
- Changing the Basic Section Properties
- Organising Objects on the Section
- Setting Up the Legend
- Adding and Organising Annotations
Setting Up the Section
Once you have created a section but before you start creating the section layout, take the following steps.
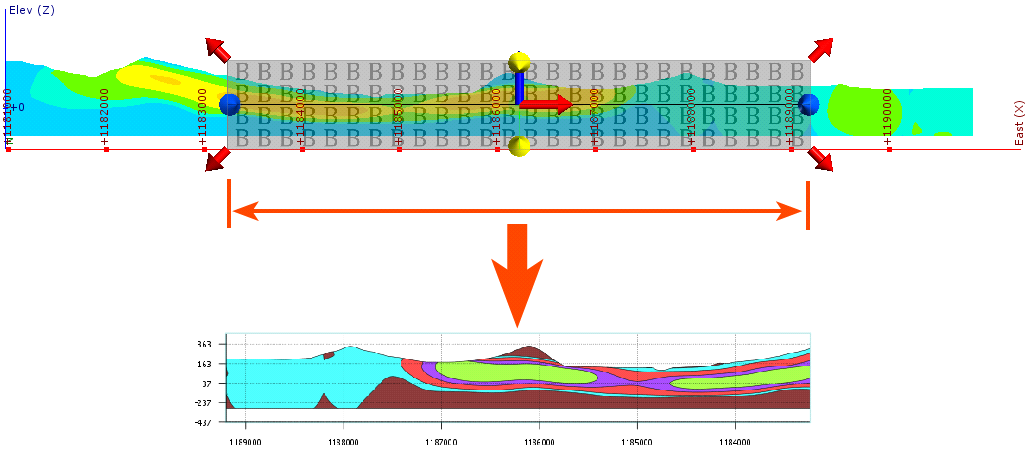
1. Check the section’s extents and orientation.
The initial dimensions of the section on the page are determined by the size of the section plane, and its orientation on the page is determined by the front (F) and back (B) faces of the section plane. Here, the front and back faces of the section have been swapped, which results in the section displayed on the page being flipped:
2. Check that the section has been evaluated against objects you wish to display on the page.
To do this, right-click on the section in the project tree and select Evaluations or Evaluate Surface.
3. Add planned drillholes to the project.
Planned drillholes can be displayed on the section, but these must be defined before you start the process of laying out the section.
Creating New Section Layouts
To create a new section layout, right-click on an existing section in the project tree and select New Section Layout. The New Section Layout window will appear, together with the Section Layout Editor:
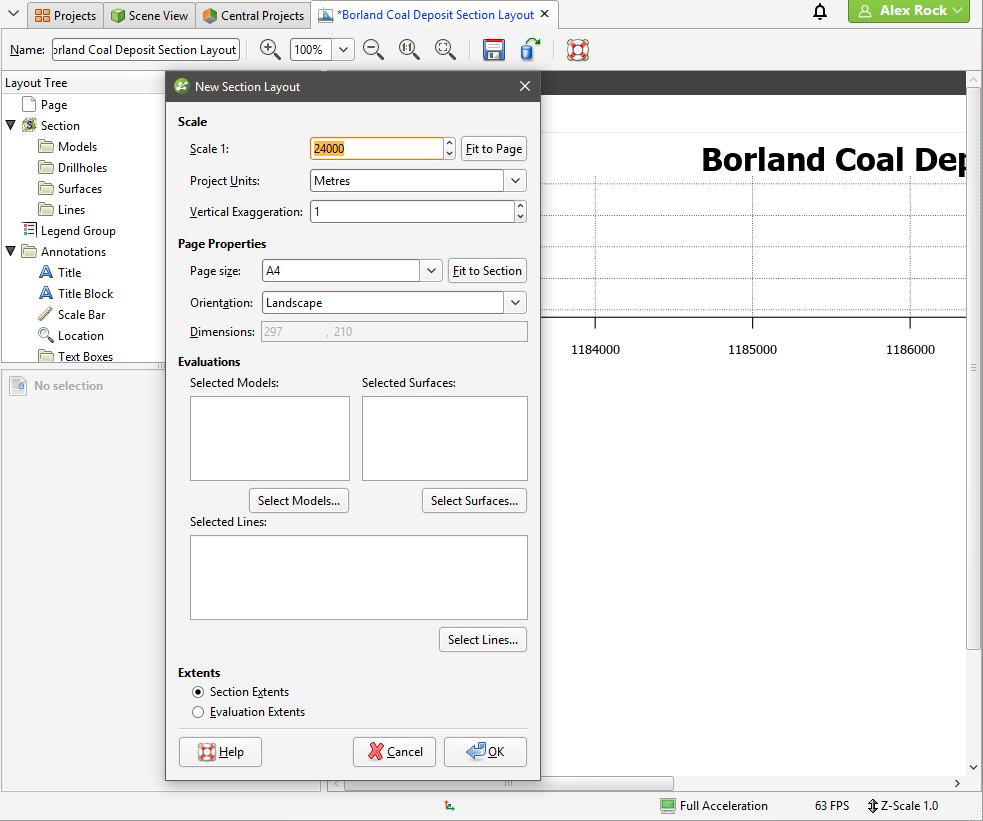
The settings in the New Section Layout window determine the basic section layout:
- The Scale settings determine the scale used to display the section on the page. If you want a specific page size, select Fit to Page to set a scale that best fits the page width. You will be able to change the page margins once you have closed the New Section Layout window.
- The Page Properties settings determine the page size and orientation. If you wish to use a specific Scale, select the Orientation required, then click Fit to Section to choose the best page size.
- For Evaluations, select from the models, surfaces and lines the section has been evaluated against. When you select an evaluation, it will be added to the preview.
- For Extents, choose whether to use the Section Extents or Evaluation Extents. If you wish to use the extents from a model evaluation, add only that model to the Models, Surfaces or Lines list, then select the Evaluation Extents option. Once you have closed this window, you will be able to add further models, surfaces and lines using the section layout editor.
As you change settings and add objects to the section, the preview in the Section Layout Editor window will be updated. All settings in the New Section Layout window can be changed once the layout has been created.
Click OK to close the New Section Layout window. You can then make further changes to the page layout in the Section Layout Editor. See Working With the Section Layout Editor.
Copying Section Layouts
If you have already created a section layout and wish to reuse it, you can copy it to other sections.
Copying a section layout copies the evaluations used in the original section layout, together with the page size and orientation and the position of the Layout Tree objects on the page. How models, surfaces and drillholes are copied depends on the section to which the layout is being copied:
- All models and surfaces that can be displayed on the section will be copied.
- The drillholes copied to the layout will depend on the type of section the layout is being copied from and whether or not a filter is set for the layout:
- If no distance filter was set for the original layout, all drillholes selected for the original layout will be copied.
- If a distance filter was applied to the original section, the filter will be applied and drillholes selected that are within that distance of the section to which the layout is being copied.
- When the original layout is from a fence section, drillhole evaluations will not be copied with the section layout.
To copy a layout, right-click on the layout you wish to copy and select Copy Layout To. In the window that appears, a summary of the information that will be copied is displayed so you can see what information will be copied to the selected sections. Move the sections you wish to copy the layout to into the Selected Sections list, then click OK. A copy of the layout will appear in the project tree under each section you selected. The layout copies are not linked to the original layout and so will not be updated when the original is updated.
Copying section layouts to multiple sections can result in numerous section layouts in a project, which can be difficult to work with. The recommended workflow for creating a section layout that you intend to make multiple copies of is to first get the layout right on one section before copying it to other sections.
Working With the Section Layout Editor
In Section Layout Editor, the Layout Tree shows the different layers that can be added to the page. The different parts of the Layout Tree as they relate to the page preview are shown below:

When you select an object in the layout tree, it will be highlighted by a blue line on the page. In the example above, the Section object is selected.
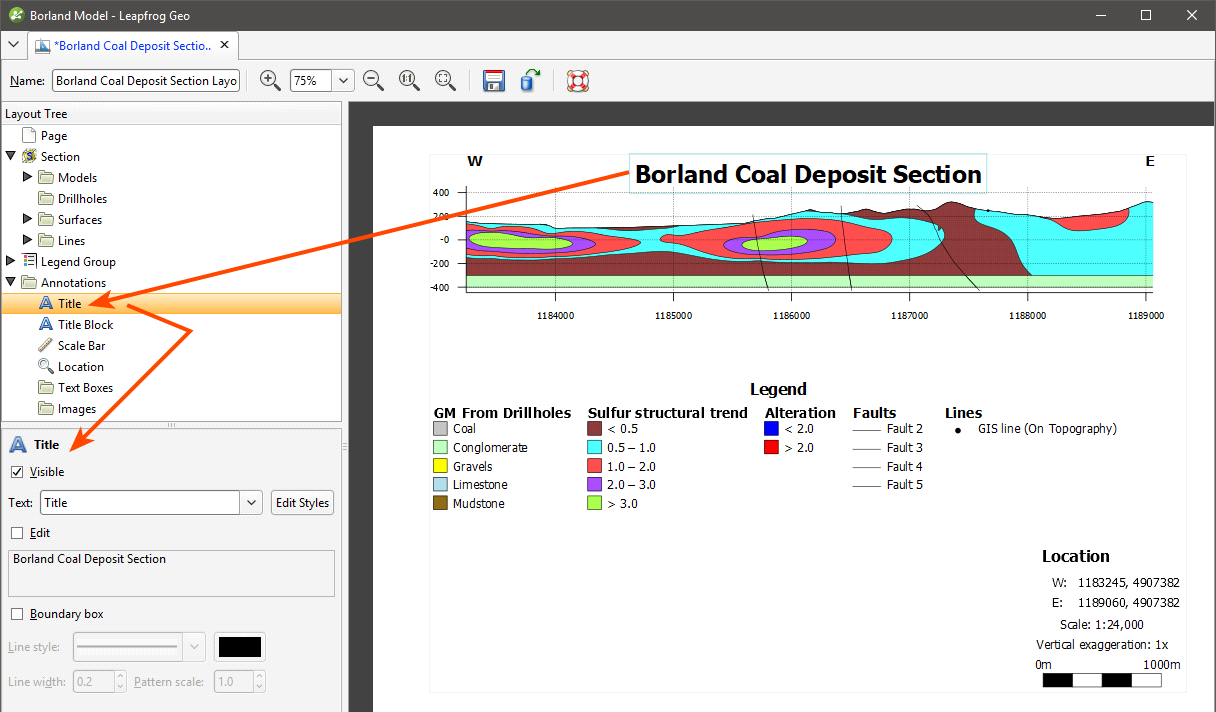
Click on an object in the page preview to move or resize it. This will also select the object in the Layout Tree and you can see what properties can be changed. For example, in the preview, click on the Title to view its styling options:
Text displayed in the section layout is controlled by a style sheet that can be accessed whenever you are editing a text object. For example, clicking on Edit Styles for the Title opens the list of Text Styles with the Title selected, but also allows you to change the appearance of styles used for other text objects visible in the preview:

Changing Page Properties
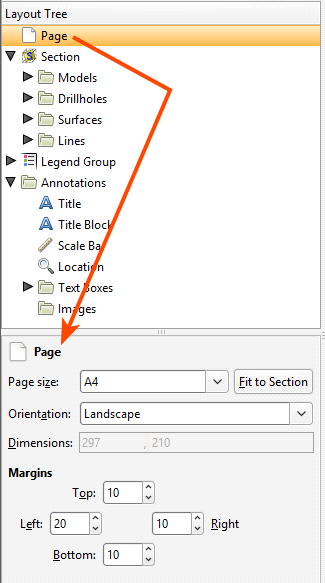
In the Layout Tree, click on Page to change the Page Size, Orientation and Margins:
If you wish to use a specific Scale, select the Orientation required, then click Fit to Section to choose the best page size.
Changing the Basic Section Properties
To change the section layout’s basic properties, click on the Section object in the Layout Tree. In the Section tab, you can change the scale and units used in the layout and the amount of Vertical Exaggeration:
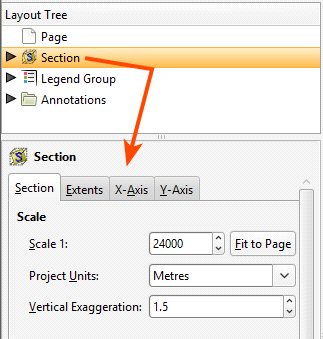
For the Scale, you can enter a specific value to use in displaying the section on the page, or, if you want a specific page size, select Fit to Page to set a scale that best fits the page width.
If you want to change the page size and the margins used, click on the Page object.
To change the size of the section contents (models, drillholes, surfaces and lines) on the page, click on the Extents tab:
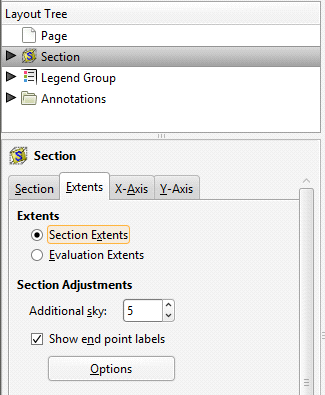
For Extents, choose whether to use the Section Extents or Evaluation Extents.
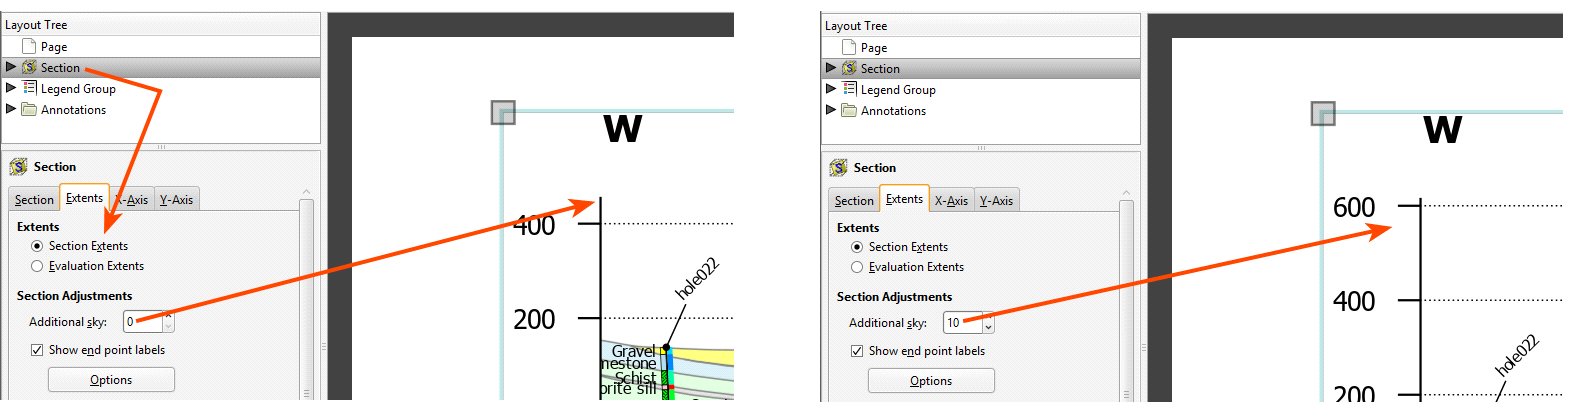
You may wish to add more space above the section, especially if you will be adding drillholes to the section and need extra space for the collar labels. To do this, change the Additional sky setting. These images show the effects of two different Additional sky settings:
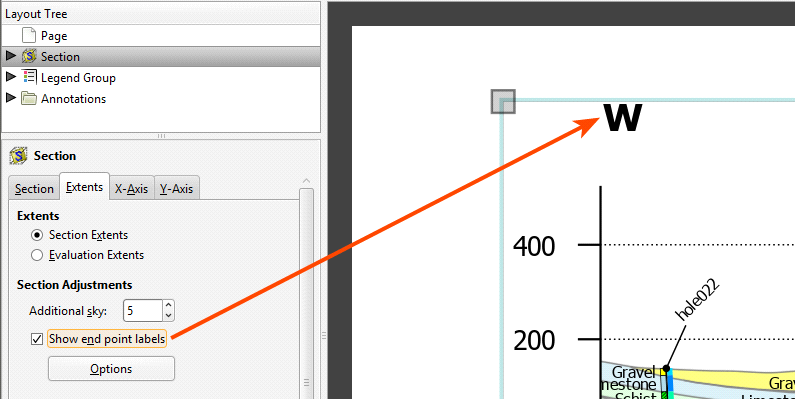
Enable Show end point labels to display the section’s end points as text:
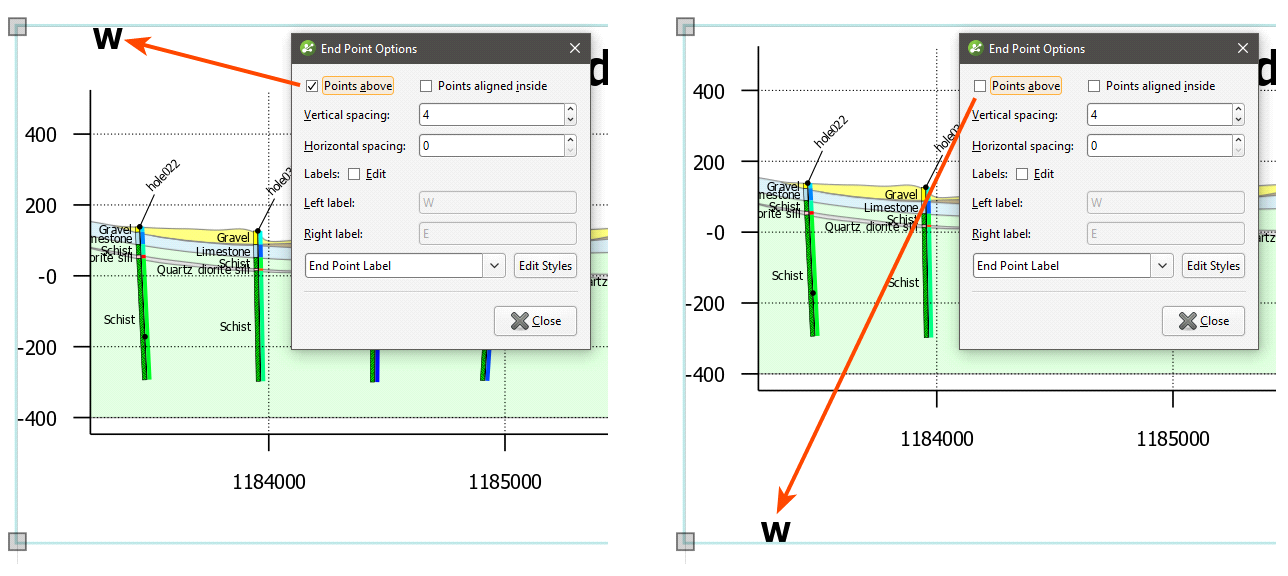
Click Options to change how the end points are displayed relative to the section’s axes. There are two options that control where the end points are displayed, Points above and Points aligned inside. The Points above setting determines whether the end points are displayed above or beneath the axes. Note here the difference between Points above being disabled and enabled:
The Points aligned inside setting determines whether the end points are displayed inside or outside the section’s axes:

You can also change the spacing between the end point labels and the section axes.
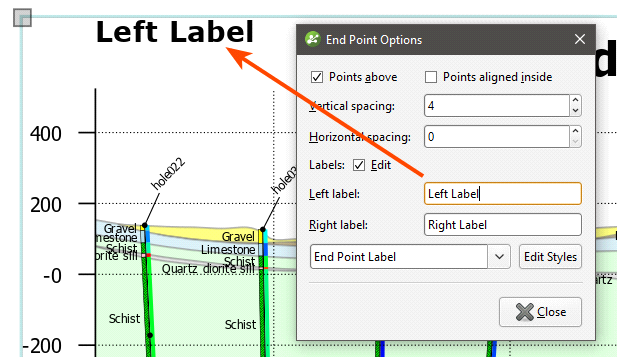
Edit the text used to display the end points by enabling the Edit box and then changing the text. You can edit the style used for displaying the labels by clicking Edit Styles to change the style or by selecting a different style from the dropdown list.
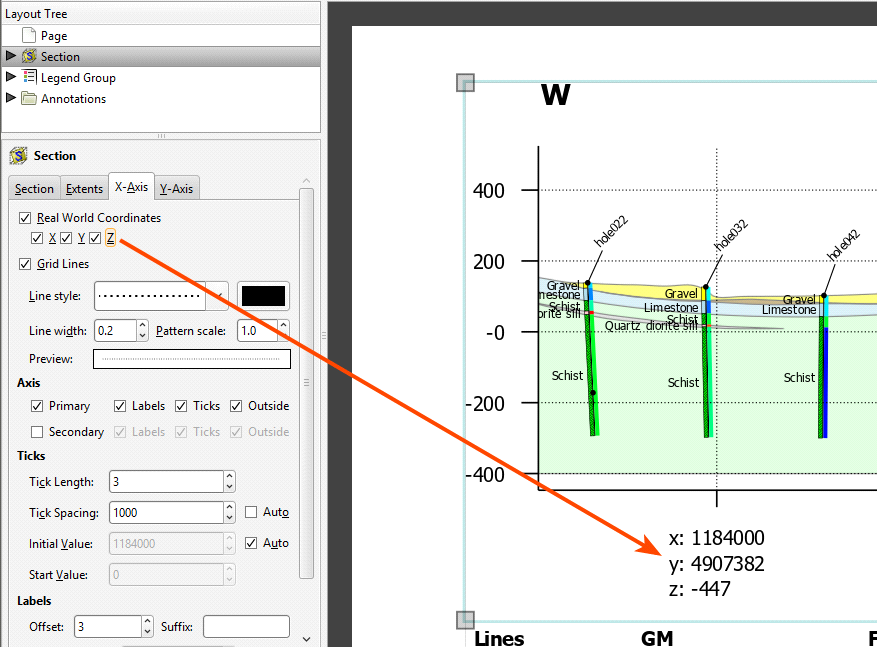
To change how the axes are displayed, click on the either the X-Axis tab or the Y-Axis tab. One of the options available for the axes is how much information is displayed for the Real World Coordinates on each axis:
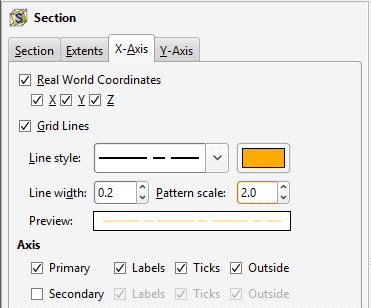
You can also change how Grid Lines are displayed, including the Line style, Line width, Pattern scale and colour. A Preview is displayed and the grid lines are updated in the section preview.
By default, the axes are displayed only on the left-hand side and along the bottom of the section. To display axes along the right-hand side and above the section, tick the Secondary option.
For the Ticks, Leapfrog Geo automatically calculates an Initial Value:
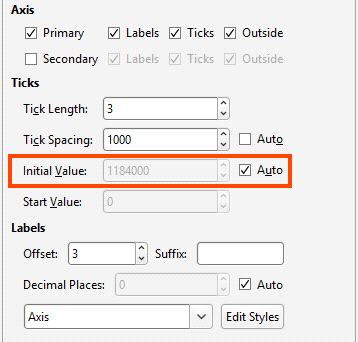
If you wish to change this, disable Auto and enter the required value.
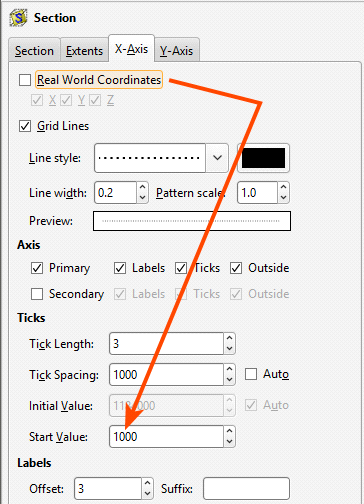
If you wish to set an X-axis Start Value other than 0, you must first disable the Real World Coordinates option:
Edit the style used for displaying the axis labels by clicking Edit Styles to change the style or by selecting a different style from the dropdown list.
Organising Objects on the Section
The folders below the Section object are used to add and organise models, drillholes, surfaces and lines and to customise how they are displayed:

If you selected models, surfaces and lines when you created the section, they will appear in one of these folders. You can add new objects by right-clicking on a folder and selecting an Add option:
- For the Add Model, Add Surface and Add Line options, you will be able to choose from the objects that have been evaluated on the section. See Evaluating on Sections for more information.
- For the Drillholes folder, there are two options, Add Drillholes and Add Planned Drillholes. For both options, you can choose from the drillholes and planned drillholes available in the project; it is not necessary to evaluate these onto the section before you can add them to the layout.
Models, drillholes, surfaces and lines occupy the same space on the section layout, and opacity settings and an object’s position among the layers can be used changed to emphasise relevant information. To change the order of objects on the page, right-click on them and select an option:

Models will always be among the lower layers, with lines on top of all the other layers.
You can remove objects from the layout by right-clicking on them and selecting Delete.
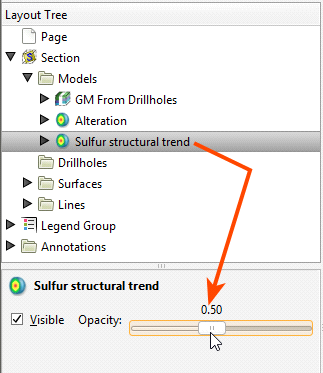
To change the opacity of an object, click on it, then adjust the object’s Opacity using the slider:
Adding and Styling Models
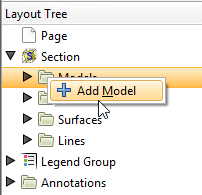
The Models folder contains all models that have been added to the section layout. To add another model, first make sure it has been evaluated on the section, then right-click on the Models folder and select Add Model. Select from those available and click OK.
When you display multiple models on the section, you can end up with a large number of objects that obscure the information you want to emphasise. You can:
- Use the Opacity setting for each model to expose and emphasise information.
- Right-click on the models to move them up or down in the layer hierarchy.
- For geological models, numeric models and combined models, expand the model in the Layout Tree to change how each output volume is displayed. You can also hide some of the output volumes.
- For flow models and block models, you can hide categories or filter the values used to display the model.
If a geological model with an active fault system is added to the section layout, it will include a Fault System that contains all the active faults in the model. Click on the Fault System to control whether or not it is Visible and to set is Opacity:
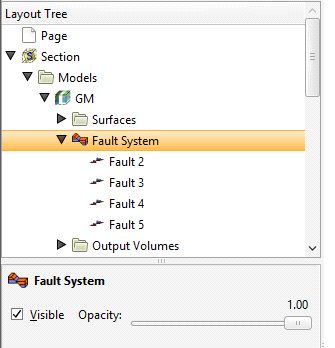
Click on the individual faults to control how they are displayed:

Edit the fault’s Description by enabling the Edit box and then changing the text. You can also change how the fault is displayed, including the Line style, Line width, Pattern scale and colour. You can also define a marker to display along the line by enabling Add marker and then specifying a Symbol to use. A Preview is displayed and the fault will be updated in the section preview:

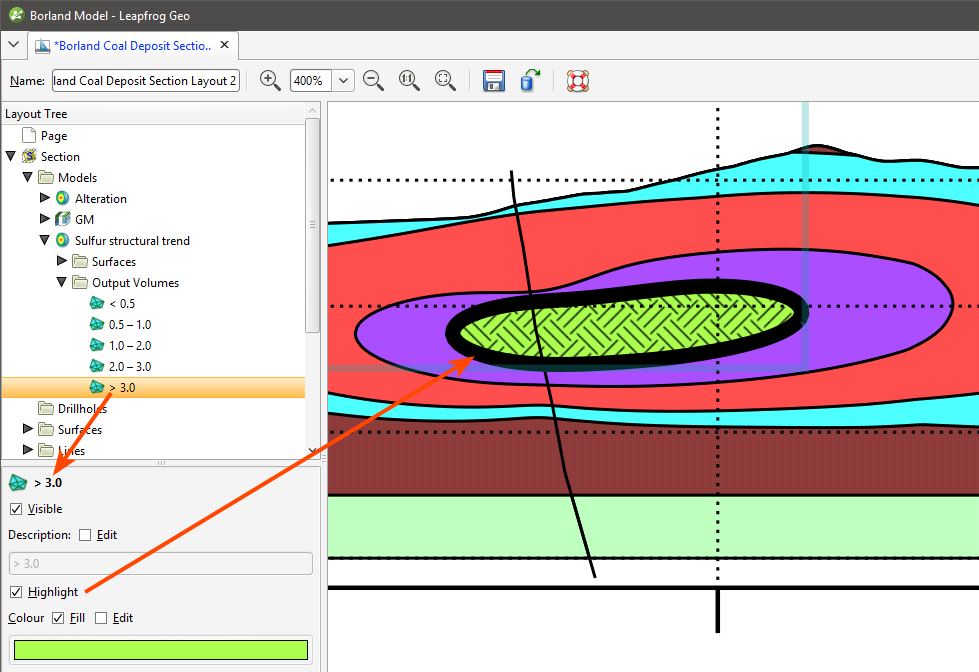
For the volumes in the Output Volumes folder, line, border and swatch properties by clicking on the volume in the Layout Tree and then changing their properties. Swatches for output volumes can be displayed using a hatched fill. To do this, click on the volume, enable the Hatch option and click on the sample to view the available patterns:

A single line style is used to display a model’s output volumes. There is, however, a Highlight option that can be enabled to make a volume of interest stand out from the other volumes:
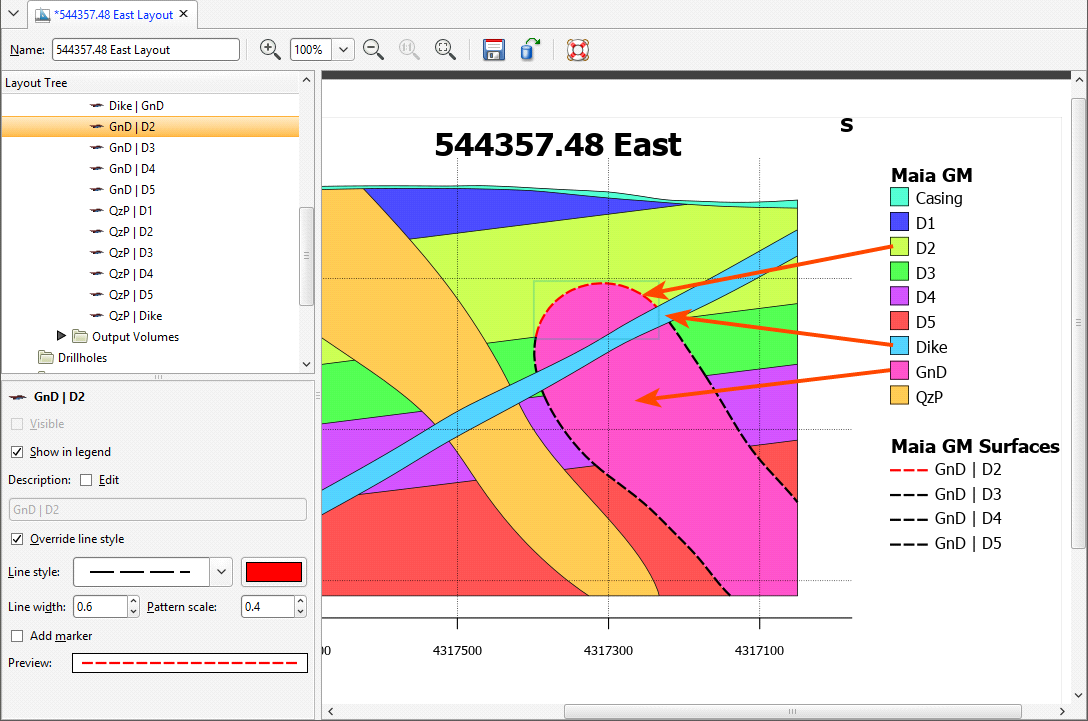
Another way to emphasise a particular volume is to use the surfaces in the model’s Surfaces folder. This folder contains a single surface for every contact with the section, rather than a single surface for each contact surface in the model:

It can result in a large number of surfaces to work with, but does provide you more control over how these surfaces appear on the section layout. For example, here the outline of the GnD volume can be shown in different styles (as with the D2 contact) or not at all (as with the Dike contacts):
You can display a contact surface on a section layout as a surface evaluation, but you can have only one line style and you don’t have control over what parts of the surface are displayed. For example, you cannot hide the surface where it is intersected by the dike:

Flow models and block models appear in the Models folder as a single object. They can be displayed using a flat colour or any of the Colouring options available for the model:

Click Options to change the colours used to display the model:
- For category evaluations, you can change what categories are visible and the colours used to display them.
- For numeric evaluations, you can filter values and use a different colourmap.
For example, here, a MODFLOW model is displayed using the Colouring from an evaluated geological model:
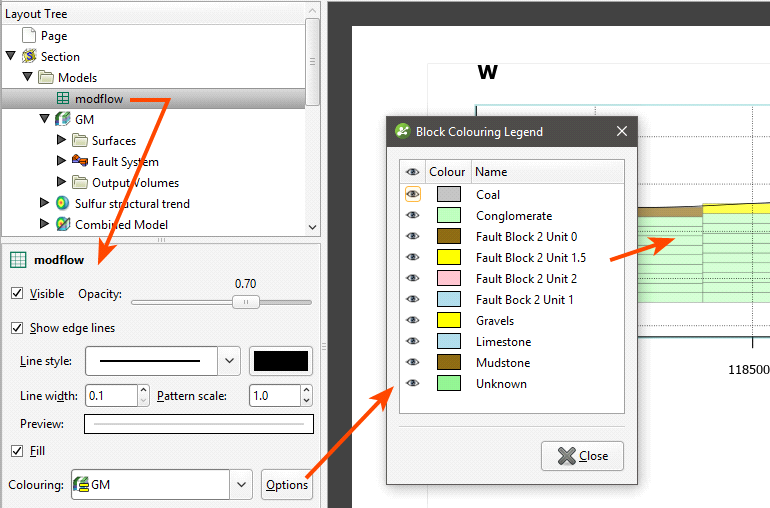
The colours used to display categories cannot be changed in the Block Colouring Legend as they are the colours used by the evaluated model itself. You can, however, hide some categories so they are not displayed on the section layout.
Here, the MODFLOW model is displayed using the Colouring from an evaluated numeric model:
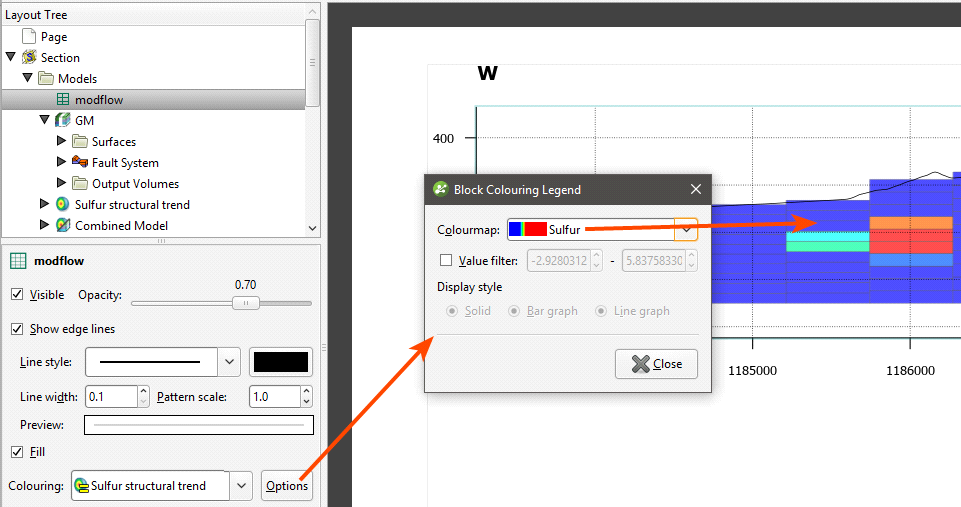
You can change the Colourmap used to display the model on the section and you can filter the values displayed.
If a block model or flow model is too big for the section layout, changing the section extents or the section layout extents will effectively “crop” the model and make it small enough to display on the section layout. There are two ways to do this:
- Change the section layout extents by clicking on Section in the Layout Tree, then clicking on the Extents tab. If Extents is set to Evaluation Extents, change it to Section Extents.
- Change the size of the section by double-clicking on it in the project tree and then editing its dimensions in the scene.
Adding Styling Drillholes and Planned Drillholes
The Drillholes folder contains all drillholes and planned drillholes that have been added to the section layout. Up to three columns of data can be displayed, and numeric data can be displayed as a graph.
To add drillholes to the section, right-click on the Drillholes object and select either Add Drillholes or Add Planned Drillholes.
For adding drillholes, you will be prompted to select the interval table to display.
For both drillholes and planned drillholes, you can filter the drillholes based on a minimum distance from the section plane:

This is the minimum distance to any point on each drillhole trace.
If you tick the Clip geometry to filter distance option, only parts of the drillhole within the filter distance will be included in the section layout. Select the required drillholes and click OK.
When drillholes and planned drillholes are added to a curved section, a projection is made based on the locations of neighbouring segments of the section, using the bisectors of the angles between each segment and its neighbour. These determine the projection point of origin for a given segment of the section. When drillholes are filtered by the distance to the section plane, the distance is measured at 90 degrees from the section. Some drillholes may report a distance that is greater than the specified minimum distance; if this is the case, it is because the evaluation distance is relative to the projection origin.
On the inside of a tight corner, a single drillhole may be projected multiple times onto the section. If this is the case, the multiple instances of the drillhole will appear in the boreholes list and you can turn individual instances off, if required.
When a fence section is updated, drillhole evaluations are updated. If there are multiple instances of a drillhole evaluation, how they appear on the section may change when the section is updated:
- If all instances of a drillhole evaluation have been enabled, then all remain enabled when the section is updated.
- If all instances of a drillhole evaluation have been disabled, then all will remain disabled when the section is updated.
- If only some instances of a drillhole evaluation have been enabled, then all instances will be enabled when the section is updated.
When a section layout is copied to another section from a fence section, drillhole evaluations will not be copied with the section layout.
You can have the following type of labels at different points along the drillhole trace: top labels, intercept labels, bottom labels and depth markers. To hide or change the appearance of drillhole labels, click on the drillhole table, then on the Points and labels tab. Click Options to change how the labels are displayed. You can rotate labels and have a line connecting the label to the collar:
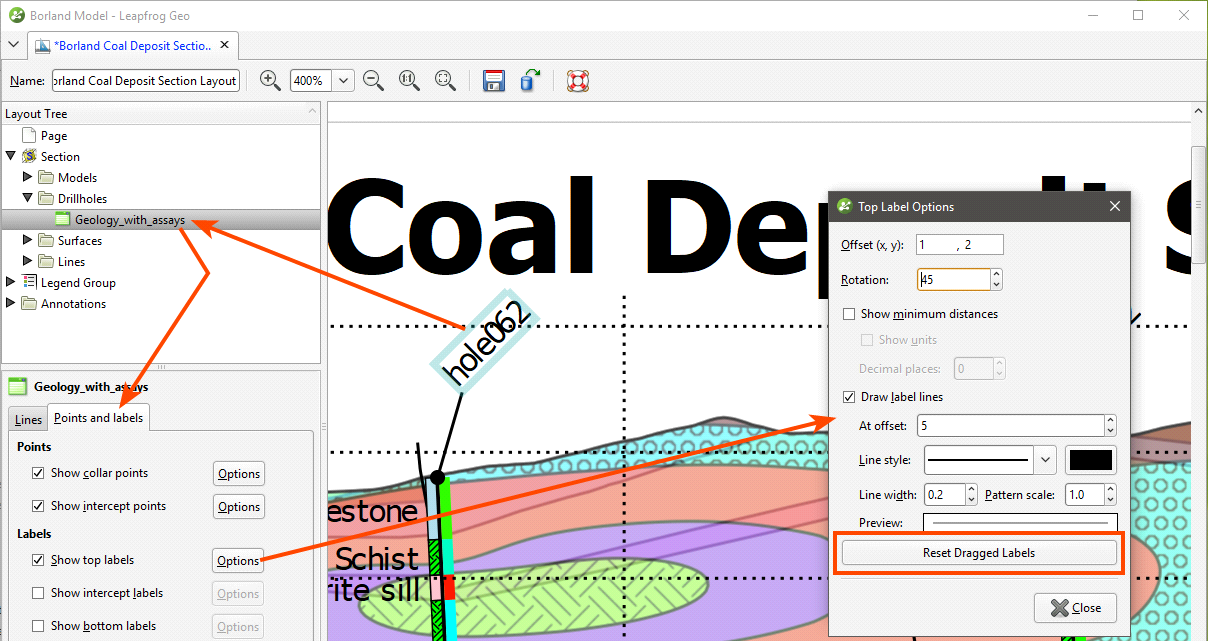
You can also click on the labels in the layout and move them. Note that the label lines will only appear once the drillhole label has been moved away from the collar.
If you want to return all labels to their default positions, click Reset Dragged Labels in the Points and Labels > Label Options window.
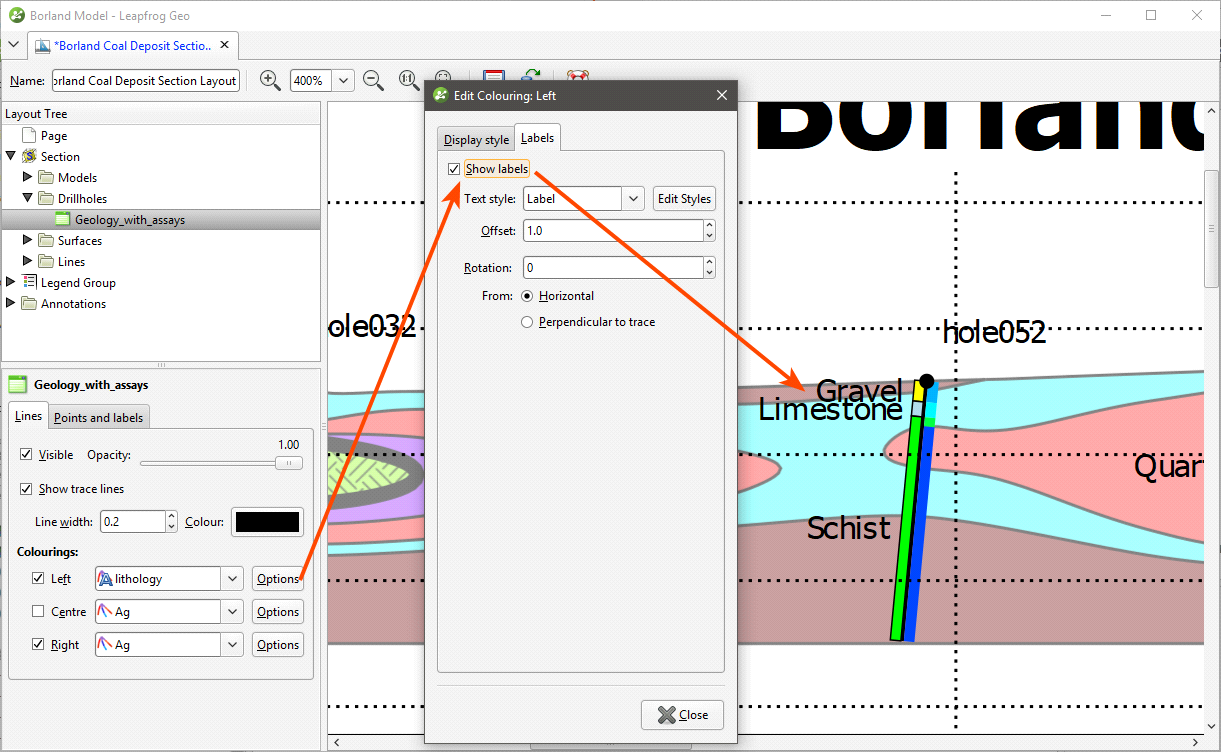
How drillholes are displayed is controlled by the Colourings settings in the Lines tab:
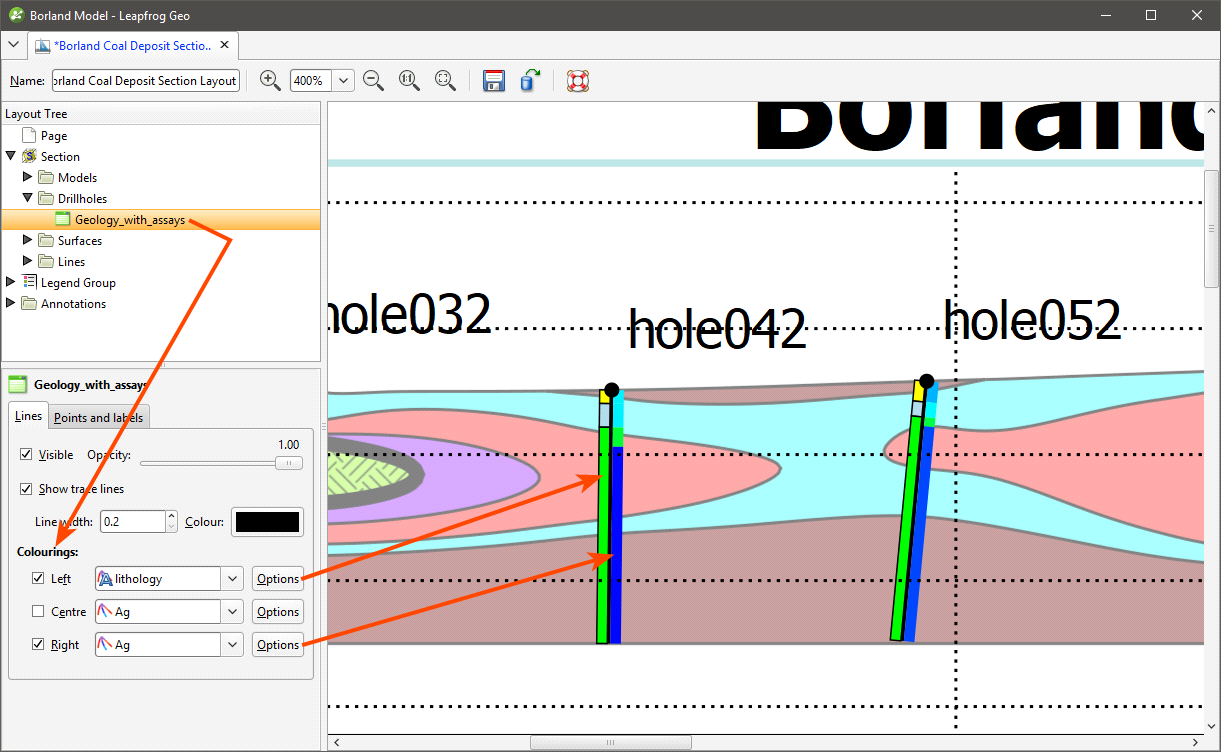
Click the Options button to display data (category data) or filter values (numeric data) on the drillholes:
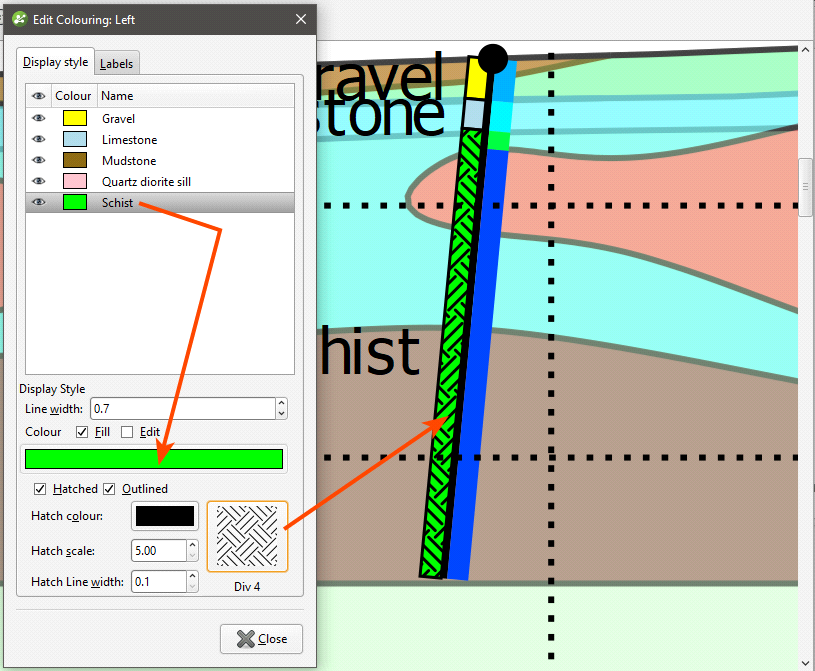
Drillholes can be displayed using hatching patterns. In the Display style tab, tick the Hatched option, then select from the patterns available:
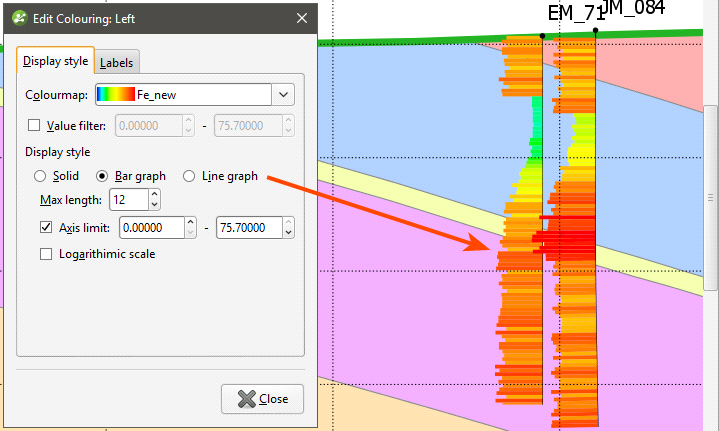
For columns of numeric data, you can display data as a bar graph or line graph. These options are available in the Display style tab. Here, data is displayed as a bar graph:
Select a Max length that means that displayed data does not interfere with other drillholes or data displayed on the section layout. This is especially useful when two graphs are displayed:

If you only want to plot a limited range of data, tick the Axis limit box and set the required range.
Displaying data with the logarithmic scale enabled may enhance differences in the values, and negative values can be scaled.
The bar and line graph options are not available for the centre of the drillhole, although the solid option can be used.
Adding and Styling Surfaces
The Surfaces folder contains all surfaces that have been added to the section layout. To add another surface, first make sure it has been evaluated on the section, then right-click on the Surfaces folder and select Add Surface. Select from those available and click OK.
Click on the surface in the Layout Tree to view styling options:
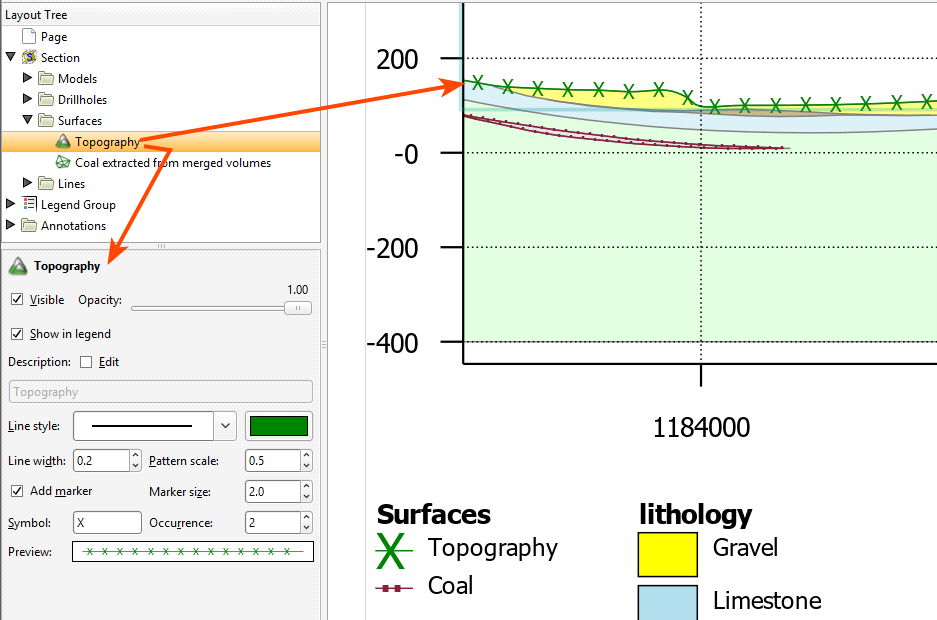
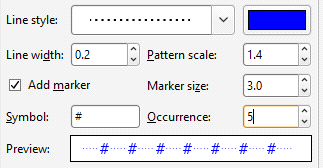
Edit the text used to display the surface by enabling the Edit box and then changing the text. You can change the Line style, Line width, Pattern scale and colour. You can also define a marker to display along the line by enabling Add marker and then specifying a Symbol to use. A Preview is displayed and the surface will be updated in the section preview.
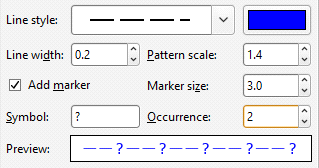
You can see below how changes to the Line style, Symbol and Occurrence can be used to indicate different conditions:
|

|
|
|
|
|
Adding and Styling Lines
The Lines folder contains all lines that have been added to the section layout. To add another line, first make sure it has been evaluated on the section, then right-click on the Lines folder and select Add Line. Select from those available and click OK.
Click on the line in the Layout Tree to view styling options, including the size, shape and colour of the pierce point:

Setting Up the Legend
The Legend Group and the individual legends underneath it control how the legend is displayed on the page.

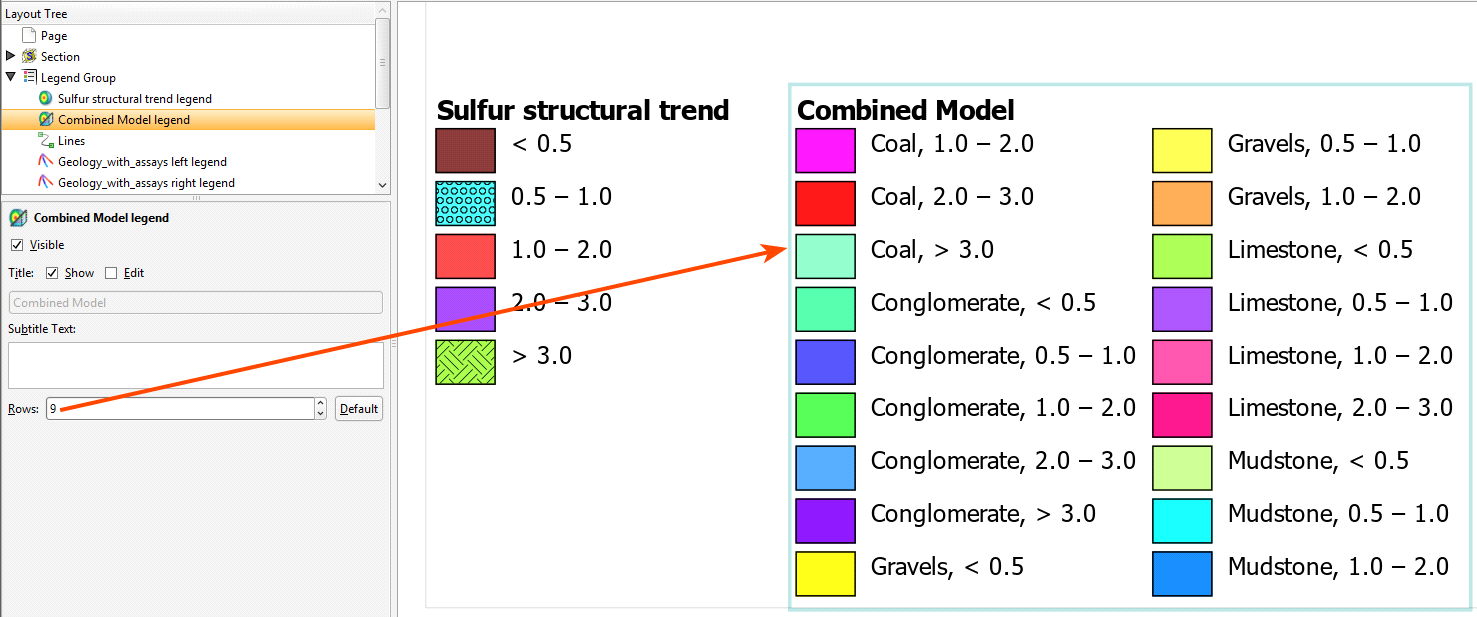
Click on the Legend Group object to change the layout of the legend as a whole:

Columns can be laid out vertically or horizontally, and you can also change the swatch size and gradient and add a Boundary box. For individual legends that have a large number of entries, you may need to increase the number of rows. For example, for the combined model, the number of rows has been increased to accommodate the number of entries in the legend:
When you have multiple models, surfaces, lines and drillholes on the section layout, you can end up with a large number of entries in the Legend Group. How you hide a legend in the Legend Group depends on the type of object. Objects displayed on the section layout appear in the Legend Group as follows:
- Each model on the layout has an individual entry. Hide a model in the Legend Group by clicking on the model’s entry and disabling the Visible option.

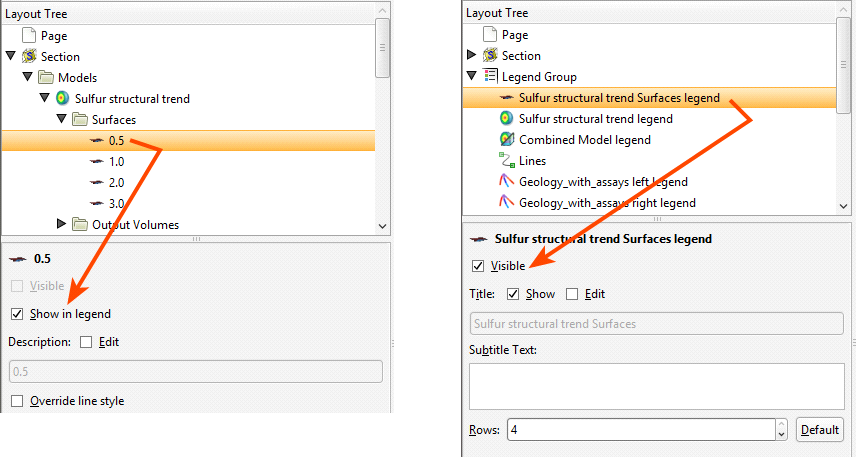
- Each geological model, numeric model and combined model has a Surfaces folder, which will have its own entry in the Legend Group when at least one surface in that folder has been set to Show in legend. The surfaces legend for a model itself can be hidden in the Legend Group by clicking on the entry and disabling the Visible option:
- Each drillhole column that appears on the section has an individual entry. Hide a column in the Legend Group by clicking on the column’s entry and disabling the Visible option:

- Planned drillholes that appear on the section do not appear in the Legend Group.
- Surfaces in the Section > Surfaces folder appear in the Legend Group as a single entry. Hide a surface in the Legend Group by clicking on the surface in the Surfaces folder and disabling theShow in legend option:

- Lines in the Section > Lines folder appear in the Legend Group as a single entry. Hide a line in the Legend Group by clicking on the line in the Lines folder and disabling theShow in legend option:

The order in which legends appear in the Legend Group is the order in which they appear in the Layout Tree. To change the order in which the legends appear, right-click on them and select a Move option.
The colours, line widths, fills and hatches displayed in the Legend Group are controlled by the objects themselves. For example, to change how a shell is displayed for the interpolant, click on the output volume, under the Models object:

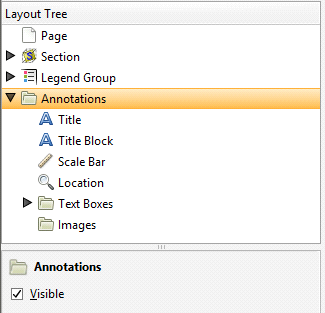
Adding and Organising Annotations
Once you have laid out the main Section object and organised the Legend Group, you can add a number of different types of annotation to the layout, including a title, a title block, location information and a scale bar, text boxes and imported images.
Displaying a Title
The Title object formats the title displayed on the page. To move the title, click on it in the layout preview. The text used for the Title is the name for the section in the project tree, but this can be changed in the properties panel. Enable the Edit option, then edit the text in the box:
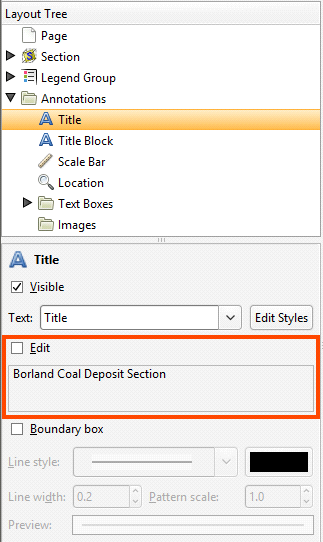
You can display a line around the Title by enabling the Boundary box option. You can customise the Line style, Line width, Pattern scale and colour of the box. A Preview is displayed and the boundary is updated in the section preview.
Displaying a Title Block
When the Title Block is visible, a title block based on ISO 7200 is displayed on the layout:
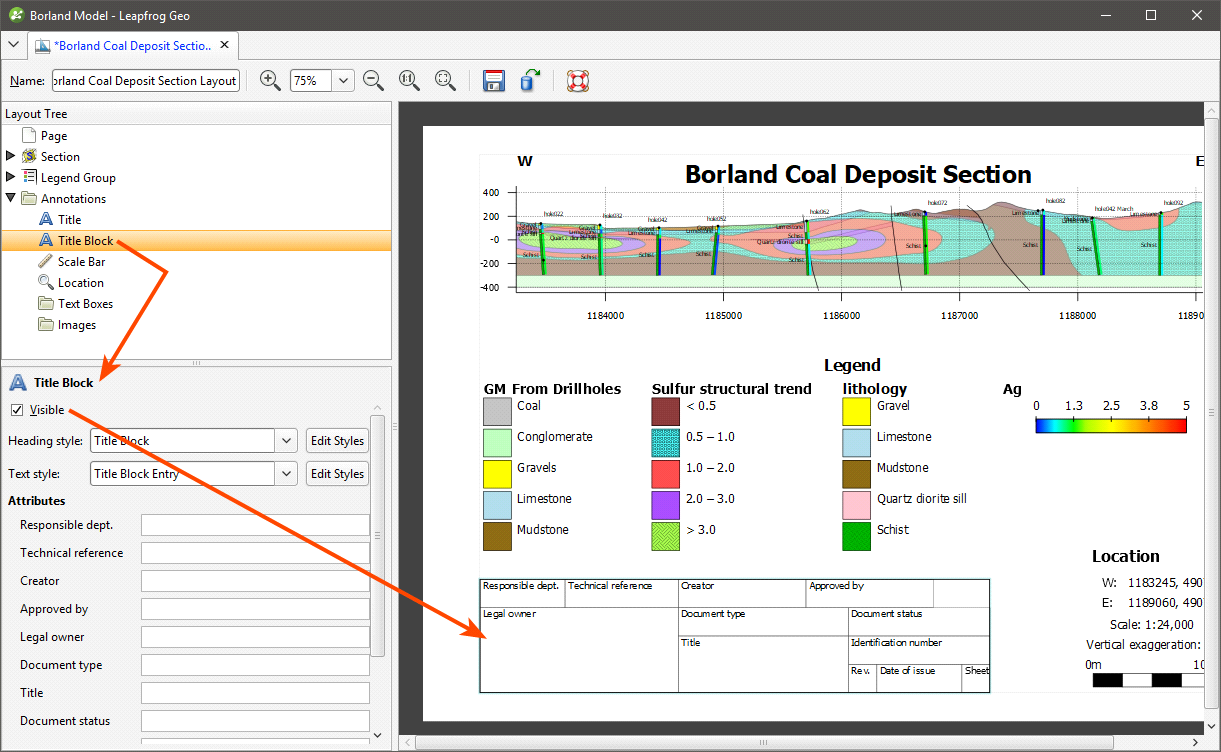
To display the Title Block on the section, select it in the Layout Tree, then tick the Visible box. In this panel, you can also change the styles used to display the information in the block.
Displaying a Scale Bar and Location Information
There are a number of different styles available for the Scale Bar, and you can control its Length, Partitions and Thickness:
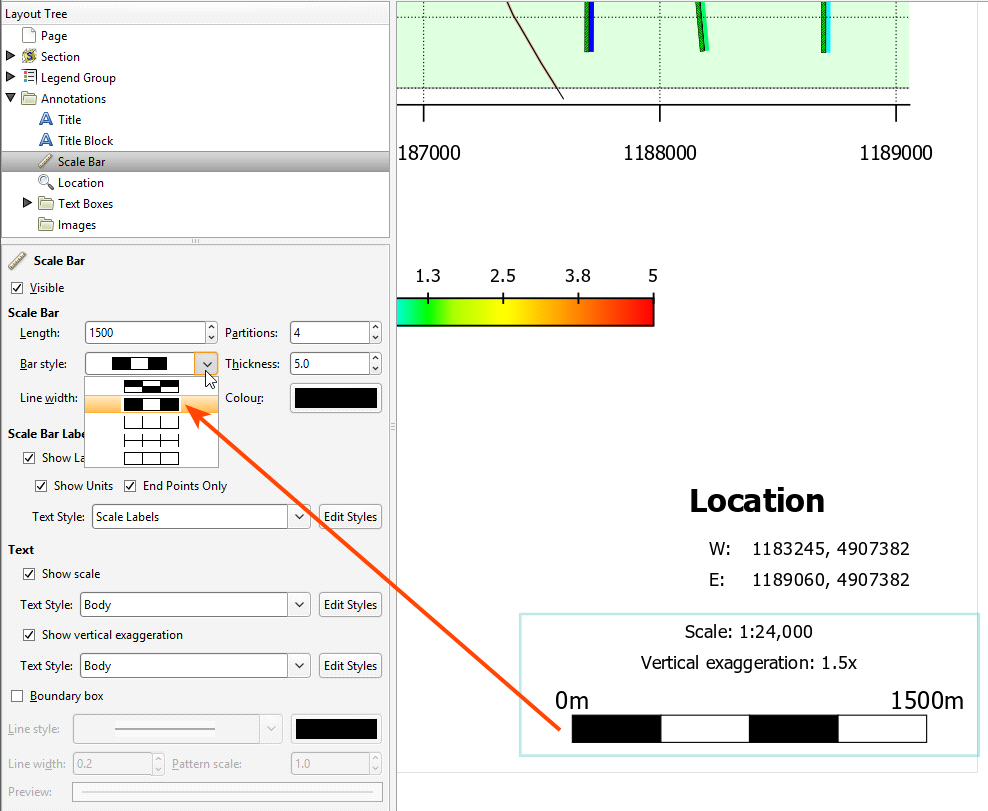
You can show the Scale Bar with or without labels, and labels can be shown all along the bar by disabling the End Points Only option:
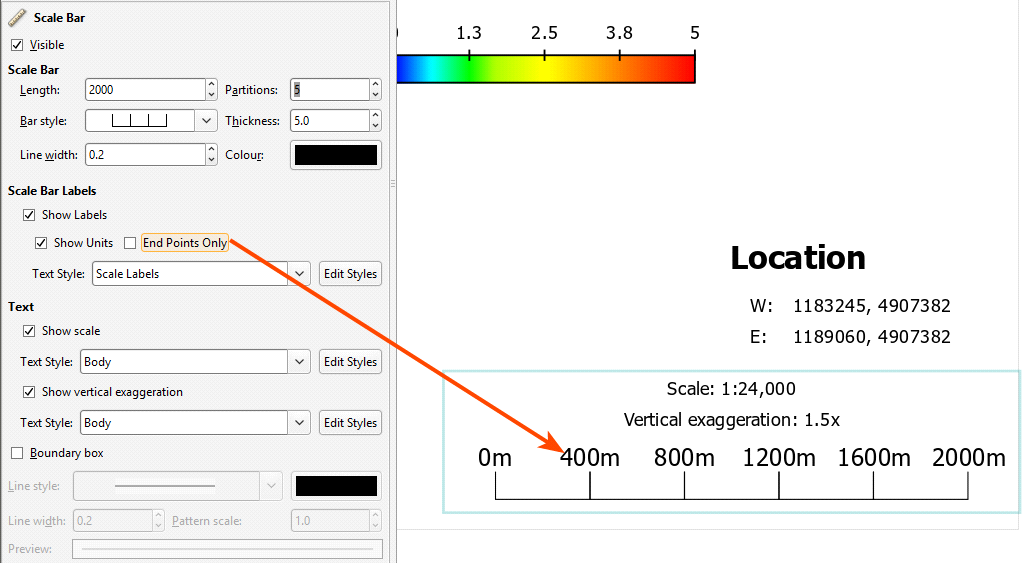
The Text options determine whether or not the scale and vertical exaggeration are shown on the scale bar.
The Location object controls how location information is displayed:
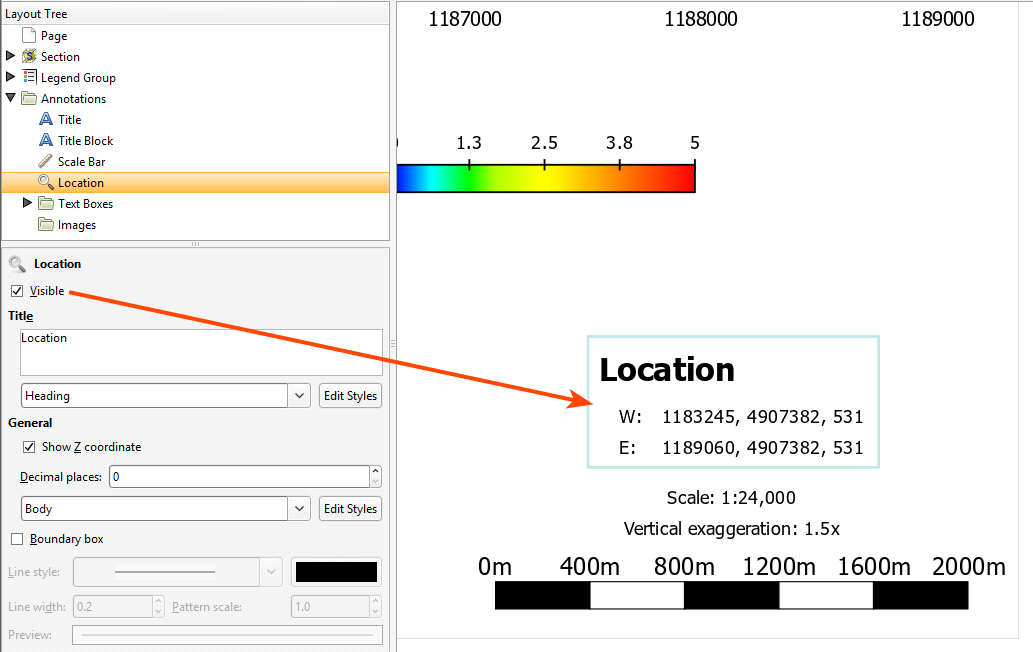
You can include the Z coordinate, if required and change the number of decimal places used to display coordinates.
There is a Boundary box option for both the Scale Bar and the Location. You can customise the Line style, Line width, Pattern scale and colour of the box. A Preview is displayed and the boundary is updated in the section preview.
Text Boxes
With the Text Boxes object, you can add text boxes and arrows to highlight information and details on the section:
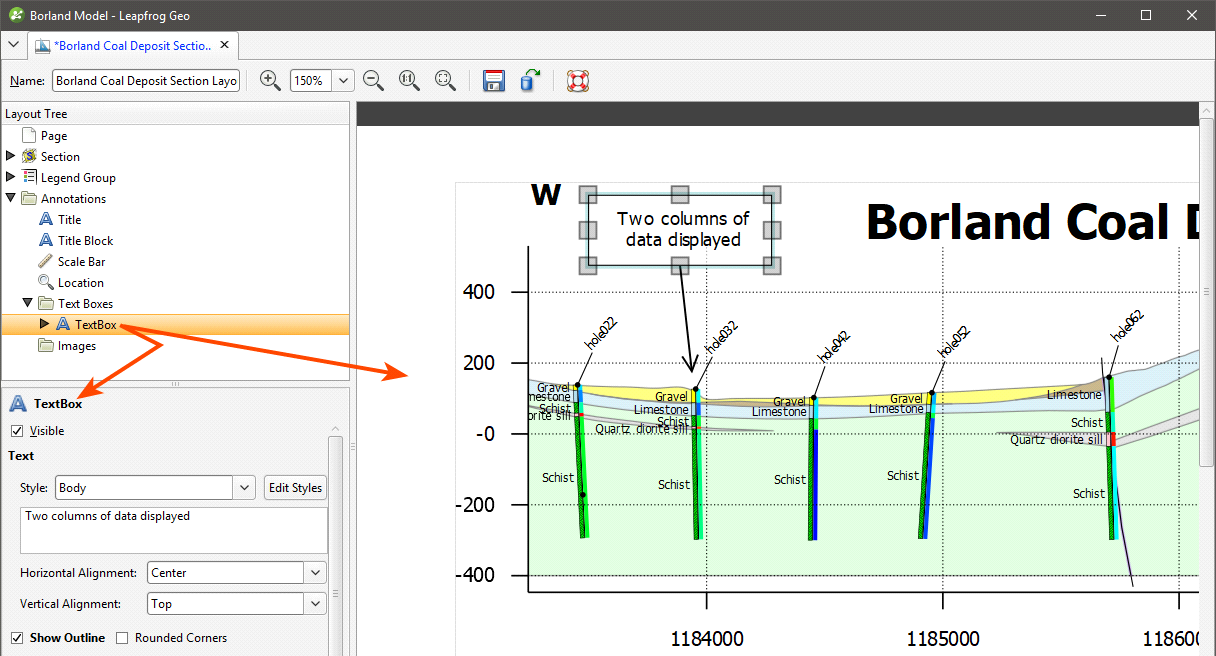
There is a Show Outline option for the text box, and corners can be square or rounded. You can customise the Line style, Line width, Pattern scale and colour of the outline. A Preview is displayed and the text box is updated in the section preview.
Arrows are connected to text boxes, and so initially only text boxes can be added. Right-click on a text box to add an arrow to it. When the Automatic anchoring option is enabled for an arrow, the arrow’s anchor will move when its associated text box is moved:
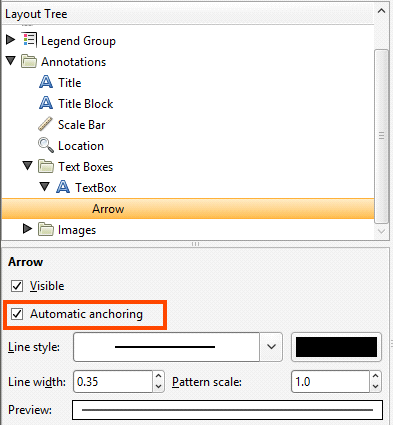
If this option is disabled, the arrow will move when you move the text box, but you will have to place its anchor manually.
Images
If you wish to import an image such as a logo or map, right-click on the Images object and select Add Image. Navigate to the folder that contains the image file and select the file. Click Open to import the file, which will automatically be added to the section layout:
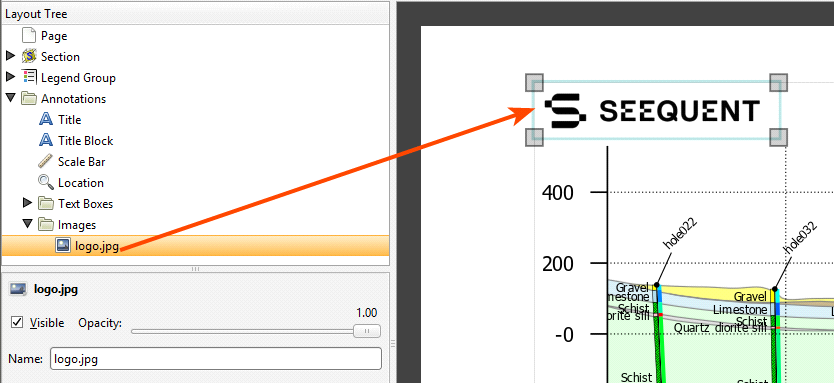
Move the image by clicking on it in the preview and dragging it. You can resize the image using the controls in the preview.
Got a question? Visit the Seequent forums or Seequent support