Stereonets
Stereonets are useful for visualising structural data and identifying trends in 2D. Errors in categorisation of structural data can also become apparent when the data is viewed on a stereonet.
There are two types of stereonets available in Leapfrog Geo: equatorial stereonets and polar stereonets. The process of creating a stereonet is the same for both types; you can change the type of stereonet by clicking the Options button in the stereonet window. Both Fisher and Bingham statistics are available for stereonets.
This topic describes how to work with stereonets in Leapfrog Geo. It covers:
- Creating a Stereonet
- Displaying the Stereonet in the 3D Scene
- Plot Options
- Data Display Options
- Viewing Stereonet Statistics
- Selecting Data in the Stereonet
- Using the Scene Window With the Stereonet
- Exporting a Stereonet
Creating a Stereonet
Create a stereonet by right-clicking on the Stereonets folder (in the Structural Modelling folder) and selecting New Stereonet. The stereonet is created and opened in a new tab. Click the Add button to add any structural data table in the project to the stereonet:

You can also drag and drop structural data objects from the project tree into the stereonet.
See Plot Options and Data Display Options below for information on the different options available for stereonets.
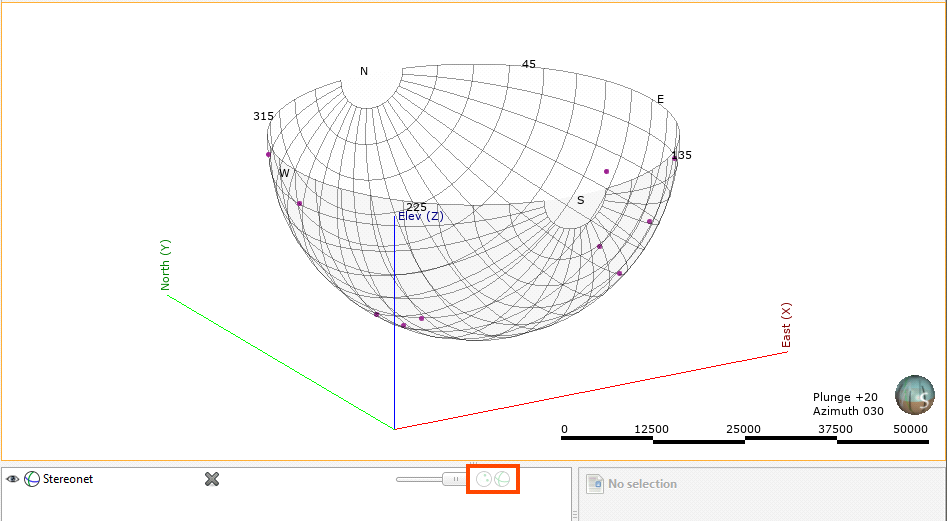
Displaying the Stereonet in the 3D Scene
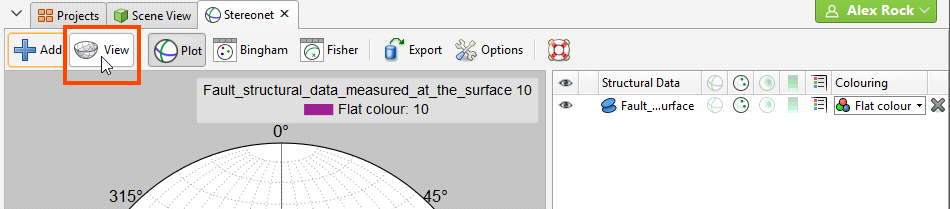
You can display the stereonet in the 3D scene by dragging the stereonet from the project tree into the scene or by clicking on the View button (![]() ) in the stereonet window:
) in the stereonet window:
You can display planes and poles in the 3D scene, but not contours. In the shape list, you can control whether planes or poles are displayed in the scene:
Otherwise, the appearance of the stereonet in the 3D scene is controlled from the stereonet window.
In the scene, you can:
- Resize the stereonet in the scene. Click on it and use the green arrows to resize it.
- Move the stereonet around in the scene. The controls are the same as those for the moving plane.
- Centre the stereonet on its input data. To do this, click on the stereonet in the shape list and then select from its inputs in the Move to list.
Plot Options
Click Options to change plot options:
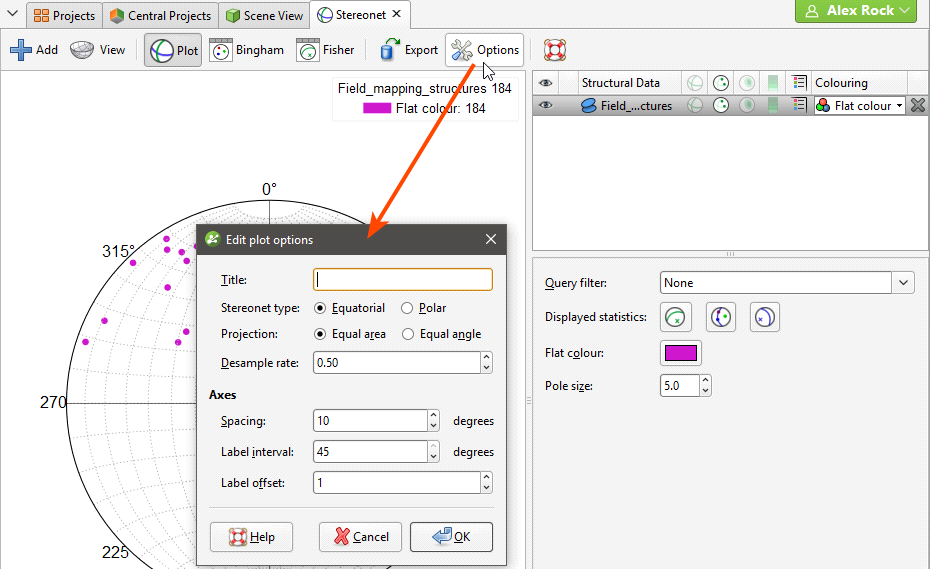
There are two types of stereonets available, Equatorial and Polar. You can also choose between Equal area (Schmidt) and Equal angle (Wulff) projections.
The Desample rate affects how quickly data is displayed by combining points with duplicate orientations, as determined by the Desample rate value. A low value will filter fewer data points, whereas a higher value will filter out more data. Setting the Desample rate to 0 plots all points, which may be slow for very large data sets that have not been declustered. The Desample rate applies only to how data is displayed; it does not affect the data in the table.
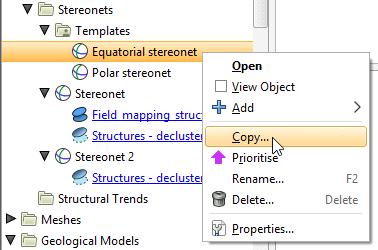
Note that the settings in Edit plot options window only apply to the current stereonet. If you want to create a stereonet “template” for your project, you can create a new stereonet with different plot options and make copies of it in the project tree:
Data Display Options
Planar structural data can be displayed as planes (![]() ), poles (
), poles (![]() ) or contours (
) or contours (![]() ), using the colouring from any column in the structural data table. Lineations can be displayed as poles (
), using the colouring from any column in the structural data table. Lineations can be displayed as poles (![]() ) or contours (
) or contours (![]() ). Contour methods available are Schmidt, Exponential Kamb and Kamb, and contours can be displayed filled or outlined.
). Contour methods available are Schmidt, Exponential Kamb and Kamb, and contours can be displayed filled or outlined.
Click on a line or pole to view information about the data point:
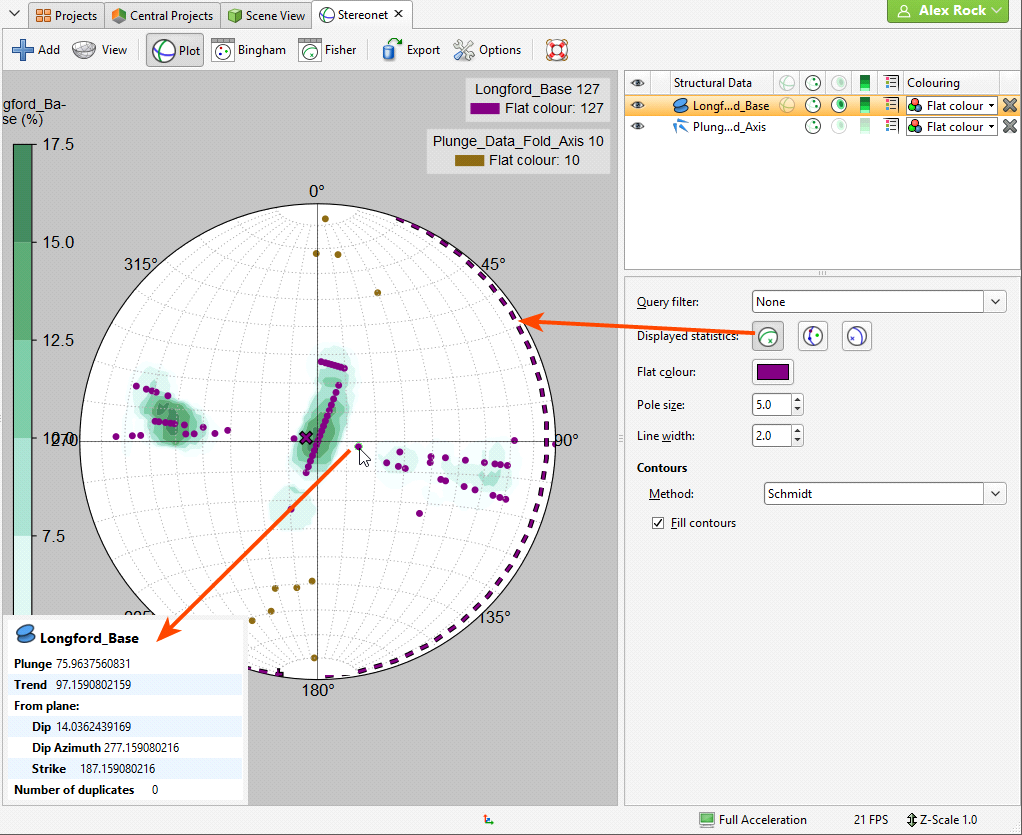
The information displayed includes whether or not there are duplicates of the selected data point in the data set.
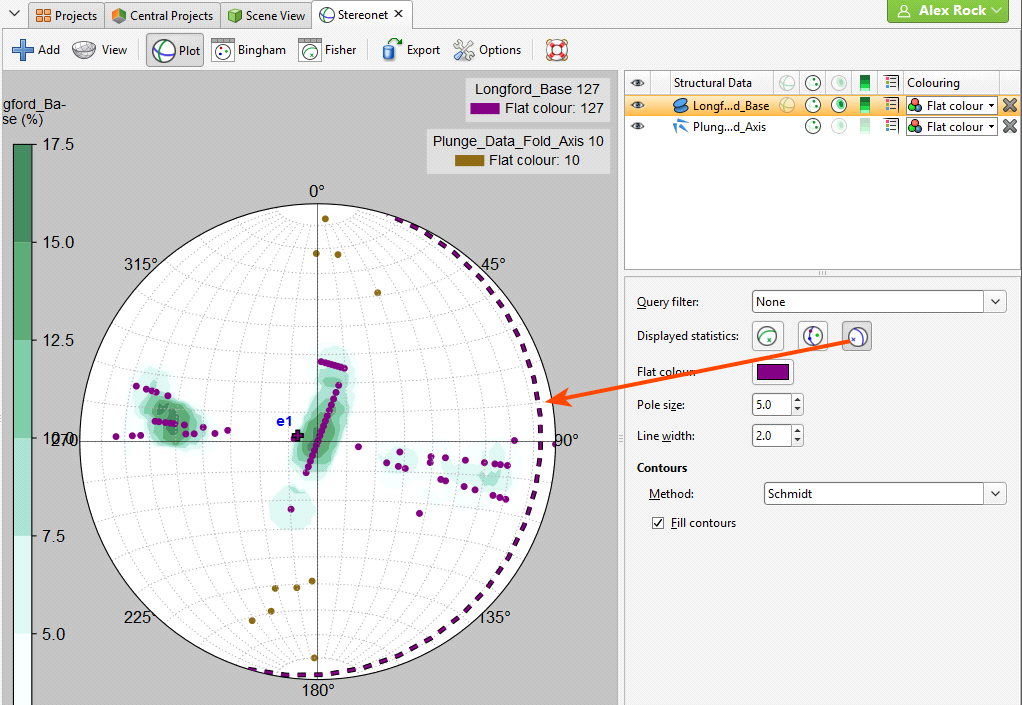
Click the mean button (![]() ) to view the Fisher mean on the stereonet, which is displayed as a line for planar structural data and as an X for lineations. You can also display the Bingham best-fit plane (
) to view the Fisher mean on the stereonet, which is displayed as a line for planar structural data and as an X for lineations. You can also display the Bingham best-fit plane (![]() ) and eigenvectors e1, e2 and e3:
) and eigenvectors e1, e2 and e3:

For planar structural data, you can also display the Bingham mean plane (![]() ):
):
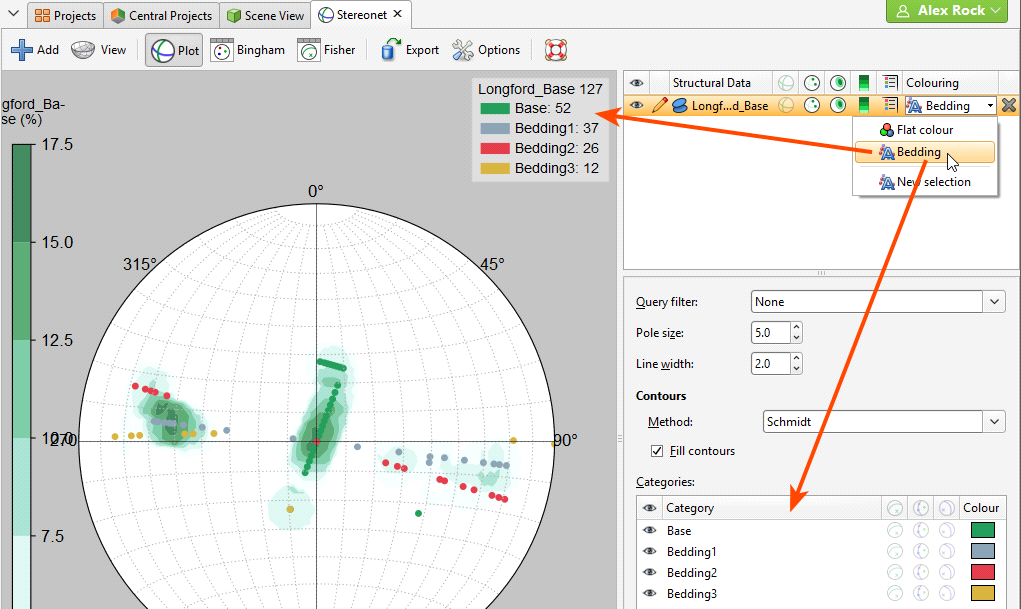
A legend can be displayed for the stereonet as a whole (![]() ) and for the contours (
) and for the contours (![]() ). The stereonet’s legend is generated from the categories that are visible in the list of colourings. Here, the categories displayed are from the Bedding column:
). The stereonet’s legend is generated from the categories that are visible in the list of colourings. Here, the categories displayed are from the Bedding column:
You can apply query filters from those available in the project.
Declustered data can be viewed on stereonets in two ways:
- Declustered data can be viewed directly on the stereonet. Simply drag the declustered table into the stereonet.
- If the declustered data’s parent data table is displayed on the stereonet, the declustered data is available as a filter.
For example, here a structural data table is displayed on a stereonet along with a declustered table. The declustered table is available as a query filter for its parent object:

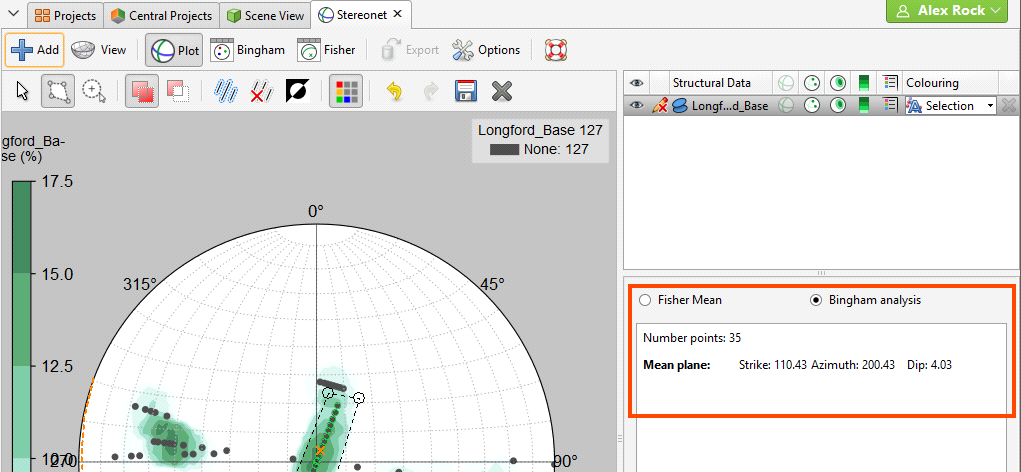
Viewing Stereonet Statistics
To view statistics on the data displayed on the stereonet, click either the Bingham button or the Fisher button:
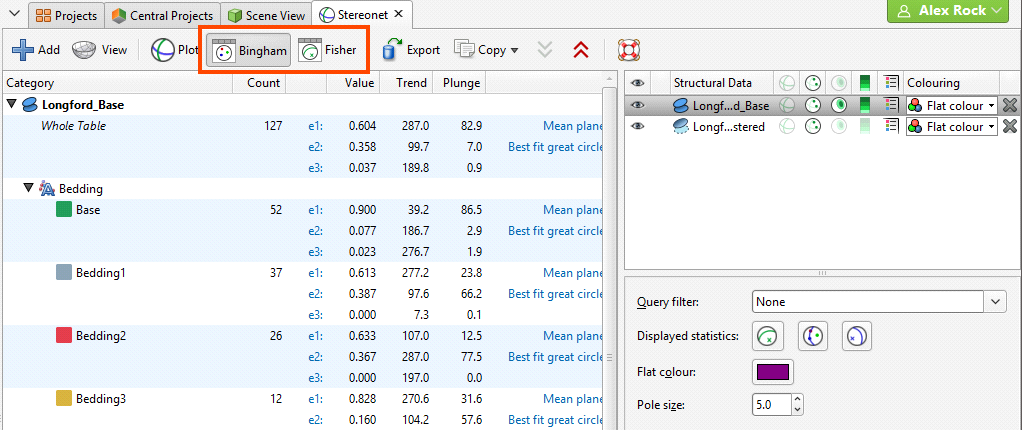
You can select specific rows and copy them to the clipboard or copy all data to the clipboard.
Selecting Data in the Stereonet
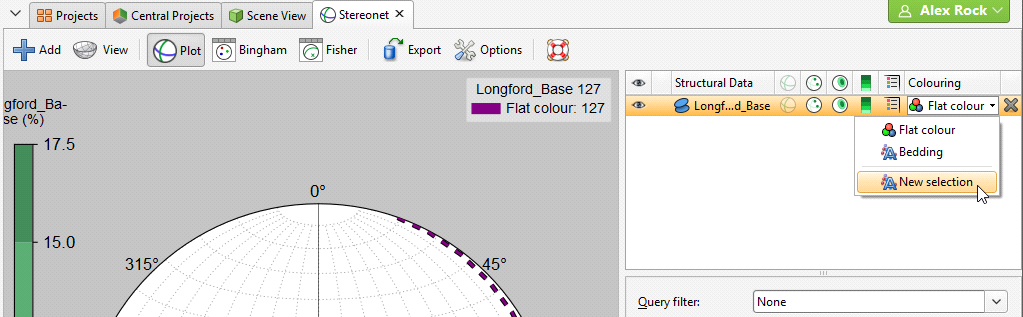
You can select data in the stereonet and assign it to new categories or existing ones. To do this, click on the data table in the stereonet window and select New selection from the colouring list:
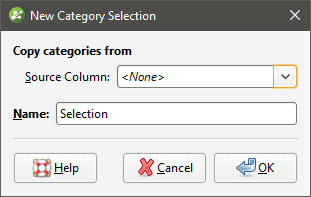
The New Category Selection window will appear:
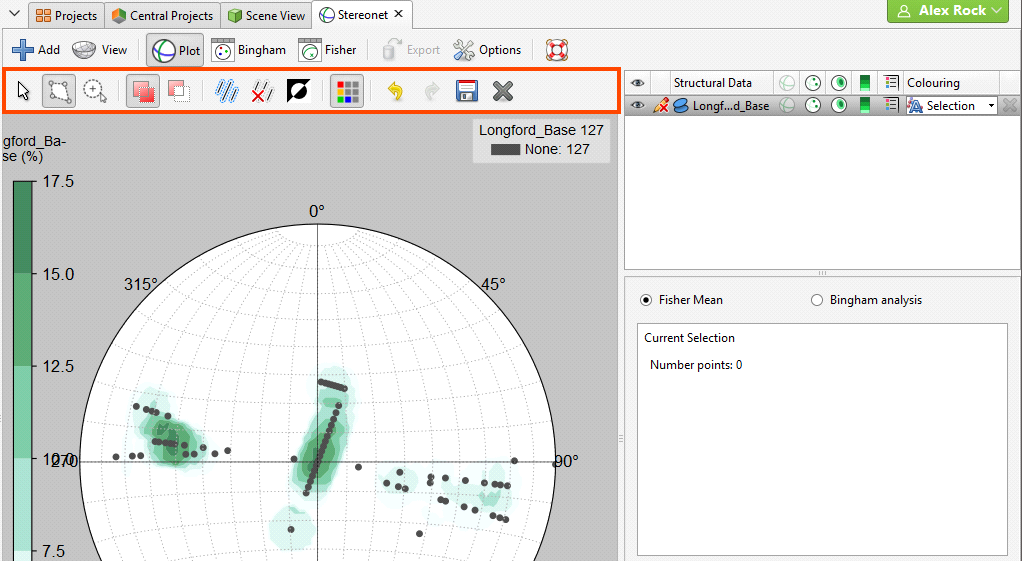
The poles will be displayed in the stereonet, if they are not already visible, and the data table will also be added to the scene window, together with tools for selecting points in the scene.
Organising the stereonet tab and the Scene View tab so they are displayed side-by-side can be useful in working with the data as you can select data in the stereonet or in the scene window. This is described further in Using the Scene Window With the Stereonet below.
If you select an existing column as the Source Column, you can assign selected points to the existing categories or create new categories. If you select <None> for the Source Column, you will have to define each category manually.
When you click OK, a set of tools for selecting data will be added to the stereonet window:
There are two tools for selecting data in the stereonet, the polygon tool (![]() ) and the bullseye (
) and the bullseye (![]() ) tool.
) tool.
- Use the polygon tool (
 ) to draw around the points you wish to select. Closing the polygon will select the points, and you can click on the vertices to refine the shape of the selection. Click outside of the selection to clear the polygon.
 - Use the bullseye tool (
 ) to:
) to:- Click on points one-by-one.
- Click and drag around points.
The Add button (![]() ) and the Remove button (
) and the Remove button (![]() ) determine whether selected points are being added to or removed from the selection. For example, if you draw a polygon around a set of points with the Add button enabled, the points will be added to the selection.
) determine whether selected points are being added to or removed from the selection. For example, if you draw a polygon around a set of points with the Add button enabled, the points will be added to the selection.
You can also:
- Remove points from a selection while the Add button (
 ) is enabled by holding down the Ctrl key and selecting points.
 - Select all visible points by clicking on the Select All button (
 ) or by pressing Ctrl+A.
 - Clear all selected points by clicking on the Clear Selection button (
 ) or by pressing Ctrl+Shift+A.
 - Swap the selected points for the unselected points by clicking on the Invert Selection button (
 ) or by pressing Ctrl+I.
 - Show or hide all unassigned points using the Unspecified Measurements button (
 ).
).
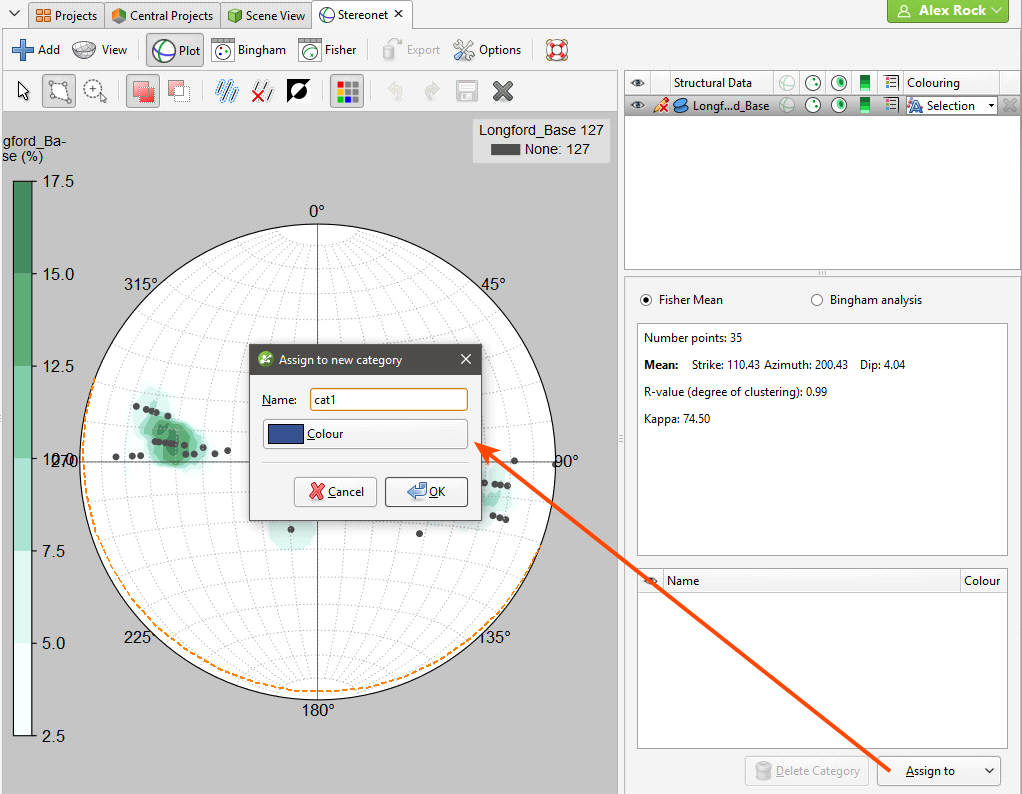
Statistics are shown for the currently selected set of points:
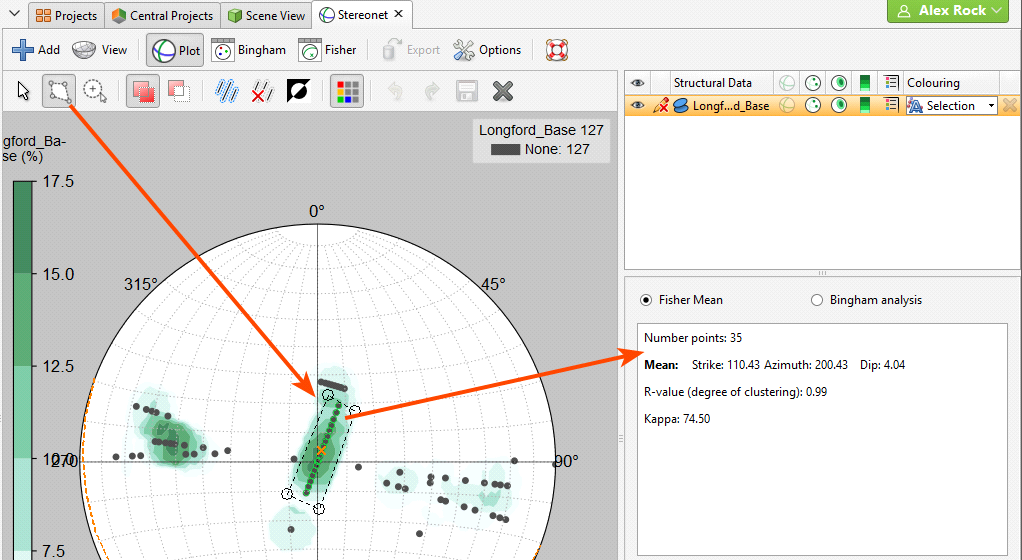
You can choose what type of statistics to display for selected points:
Once you have selected a set of points, click the Assign to button in the stereonet window, then select Create New Category. In the window that appears, enter a name for the category and assign a colour:
Click OK. The new category will be created and the stereonet will be updated to reflect the changes:
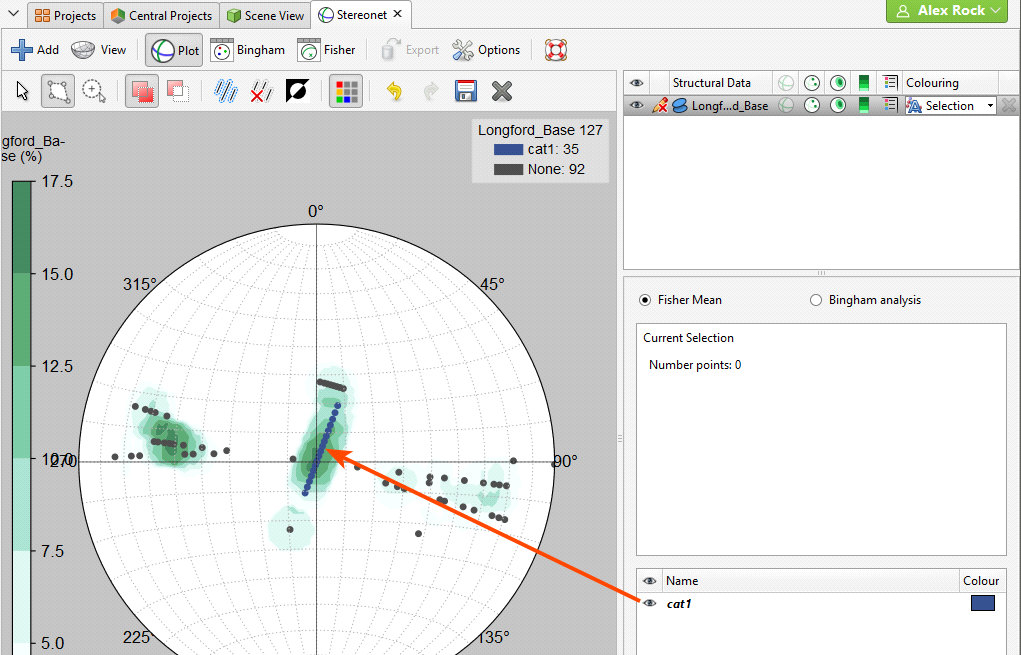
The scene window will also be updated.
Once you have created a new category, you can add to it by selecting further points, then selecting the category from the Assign to list.
When you are finished, click the Save button (![]() ) and close the category editor. You can make further edits by clicking the Edit button (
) and close the category editor. You can make further edits by clicking the Edit button (![]() ) in the stereonet window.
) in the stereonet window.
Using the Scene Window With the Stereonet
You can also select points in the scene window by clicking on the Select points tool (![]() ), then drawing over those points in the scene:
), then drawing over those points in the scene:
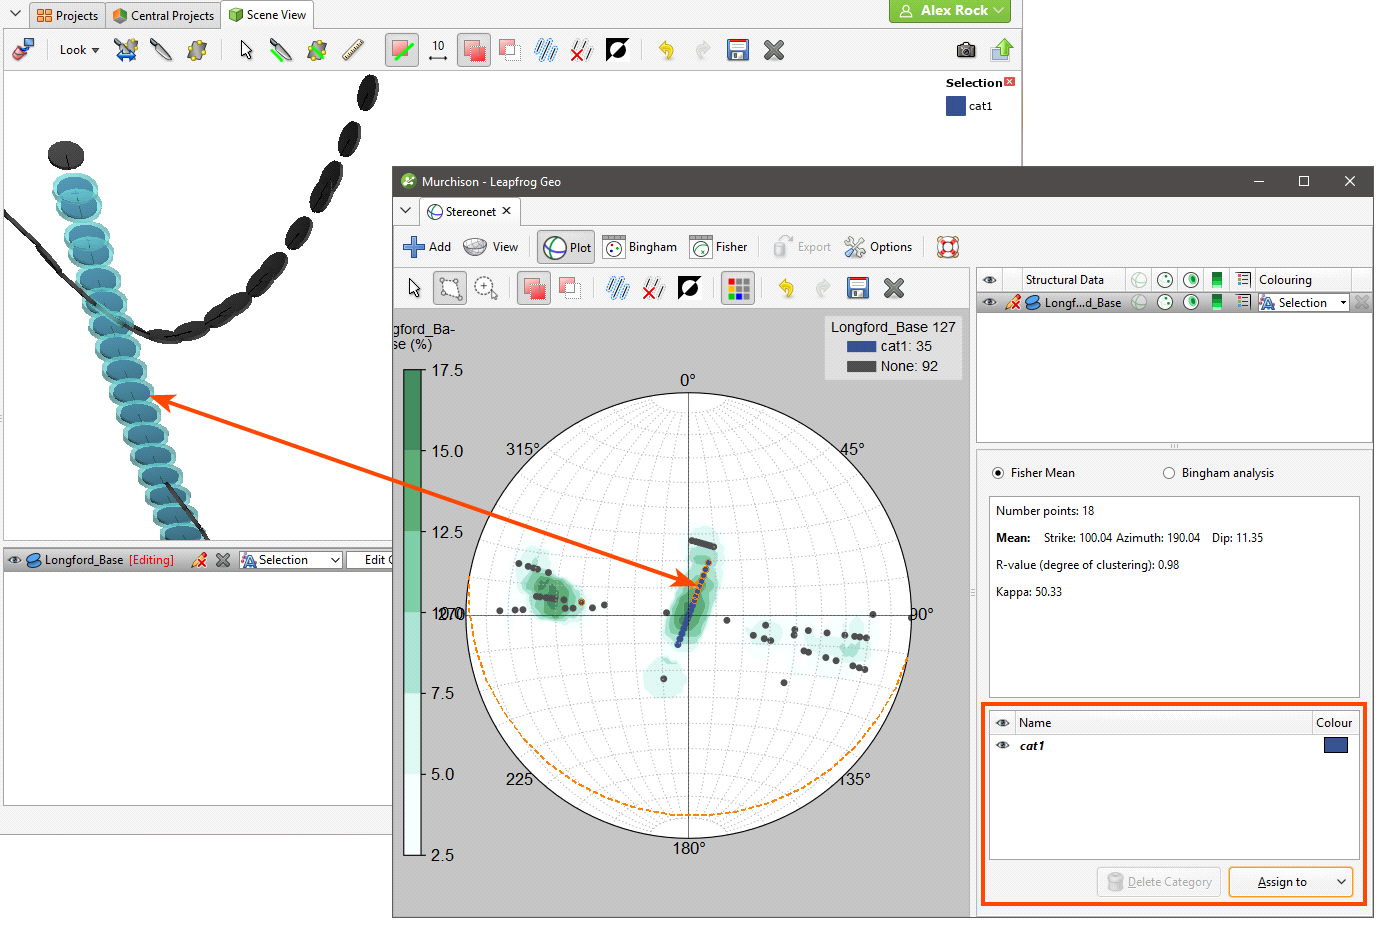
Controls for assigning points to categories will remain in the stereonet window, and both the stereonet window and the scene window will be updated to reflect the selected and assigned points.
Exporting a Stereonet
Stereonets can be exported in the following formats:
- PDF Files (*.pdf)
- Scalable Vector Graphics Files (*.svg)
- PNG Image Files (*.png)
Click the Export button. Select a format and navigate to the folder where you wish to save the file. Enter a name and click Save.
Got a question? Visit the Seequent forums or Seequent support