Numeric Point Upscaling
Upscaling numeric point data works with downhole points and LAS points. Point upscaling parameters can be applied to entire wells or only within a selected region of the well. There are four options for selecting the region in which points will be upscaled:
- Entire Well. The same upscaling parameters are applied to all values down the length of wells. See Upscaling in the Entire Well.
- Subset of Codes. Different upscaling parameters can be set for each code down the length of wells. See Upscaling in a Subset of Codes.
- Intervals from other Table. Interval lengths from another table are used to determine upscaling lengths. The value assigned to each interval is the length-weighted average value, and there are no further upscaling parameters to set. See Upscaling in Intervals from Another Table.
- Intervals from other Table with Advanced Upscaling. Interval lengths from another table are used to determine upscale lengths and advanced upscaling algorithms are set. See Using Advanced Upscaling.
To create a numeric point upscale, right-click on the Upscaled Tables folder and select New Numeric Point Upscale. You will be prompted to choose between these options. The rest of this topic describes these different point upscaling options.
Once you have set the upscaling region and parameters, the new upscaled table will be saved to the Upscaled Tables folder. Double-clicking on the table displays the data in its columns. Edit the table by right-clicking on it and selecting Edit Upscaled Points Table.
Once you have created an upscaled table, you can view statistics on the table or for each individual column in the table. See Viewing Upscaled Points Statistics.
Upscaling in the Entire Well
For this option, all values down the length of wells are upscaled. Select Entire well, then set the Upscaling length. Upscale lengths are generated from the location down the well.
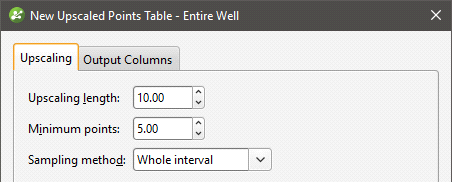
The Minimum points parameter determines how many points are required for a valid upscaled interval to be created. Points are assigned a value according to where they fall in the upscaled interval; points that lie exactly on the border of an interval are assigned a weight of 0.5, whereas other points are assigned a weight of 1.
There are two options for Sampling method:
- Whole interval. All data points in the upscaled interval are taken into account when calculating the upscaled value for that interval.
- Dominant category. A Category column is selected that determines whether or not data points in the upscaled interval are taken into account. Data points in the interval that do not occur in the dominant category are not used in calculating the upscaled value for that interval.
Click on the Output Columns tab to select from the available columns of data, then click OK to create the table.
Upscaling in a Subset of Codes
When upscaling is carried out using the Subset of Codes option, some codes can be excluded from the upscaled table or the raw data from the Base column can be used. When upscaling is applied to a code, the same parameters apply as for the Entire Well option, but different codes can use different Length and Minimum points parameters.
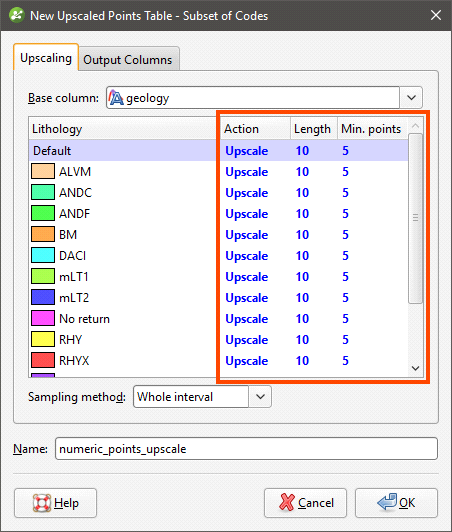
For the Action column, the options are:
- Upscale. Numeric point data that falls within the selected code will be upscaled according to the parameters set.
- No upscaling. Numeric point data is not upscaled within the selected code. The raw data will be used in creating the new data table.
- Filter out. Numeric point data within the selected code will not be included in the new data table.
The Minimum points parameter determines how many points are required for a valid upscaled interval to be created. Points are assigned a value according to where they fall in the upscaled interval; points that lie exactly on the border of an interval are assigned a weight of 0.5, whereas other points are assigned a weight of 1.
There are two options for Sampling method:
- Whole interval. All data points in the upscaled interval are taken into account when calculating the upscaled value for that interval.
- Dominant category. A Category column is selected that determines whether or not data points in the upscaled interval are taken into account. Data points in the interval that do not occur in the dominant category are not used in calculating the upscaled value for that interval.
Click on the Output Columns tab to select from the available columns of data, then click OK to create the table.
Upscaling in Intervals from Another Table
For the Intervals from other Table option, the interval lengths from the Base table are used to determine upscale lengths. The value assigned to each interval is the length-weighted average value, and there are no further upscaling parameters to set.
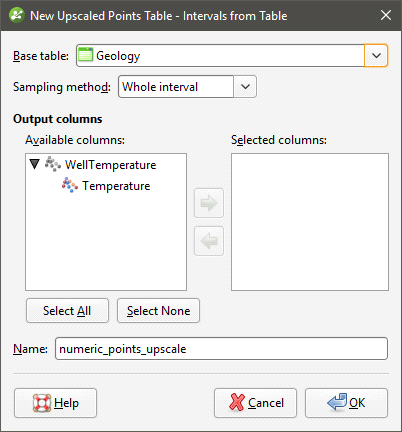
Click on the Output Columns tab to select from the available columns of data, then click OK to create the table.
Using Advanced Upscaling
When upscaling is carried out using the Intervals from other Table with Advanced Upscaling option, first select the Base table and the Sampling method.
There are two options for Sampling method:
- Whole interval. All data points in the upscaled interval are taken into account when calculating the upscaled value for that interval.
- Dominant category. A Category column is selected that determines whether or not data points in the upscaled interval are taken into account. Data points in the interval that do not occur in the dominant category are not used in calculating the upscaled value for that interval.
Then select which Output columns you wish to include. You can then set the Algorithm and 0 replacement value for each column:
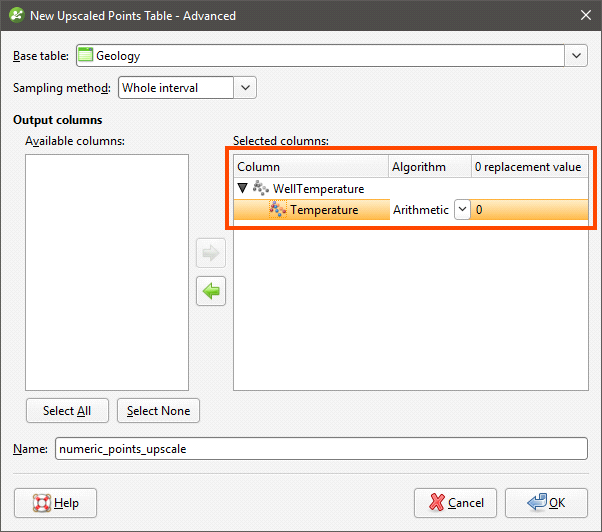
Available algorithms are Arithmetic, Geometric, Harmonic, Max, Median and Min.
Click OK to create the table.
Viewing Upscaled Points Statistics
Once you have created an upscaled table, you can view statistics on the table or for each individual column in the table.
To view statistics for the table, right-click on it and select Statistics.
See the Analysing Data topic for more information on each option:
Right-click on the table columns and select Statistics to view information about the upscaled values.
Got a question? Visit the Seequent forums or Seequent support