The Linear Interpolant Function
Generally, estimates produced using the linear interpolant will strongly reflect values at nearby points and the linear interpolant is a useful general-purpose interpolant for sparsely and/or irregularly sampled data. It works well for lithology data, but is not appropriate for values with a distinct finite range of influence.
The linear interpolant function is multi-scale, and, therefore, is a good general purpose model. It works well for lithology data, which often has localised pockets of high-resolution data. It can be used to quickly visualise data trends and whether or not compositing or transforming values will be required. It is not appropriate for values with a distinct finite range of influence as it aggressively extrapolates out from the data. Most ore grade data is not well interpolated using a linear interpolant function.
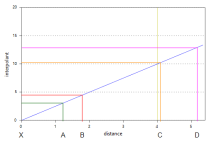
The linear interpolant function simply assumes that known values closer to the point you wish to estimate have a proportionally greater influence than points that are further away:
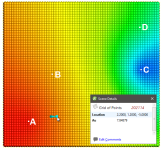
In the above diagram, points A and B will have the most effect on point X as they are closer to X than points C and D. Using the linear interpolant function in Leapfrog Geothermal gives a value of 7.85, which is between the nearby high grade values of A (10) and B (7). Because of their distance from X, the low grade values at C and D have a much weaker effect on the estimate of point X, and they have not dragged the estimate for X lower.
This topic describes the parameters used to define a linear interpolant.
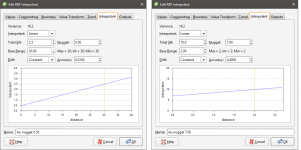
To edit the parameters for an interpolant, double-click on the interpolant in the project tree and click on the Interpolant tab. The graph on the tab shows how the interpolant function values vary with distance and is updated as you change interpolant parameters:
The yellow line indicates the Base Range. For this interpolant, the value of the interpolant is offset by the value of Nugget.
Total Sill and Base Range
A linear interpolant has no sill or range in the traditional sense. Instead, the Total Sill and Base Range set the slope of the interpolant. The Base Range is the distance at which the interpolant value is the Total Sill.
Nugget
The Nugget represents a local anomaly in values, one that is substantially different from what would be predicted at that point based on the surrounding data. Increasing the value of Nugget effectively places more emphasis on the average values of surrounding samples and less on the actual data point, and can be used to reduce noise caused by inaccurately measured samples.
Drift
The Drift is a model of the value distribution away from data. It determines the behaviour a long way from sampled data.
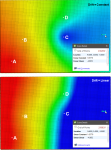
- Constant: The interpolant goes to the approximated declustered mean of the data.
- Linear: The interpolant behaves linearly away from data, which may result in negative values.
Here, the two Drift options for the interpolant are shown evaluated on grids:
In this example, the boundary is larger than the extent of the data to illustrate the effect of different Drift settings.
Accuracy
Leapfrog Geothermal estimates the Accuracy from the data values by taking a fraction of the smallest difference between measured data values. Although there is the temptation to set the Accuracy as low as possible, there is little point to specifying an Accuracy significantly smaller than the errors in the measured data. For example, if values are specified to two decimal places, setting the Accuracy to 0.001 is more than adequate. Smaller values will cause the interpolation to run more slowly and will degrade the interpolation result. For example, when recording to two decimals, the range 0.035 to 0.044 will be recorded as 0.04. There is little point in asking Leapfrog Geothermal to match a value to plus or minus 0.000001 when intrinsically that value is only accurate to plus or minus 0.005.
Got a question? Visit the My Leapfrog forums at https://forum.leapfrog3d.com/c/open-forum or technical support at http://www.leapfrog3d.com/contact/support


