Form Interpolants
A form interpolant is an RBF interpolant that uses planar structural data to control the RBF gradient. The RBF gradient resembles the geology orientation, which makes form interpolants useful for visualising structural data and identifying broad trends in 3D. The form interpolant’s meshes can then be used to control other surfaces in the project.
This topic describes how to work with form interpolants in Leapfrog Geothermal. It covers:
Once a form interpolant has been created, experiment with different Distance values. To do this, double-click on the interpolant in the project tree and click on the Outputs tab.
Creating a Form Interpolant
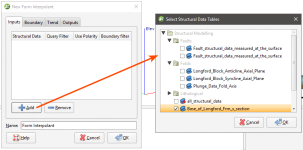
To create a form interpolant, right-click on the Form Interpolants folder (in the Structural Modelling folder) and select New Form Interpolant. In the window that appears, click the Add button to add structural data tables to the interpolant:
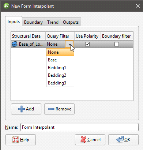
Data can be filtered using the query filters defined for the selected structural data tables:
Once you have created the interpolant, you can easily add and remove structural data tables and change the filtering.
When generating the form interpolant, you can use the tangents and polarity or only the tangents. To use both, leave the Use Polarity box ticked. To use only the tangents, untick the box.
The Boundary filter setting determines how data is handled when it lies outside the interpolant’s boundary:
- Boundary filter enabled. The interpolant is only influenced by the data that falls inside the boundary.
- Boundary filter disabled. The interpolant is influenced by the data both inside and outside the boundary.
Setting a Trend
In the Trend tab, you can set a trend using the moving plane or by entering the required values. You can also use the Set to list to choose different options used in the project. Isotropic is the default option used when the function is created.
The Ellipsoid Ratios determine the relative shape and strength of the ellipsoids in the scene, where:
- The Maximum value is the relative strength in the direction of the green line on the moving plane.
- The Intermed. value is the relative strength in the direction perpendicular to the green line on the moving plane.
- The Minimum value is the relative strength in the direction orthogonal to the plane.
Adding Isosurfaces
The isosurfaces generated for the form interpolant are determined by the settings in the Outputs tab. If you wish to add more isosurfaces to the interpolant, click the Add button and enter the required Iso Value. Click on an isosurface and then on the Remove button to delete it.
The Default resolution setting is used for all new isosurfaces.
The Form Interpolant in the Project Tree
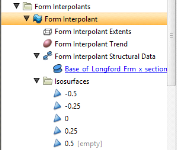
In the project tree, the form interpolant contains objects that represent different parts of the interpolant:
- The Extents object represents the interpolant’s boundary settings, from the Boundary tab.
- The Trend object describes the trend applied in the interpolant. See Global Trends for more information.
- The structural data object (
 ) contains a link to the data used in generating the interpolant. See Form Interpolant Statistics for more information.
 - The Isosurfaces folder contains the isosurfaces defined in the Outputs tab.
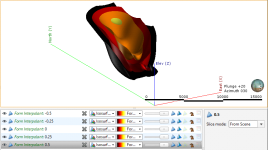
To display the form interpolant:
- Drag the interpolant into the scene.
- Right-click on the interpolant and select View Isosurfaces.
Form Interpolant Statistics
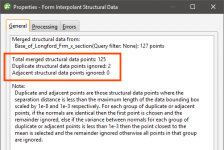
To view information about the data used for the form interpolant, right-click on the structural data object (![]() ) under the interpolant and select Properties. The General tab includes information about how the data has been declustered:
) under the interpolant and select Properties. The General tab includes information about how the data has been declustered:
You cannot change how data is declustered in the form interpolant, but if you wish to have more control over this, create a declustered structural data set and use it as the input for the form interpolant. See Declustering Planar Structural Data for more information.
Got a question? Visit the My Leapfrog forums at https://forum.leapfrog3d.com/c/open-forum or technical support at http://www.leapfrog3d.com/contact/support
