
Plot Voronoi Cells
Use the Grid and Image > Gridding > Tinning > Plot Voronoi Cells menu option (TINVORONOI GX) to plot the Voronoi cells of a Triangular Irregular Network (TIN) file. Voronoi cells are polygonal zones surrounding each node. Any location inside the zone is closer to its "own" node than to any other node.
Plot Voronoi Cells dialog options
Voronoi Cells
The Voronoi cells are defined as the regions around each node encompassing all points which are nearest neighbours to that node. It is created by joining the perpendicular bisectors of the lines joining each node. By definition, points along a perpendicular bisector are equidistant to the two nodes defining it, and form the boundary (at least in part) of the Voronoi cells for those two nodes.
The image below shows the Voronoi diagram for a set of 16 nodes.
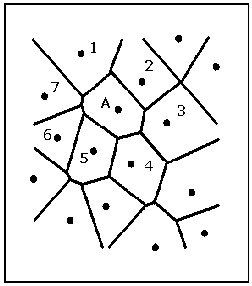
Each region, or cell, consists of the part of the plane nearest to that node. The cells are unique and can be defined similarly in any dimension (Sambridge, Brown & McQueen 1995).
Got a question? Visit the Seequent forums or Seequent support
© 2023 Seequent, The Bentley Subsurface Company
Privacy | Terms of Use