Drillhole Plan - Stereonet Plot Parameters
Use this dialog to plot stereographic projections of structural dip/dip-direction data in a plan-map plot.
Stereonet Plot Parameters – Plan Map
Dip and Dip-Direction Data
|
|
Dip Data
|
Use the dropdown list to select the channel that contains the dip data, in degrees. For "Absolute" Dip/Dip Reference, the dip is measured downward from horizontal (e.g. 90 degrees is vertical). For "Relative to hole", dip is measured with respect to the hole axis, with zero degrees parallel to the hole axis, and 90 degrees being perpendicular to the hole axis. This angle is also referred to as the "alpha" value.
|
|
Dip-direction Data
|
Use the dropdown list to select the channel that contains the dip-direction data, in degrees. For "Absolute" Dip/Dip Reference, the dip direction is the azimuth angle, measured clockwise from North. For "Relative to hole", dip direction is measured clockwise looking down the hole axis, from either the top or bottom reference point. This angle is also referred to as the "beta" value.
"Top" and "Bottom" can only be determined for non-vertical holes. In those cases where the hole is vertical, Dip and Dip-Direction is always interpreted using the "absolute" reference.
|
Dip/Dir Reference
|
|
Absolute
|
Select to reference dip and dip-direction as absolute quantities. See the "Dip and Dip-Direction Data" section above for definitions.
|
|
Relative to hole
|
Select to reference dip and dip-direction relative to the hole. See the "Dip and Dip-Direction Data" section above for definitions.
|
|
Ref Line (Top or Bottom)
|
The Ref Line option is only available when the dip-direction reference is "Relative to hole". The reference line is a mark on the hole casing, located using gravity at either the "top" or "bottom" of the casing in a slanting (non-vertical) hole. For example, the bottom reference line is the mark, which would be created on the core casing using a plumb-bob with chalk if it were suspended from the central axis of the hole, if it were lowered down the hole. In practice this is down using a specially designed instrument.
|
Plot Parameters
|
|
Offset in X/Y (mm)
|
Select the location of the stereonet plots with respect to the plotted collar or pierce point. The offset is with respect to the center of the stereonet plot. A dashed line, drawn with the same colour and thickness as the hole trace, is plotted from the collar location to the center of the stereonet.
|
|
Overplot protection
|
Check this box to engage overplot protection. If this box is not checked, then the location of the plotted stereonet is always exactly as specified in the Offset (above), even if such a plot will overlap other stereonets, or hide collars of other holes. With Overplot protection enabled, the locations of collars and collar labels are protected, as well as the locations of each stereonet. To begin with, the location is set based on the offsets entered above. If this location is not available because it contains a collar, label or previously plotted stereonet, then a spiral search is made until an empty location is found. A dashed line, drawn with the same colour and thickness as the hole trace, is plotted from the collar location to the center of the stereonet.
|
|
Radius (mm)
|
The radius of the full stereonet plot.
|
|
Sector Angle
|
Select a value to plot azimuth reference radial lines in the plot.
|
|
Dip Increment
|
Select an increment for plotting concentric circular reference lines to indicate the dip values.
|
|
Line thickness (mm)
|
The thickness of lines used for plotting the stereonet diagram.
|
|
Colour (graphic)
|
Select a colour for the stereonet plot and its reference lines.
|
Symbols
|
|
Fixed colour
|
Select this radio button and all symbols will be plotted with this colour; click the coloured box to select a particular colour.
|
|
Structure codes
|
Select this radio button to colour the individual symbols based on the value in the selected Structural Data channel. If a matching entry is found in the Structure codes file, the symbol will be plotted with the matching code’s colour. (Values not found in the codes file will not be plotted.)
|
|
Structural Data
|
Select the table and data containing the structure codes. This can be from-to or point (single-depth) data. Only those tadpoles which have a corresponding item at the same depth in the Structural Data channel will be plotted.
|
|
Structure codes file name
|
Enter the name of the structure codes file to use. This value is set by default to be the value entered in the Preferences.
|
|
Browse…
|
Browse to select the structure codes file name. The entered name does not need to be an existing file, but in that case you must create the file using the Edit… button.
|
|
Edit…
|
Bring up the Structure Codes edit dialog to modify or create the structure codes file.
|
|
Size (mm)
|
Specify the size of the plotted symbols (squares or circles), in millimetres.
|
|
Line thickness (mm)
|
Specify the thickness of the symbol edge line, in millimetres.
|
|
Edge Colour
|
Select the colour for the symbol edge line. You can select "None" by choosing white and answering "No".
|
Intervals
|
|
Entire hole
|
Combine all the data from the hole into the stereonet plot.
|
|
Plan Thickness
|
Only data for the selected plan thickness is plotted in the stereonet. For "Full plan" plots, this is all the data. (Use the Plan Location tab to set the plan thickness, reference level etc.)
|
|
Thickness at reference level
|
Only data within half the specified thickness, above and below the reference level (specified in the Plan Location tab) is plotted.
|
|
Level Range
|
Plot only data in the specified level range. Note that these values correspond to reference level values, e.g. DH_RL, not the depth down the hole.
|
Stereonet Type
|
|
Equal-Area or Equal Angle
|
Select the type of spherical projection for the stereonet plot, either "Equal-area" (also known as a Schmidt net), or "Equal-angle" (also known as a Wulff net). See the Notes below for an explanation of the two types.
|
Application Notes
Stereographic Projection
Stereographic projection is a method used in crystallography and structural geology to depict the angular relationships between crystal faces and geologic structures, respectively. Two stereographic projections are commonly used, the "equal-area projection", or "Schmidt net"; and the "equal-angle projection", or "Wulff net".
Equal-Angle "Wulff Net"
The shapes of plane shapes on the surface of the sphere are preserved in this projection, but the relative areas are altered. An equal-angle stereonet is good for measuring the angles between cyclographic traces of plans.
Imagine that we have a dip vector inside of a sphere with dip angle f. The intersection of this line with the surface of the sphere is at point B. Then, we draw a line from point a directly to the North Pole of the sphere. Where this line intersects the equatorial plane X is where we plot the point.
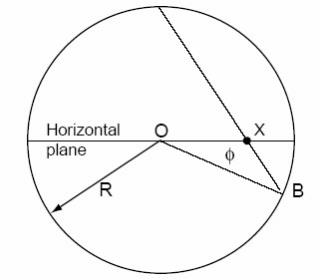
If the radius of the sphere is R, then the location of the projected point is at R*tan(90-f/2).
Equal-Area "Schmidt Net"
The relative areas of plane shapes on the surface of the sphere are preserved in this projection, but the shapes are altered. An equal-area stereonet is good for representing the density of poles.
Imagine that we have a dip vector inside of a sphere with dip angle f. The intersection of this line with the surface of the sphere is at point B. Draw the line AB from the South Pole to B, and this distance AB is the radius of the projected point. The maximum radius is Ö2*R for a dip of zero, so when plotting we divide by the square root of two to normalize things.
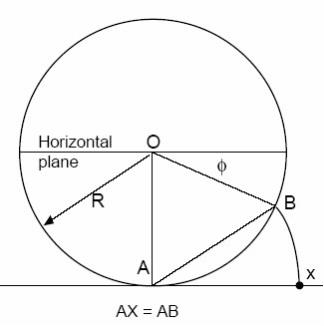
If the maximum radius of the projected circle is R, then the location of the projected point is R*Ö2*sin(90-f/2).
