
The Spreadsheet Window
Spreadsheets are windows to your database.
When you create a new database or open an existing one, the system opens a corresponding spreadsheet window in Oasis montaj. The spreadsheet view is your "window" to the Oasis montaj database and it also provides you with flexibility in setting up your working environment. All data is stored securely in the underlying database — you simply decide which data you want to display in the spreadsheet and keep all other data in the background, hidden from view.
The spreadsheet window is organized in rows, columns (channels) and lines (also called groups in other applications such as drillhole plotting). Rows and columns work similar to standard spreadsheets in that you can edit and delete them as needed. The system enables multiple "pages" in your database – depending on the type of data you are working with (line, random line or drillhole); the worksheets have different names. To see what type of name is used, look at the ID cell in the top left corner of the spreadsheet. An "L" for example, indicates that you are working with line data.
![]() Click to view the parts of the spreadsheet window
Click to view the parts of the spreadsheet window
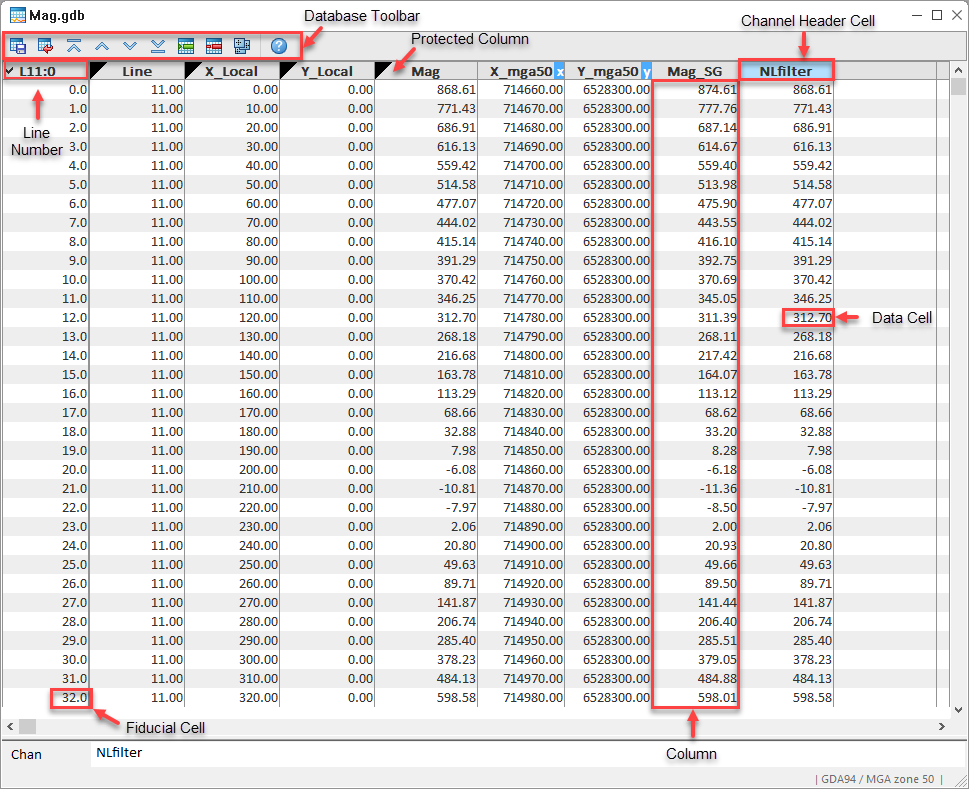
The data visible in the spreadsheet window represents only some of the channels. This differs from a conventional spreadsheet program where what you see "on the screen" is the data. The spreadsheet window only displays those parts of the data that you choose to display.
In general, you may have as many lines and channels in your database as you require (i.e., there is no limit). You are also free to display channels in any order or remove them from the window whenever you like.
The spreadsheet window is the interface to your data and enables you to perform a variety of tasks, including:
-
Display a view of the data from a single line in numerical or text format
-
Display database statistics
-
Apply mathematical expressions to data
-
Process selected samples, selected columns, and selected lines or groups and display resulting data
-
Analyze data using built-in Geosoft eXecutable (GX) functionality
-
Use database tools to edit the database
How Does the Spreadsheet Window Display Project Data
Depending on your type of project, the spreadsheet will display your data as either values or arrays:
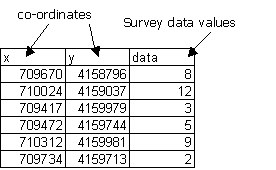
Single Value Data
For surveys where a single value is recorded at each station, for example a magnetic survey, each data cell will contain a single value.
Array Data
For surveys where multiple readings where recorded at each station, for example an Induced Polarization survey, each data cell will contain multiple values.
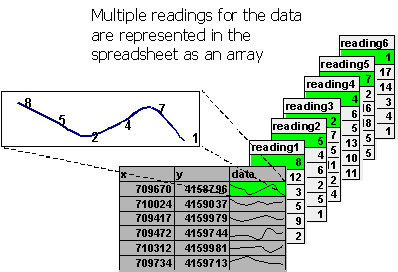
The spreadsheet represents these values as a profile line in an array channel.
Got a question? Visit the Seequent forums or Seequent support
© 2023 Seequent, The Bentley Subsurface Company
Privacy | Terms of Use