
GX Developer Debugger
Geosoft’s GX Developer Toolkit includes a GX Debugger modelled after the general style of Microsoft’s Visual Studio. Although the GX Debugger does not offer the full range of the Visual Studio functionality, it is a flexible and adequate tool for debugging GXs, and will tremendously speed up your development.
Enable the GX Debugger Menu
-
On the Project menu, select Manage Menus. The Manage Menus dialog is displayed.
-
In the Standard Menus section, check the GX Developer Debugger entry and click OK.
-
The GX Developer Debugger menu will be displayed on the main Oasis montaj menu bar.
The menu provides two options:
- The Enable (dbgenable.gx) option opens the Enable Oasis montaj GX Debugger dialog: you will be asked to provide a source directory to be used by the debugger to scan and find all GXC source files under its directory tree. These are the files that will be available for viewing and debugging in the debugger interface. The dialog also asks for the name of the GX in which to place the first break. The next time you directly or indirectly run this GX, the process will stop at the first execution line of the GX. If the specified GX is not found, an appropriate message is displayed and you are placed back in the GX Debugger dialogue.
- The Disable (dbgdisable.gx) option simply removes the ability to break at the first line of the first GX.
How does the GX Debugger Work
By enabling the debugger on a GX, you can step at run-time through the GXC code of the GX. You can place break points in the code and search for strings. Furthermore, this process gives you access to the memory stack as well as the ability to modify the stack at run-time. The GX Debugger Interface displays a typical GX debugger session. If you are familiar with Microsoft’s Visual Studio or a similar development environment, you will easily adapt to using this debugger.
The image below shows an open GX Debugger window:
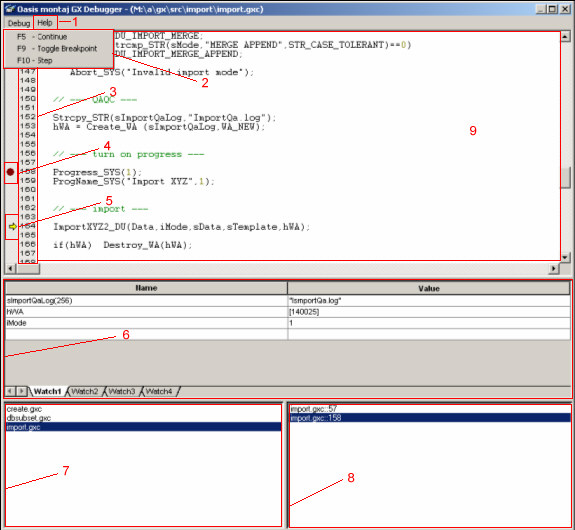
Debug Operations
2 - in this popup menu you can choose to continue, step or toggle a break point at the cursor. However, the shortcuts shown (F5, F9 and F10) are usually the preferred way of executing these actions.
Gutter
3 - this is where line numbers, breakpoints and the current line of execution are shown.
Breakpoint
4 - you can set/unset breakpoints at the current cursor position by hitting F9. The debugger allows you to set breakpoint on any line in any of the files preloaded into the file list. Many lines do not actually contain any execution code and the debugger will skip over break points in these lines even if you set a breakpoint on them. Problems also arise on multi-line statements where the breakpoint will only be caught if set on the last line of the GX.
Current Line of Execution
5 - if no such symbol exists in the file you are currently viewing, the current position of the GX execution is elsewhere in one of the other files in the File List when you hit F9.
Watch Window
6 - the watch window contains four tabs where you can add watches to variables in the debugged GX’s. Add a watch by typing the variable’s name in the Name column. If a variable is not in the current scope, it won’t be displayed. The size of strings and arrays are indicated in parentheses following the variable name. The second column, Value, contains the values of the watch variables. In the case of string, int and real variables you will be able to edit the values before stepping to the next line of execution or continuing the GX run. Object handles are treated differently. The numeric value of the objects handle is shown in square braces. When a handler for an object exists (at the moment only IPJ, PLY and META are supported) a double click on the handle value will pop up an editor or viewer for the object. In some cases, only a simple string representation will be presented in a read-only text box (currently the case for IPJ and PLY), and in other cases a full-fledged editor will be started (META is a good example).
Breakpoint List
8 - this list shows you all breakpoints active in your session. Double clicking on these will take you to the location in the source code.
Source Code
9 - this window displays colourized source code of one of the files in your File List.
Application Notes
There are dividers between the different parts of the debugger window that enable you to resize the parts to individual preference. The whole window can also be resized. The positions will be remembered for the duration of the debugging session.
The watch windows are not the only way to inspect variables’ values. If you hover over a variable in the source code, a tool tip will pop up displaying its value.
When stepping (F10) to the next line of execution, and the GX is terminated, the debugger will retain the stepping mode. This means as soon as one of the GX’s in the file list is run, the debugger will pop up and display the current line of execution at the first executing line in that file. Another handy feature of stepping is that you may ‘step into’ GX’s in your file list by hitting F10 on a iRunGX_SYS call to such a GX.
Currently there is no checking for consistency between the GX binaries and the source code. If an outdated binary is used with newer source code, the breakpoints and source window may display wrong information and can cause confusing situations. For example, a blank line may be the current line of execution or none of your breakpoints will stop the execution of the GX.
Dummy values will always be shown as an asterix character ‘*’. Similarly, you can change a numeric value of a variable to a dummy by typing an asterix in the Values column.
A specific element in the array may be indicated using square braces containing the 0-based index into the array. When you attempt to view an array by typing its name in the Name column, it will show the first element (VariableName[0]) in it.
Got a question? Visit the Seequent forums or Seequent support
© 2023 Seequent, The Bentley Subsurface Company
Privacy | Terms of Use