Grid Data - Grid Preview Tab

The Grid Preview pane offers an interactive view of the output grid based on the current gridding method and parameters.
The preview pane is responsive to all of the parameters in the left-side pane, and while some changes can be more subtle than others, the view is dynamically updated every time any of these parameters change.

The default Geosoft colour table (colour.tbl) is used to display the grid in the preview pane. To change the default colour table, use the Settings > General option under the Project menu.

Grid Preview toolbar options

Auto-Refresh

At the onset, the view in the preview pane is empty and the Auto-Refresh option is "on".

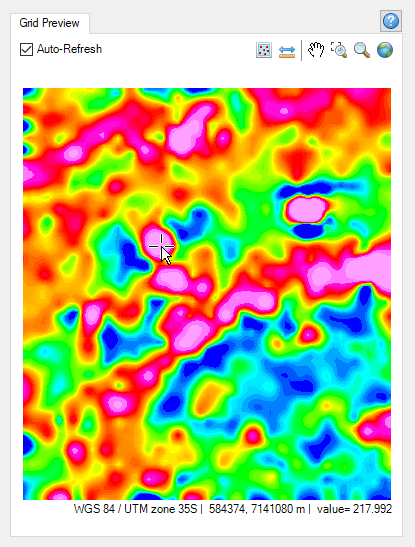
With the option checked, select a data channel to grid, and the output grid calculated with the current gridding parameters is displayed in the pane. The toolbar buttons will become enabled. Hovering the mouse over the view will display at the bottom of the pane the coordinate system as well as the X, Y, and grid data values at the cursor location.

The Auto-Refresh option is "off" by default when the "Multi-trend" gridding method is selected. A warning icon is placed adjacent to the Auto-Refresh box; the icon's tooltip alerts you that the multi-trend grid preview is slower than other grid preview methods. Check this option if you still want to generate a grid preview.

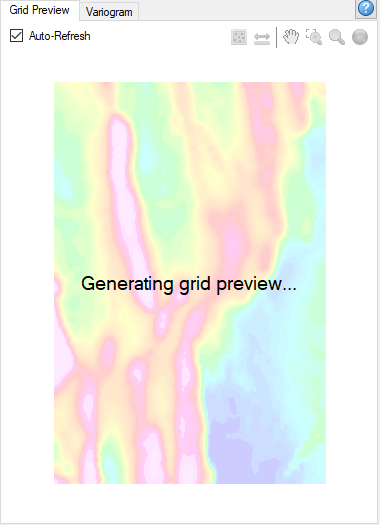
While generating the grid preview (e.g., when the Krigging method is selected), an informational message will be displayed in the centre of the Grid Preview window, which will have 80% transparency applied. To speed up grid previewing, you may want to increase the cell size or reduce the grid extents.

The grid preview is regenerated every time the data to grid selection, the cell size, or any of the parameters under the Extents and Data and Interpolation tabs are changed.

If you want to make changes to any parameters without triggering a redraw/refresh of the grid preview, un-check this option (Auto-refresh) and the preview generation will be paused (the preview grid remains frozen/paused in its last state). When selecting back the checkbox, the preview window will reflect all the changes made to the gridding parameters while the checkbox was deselected.

The Auto-refresh selection is remembered on subsequent uses of the Grid Data tool.

Script Parameter: GRIDDING_TOOL.AUTOREFRESH [0 – disabled; 1 – enabled]

Show Points

Use this button to toggle the data point locations on/off.

  • When the button is active, the locations of data points are displayed on top of the grid as black scaled circles.
    All the X, Y point locations in the database are shown on the preview pane regardless if a mask channel is applied or not to the gridding parameters. This will allow to not only see the effect of the mask channel but also to see the data that is being excluded by that mask.
  • When the button is deactivated, the locations of the data points are no longer displayed.

Measure Distance

Use this option to measure the distance between points on the grid. With the cursor changed to a cross-hair, click the left mouse button to locate the starting point. Then, click the left mouse button again to locate the ending point. The distance (in units of X, Y data) is displayed in the lower right corner of the preview pane.

Pan

Click this button to move around in the view. Click the left mouse button and while holding the button down, move the hand cursor to pan around the current grid area.

Zoom to Box

Click the button to activate the option: using the mouse cursor, draw a box around the desired area, then release the cursor to zoom to the selected location. Click the Zoom to Full Extents button to return your zoomed image to the original full size.

Zoom In/Out

Click this button to zoom in and out of the displayed view: use the scroll wheel on your mouse or the mouse left button to click and drag in and out of the view. The preview window will resize proportionately in both directions (when zooming in/out). Click the Zoom to Full Extents button to return your zoomed image to the original full size.

Zoom to Full Extents

Click the button to display the whole grid area in the preview pane.