Diurnal Drift
Use the Diurnal Drift option (geogxnet.dll(Geosoft.GX.AirborneQC.DiurnalDrift;Run)*) from the Airborne QC menu to flag diurnal magnetic readings that exceed the acceptable deviation. Diurnal variations should be very smooth and gentle during the course of the day’s survey.
Diurnal Drift dialog options
|
Input database file
|
Select the database from which you wish to calculate the diurnal magnetic deviations. This field is auto-populated with the name of the active database.
|
|
Diurnal channel
|
Select the diurnal magnetic channel.
Script Parameter: QCDIURNL.DCHAN
|
|
Time channel
|
Select the time channel.
Time channel values must be stored in decimal hours.
Script Parameter: QCDIURNL.TCHAN
|
|
Diurnal deviation greater than
|
Input the permissible diurnal deviation (in nanotesla) during the time chord specified (see below). By default, it is set to 5 nT.
Script Parameter: QCDIURNL.ALLDEV
|
|
Over a chord of time less than
|
For each diurnal magnetic reading, the deviation is checked over a chord of time of the length specified in minutes. The default is set to 2 min, meaning that at each reading location, the diurnal deviation must not exceed 5 nT in less than a 2-minute chord (period) of time.
Script Parameter: QCDIURNL.TIME
|
|
Plot results
|
Specify if the outcome (flight lines, flagged locations, legend) should be plotted on the current map, on a new map, or not at all:
- Existing map: this is the default option. If the legend group already exists on the map ('LEGEND_QC_<database>' in the Base view), new legend items will be added to it. If this group already exists and contains a survey path ('PATH_<database>' group in the Data view), the path will not be replotted, and the Line Attributes tab in the expanded section will not be active. The Flag Attributes tab will allow you to customize the colour, thickness, and offset from the survey path of the flagged locations.
- New map: the Line Attributes tab in the expanded section is active and prompts for the label size and position as well as the colour, thickness, and break on gaps of the survey path.
- Do not plot: the output plot will not be generated. The two Attributes tabs are hidden.
In order to visualize multiple QC test results on the same map, flag symbols signifying data that are outside of specifications are plotted using a unique colour and offset for each QC test.
Script Parameter: QCDIURNL.MAP [0 – Display on current map (default), 1 – Display on a new map, 2 – Do not plot]
|
|
Map name
|
Specify the name of a new or existing map on which to plot the results. The map will open in the foreground. If the map is new, you will be prompted to interactively specify the location of the legend. New information will be added to the map; the legend will indicate the line path colour as well as the colour of the flagged locations and the percentage of the survey that is not within the specifications.
When a new map is generated, the map is scaled to the input database extents, and the map projection is set to the projection of the database.
Script Parameter: QCDIURNL.MAP_FILE
|
[More]
|
|
Flag Attributes
|
|
Colour
|
Readings exceeding the specified tolerance are indicated by colour-coded symbols along the survey path. Select a colour for plotting these symbols. By default, this is set to blue.
Script Parameter: QCDIURNL.FLAG_COLOR
|
|
Thickness
|
Specify the symbol size in mm. By default, this is set to 0.2.
Script Parameter: QCDIURNL.FLAG_THICKNESS
|
|
Offset
|
Specify the symbol offset (the distance from the survey line) in mm. By default, it is set to -0.2.
A negative value will plot the symbols to the left of the survey line; a positive value will plot the symbols to the right of the survey line. Set the offset to 0 to plot the symbols on top-of-the-line path.
Script Parameter: QCDIURNL.FLAG_OFFSET
|
|
|
Line Attributes
|
|
Colour
|
Select a colour for plotting the line path. By default, the colour is set to black.
Script Parameter: QCDIURNL.LINE_COLOR
|
|
Thickness
|
Specify the line thickness in mm. By default, it is set to 0.15.
Script Parameter: QCDIURNL.LINE_THICKNESS
|
|
Label location
|
Select the labels position relative to the ends of the lines:
- End (default): the labels are displayed centered off the ends of the line.
- Above: the labels are displayed above the ends of the lines.
- Below: the labels are displayed below the ends of the lines.
- None: the line labels are not plotted.
Script Parameter: QCDIURNL.LINE_LABEL_LOCATION
|
|
Label size
|
Specify the labels size in mm. The default is 2.5.
Script Parameter: QCDIURNL.LINE_LABEL_SIZE
|
|
Break on gaps>
|
Specify the maximum gap (in units of distance) before breaking the line. The default is 0 (no gap).
Script Parameter: QCDIURNL.LINE_BREAK_ON_GAPS
|
|
Application Notes
This GX enables you to identify and remove points and lines in the database that exceed the background magnetic diurnal variation by a predetermined amount.
By default, it operates on the current database and assumes that the database contains a time channel and a diurnal channel representing the magnetic data recorded at a synchronized magnetic base station.
Quality Control Specification and Indicators
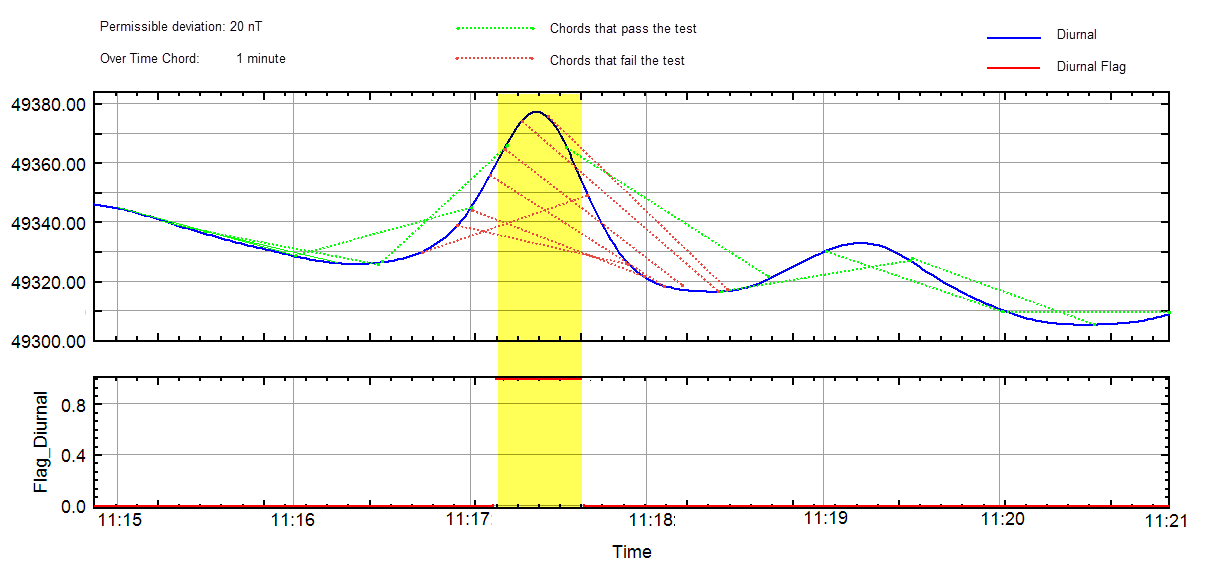
For each consecutive time chord, the GX looks at the difference between the diurnal mag and the straight line joining the end points of one time chord. If none of the differences along the segment exceed the permissible deviation, it is flagged as "acceptable" (flag=0); otherwise, it is flagged as "unacceptable" (flag=1). The GX then moves by one point and applies the same logic.
The flag and the maximum difference are saved at the mid-point of the moving chord window.
The maximum difference may occur at any point along the window; however, it is saved in the row representing the mid-point of the window.
As a guideline, you could set the length of chord (specified in minutes) to the average length of time required to fly between adjacent tie lines. The specified time is converted to the average number of data points in the time chord. This average is calculated independently for each line of data.
The GX creates two channels that will be automatically displayed in the active database:
- Flag_Diurnal: this channel contains a value of 0 or 1: 0 indicates points within the specification (i.e., diurnal variation is acceptable), and 1 represents points which fail the test (i.e., exceed the limit within the specified time period).
- Diurnal_Dev: this channel contains the maximum diurnal deviation of the segment. This can be compared directly against the Flag_Diurnal channel, as all values greater than the input maximum will have a flag value set to 1.0.
*The GX tool will search in the "...\Geosoft\Desktop Applications \gx" folder. The GX.Net tools, however, are embedded in the geogxnet.dll located in the "...\Geosoft\Desktop Applications \bin" folder. If running this GX interactively, bypassing the menu, first change the folder to point to the "bin" folder, then supply the GX.Net tool in the specified format.
