Inline Survey Quality Control
Use the Quality Control > Inline Survey menu option (IP QC GX) to perform quality-control operations on raw samples in the current IP database.
Inline Survey Quality Control dialog options
|
Channel to QC
|
Select the channel to inspect, from the drop-down list. Both single value and array channel may be selected. The data of the current point or array is then displayed on the graph, located at the top-right of the window.
Hotkey: While the channel entry is in focus, use the ↑↓ keys to move up and down through the channels.
|
|
Line to QC
|
From the drop-down list, select the line to inspect.
Hotkeys: While the line entry is in focus, use the ↑↓ keys to move up and down through the line list.
|
|

(Plot pseudo-section)
|
Create/Update the pseudo-section of the current channel along the selected line. If the channel to QC is an IP array, the pseudosection of the element in focus will be produced. The pseudo-section is linked to the QC tool. |
|
Grouping
|
For the current line and channel, the data can be sorted for inspection by the primary transmitter location (default) or by station. Select the grouping of your preference. Once selected, the grouping graph along the bottom of the dialog will show the corresponding grouping (see Grouping graph).
|
|
Location
|
The position of the station/transmitter for the current data point/array, in the active coordinate system.
Use the arrow keys to move through the data, one station/transmitter location at a time.
Only raw data values are displayed. The averaged data values are skipped. The raw & averaged values are flagged respectively in the Type channel as 0 & 1.
In the case of duplicate readings, all samples are displayed. The sample in focus is outlined. The average of the accepted samples is displayed on the graph in grey. The initial state is to accept all values. Accepted values are shown in green.
Hotkeys: Use the → & ← key strokes to move easily in the grouping through the stations/transmitters.
|
|
N
A
|
The data displayed on the graph is further grouped by N values. Finally, the data is sorted by A values calculated from the transmitter/receiver separations.
In cases where the N value is undefined, sorting is done solely by station (or transmitter) number.
Hotkeys: Simultaneously use the Ctrl_→ & Ctrl_← key strokes to move through the data points.
Alternatively, when the N entry is in focus, use the H & N keys to move through the N value.
Data that share the same Station/Transmitter & N values are displayed together. The filtering is done based on the combination of Station/Transmitter & N values rather than the surface electrode positions. When multiple rows are identified to share the same Station/Transmitter & N value, do not automatically assume they are duplicate readings. Inspect them closely to identify if they are duplicates or simply share their Station/Transmitter & N values. A useful indicator would be to check the data columns for the degree of divergence in the data. In the case of multiple readings, all samples are displayed. The sample in focus is bolded. The average of the accepted samples is displayed on the graph in grey. The initial state is to accept all values. Accepted values are shown in green.
|
|
Data point
|
The index of the data element indicated with a cursor on the graph. For normal channels, this is just 1 of 1, but for array channels, it gives the window number, starting with an index of 1 (unlike array indices in the database, which begin at 0).
If multiple samples coincide - that is, if they have the same Station & N values - they will all be displayed. To select any one of the coinciding samples, click on the desired sample in the table located at the bottom of the dialog window. The selected sample will be outlined in black on the graph.
|
|
Data value
|
The current value at the displayed index. This entry is editable.
Once the line or channel is changed, changes are committed to the database, even if Cancel is subsequently used to exit the Quality Control Tool.
|
|
Mask selected
|
This check box becomes active only if the inspected channel is an array channel. It allows you to set the state of individual elements in the array. |
|
QC Channel
|
Two QC mask channels are provided. By default, all values are accepted. It is recommended to use the QC mask channel to reject bad readings. The points on the graph are colour coded according to the selected QC channel. For Zonge Field data (FLD), the recorded QC data is loaded into the QC IP channel.
|
|
Acceptance
|
The data value or entire array in focus can be Accepted, Flagged or Rejected. The selected QC channel value reflects the user choice as:
-
Accepted → 1 - These values are used in all calculations
-
Flagged → 2 - These are ignored in calculations, but annotated in square brackets on pseudo-sections
-
Rejected → * - These values are always ignored
To flag values as [TN], set the data value to –9999 and set the QC to Flag.
Hot Keys: Use A, F and R to Accept, Flag and Reject samples.
|
|
Recalculate
|
Click on the Recalculate button to push the current changes made in the QC tool to the database. |
|

|
Push the updates in the database to the QC tool. |
|
Grouping graph
|
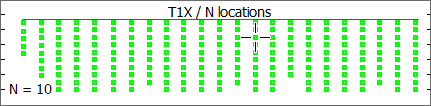
Grouped by TX1: This graph displays the N values vs TX1 locations. Use this graph to move the cursor directly to the desired TX1-N combination, and view the corresponding data in the Data graph.
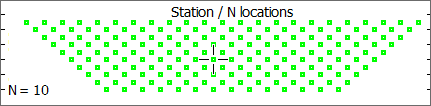
Grouping by Station: This graph displays the N values vs Station locations. Use this graph to move the cursor directly to the desired Station-N combination, and view the corresponding data in the Data graph.
The Grouping graph is linked to the data graph located in the upper-right corner of the dialog, as well as to the database and the open pseudo-section map, should one be displayed.
|
|
Sample table
|
The table along the bottom of the QC tool shows the relevant channel values of the currently selected sample. All relevant samples associated with the current selection are displayed in this table. The sample that is currently in focus is bolded. Clicking on the desired sample in the table will move the focus to the selected row. |
|
Data graph
|
The Data graph shows the selected data channel values for the current selection of rows displayed in the data table.
The vertical axis scales automatically to the current selection of data. You can fix the scale by checking the Fix box. Both the minimum and maximum values of the data range are editable.
When looking at an IP array, you can select multiple array elements by holding the Ctrl key down. Selected points are highlighted. The same masking can then be applied to all the selected points.
|
Application Notes
The QC tool is linked to the database, the pseudo-section plot and the 3D view. You have access to all these objects while running the QC tool and as a result, you can position the linked windows for optimal visibility.
This special linking is based on the Line and Fiducials and has several advantages, including the fact that it now handles duplicate samples uniquely. However, this type of linking relies on the order of the data in the database remaining the same as when you plotted the pseudo-section map, as each symbol in the section remembers which row and line it is associated with. If you sort the database, or change the row-order in any way you will break the linking.
This is an interactive tool and thus does not have scripting parameters.
To use the single character hotkeys, you have to first select the item you would like to work with. The hotkeys are not case sensitive, however they are contextual. You have to be in the proper context for the hotkey to take effect.
For example, if you just selected a channel, the context is the channel and if you click R you will get the first channel that starts with an R rather than Reject.
| HotKey |
Description |
| A |
Accept |
| B or ←
|
Previous sample |
| D |
Delete (same as reject) |
| F or S |
Flag |
| H or ↑ |
PreviousTx/Stn |
| N or ↓ |
Next Tx/Stn |
| M or → |
Next sample |
| R |
Reject (same as delete) |
| S |
Flag |
