
View Histogram
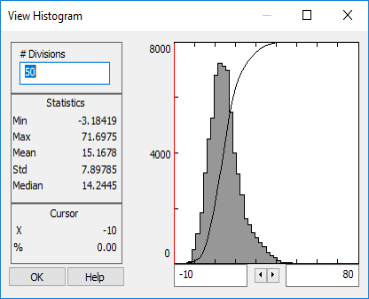
The histogram covering the data of the provided input grid(s) is calculated and displayed in the View Histogram dialog. Click in the histogram window, and the bin value and the cumulative number of points as a percentile, at the cursor location, are reported in the Cursor section.
|
# Divisions |
Modify the number of bins (divisions). |
|
Change min and max values |
Specify new minimum and maximum values for the colour scheme file in the entry fields below the Histogram window. |
See Also:
Got a question? Visit the Seequent forums or Seequent support
© 2023 Seequent, The Bentley Subsurface Company
Privacy | Terms of Use