
Normal Distribution
The Normal Distribution assumes the data has a symmetrical gaussian distribution around the mean value of the data. In order to divide the area under the gauss curve into equal incremental areas for each colour, the horizontal increments have to be reduced around the mean of the data distribution and increase moving away. The rate at which the increments increase is calculated on a normalized gaussian distribution and provided as coefficients for scaling the equal increments with.
Zone Colour Ranges using Normal Distribution
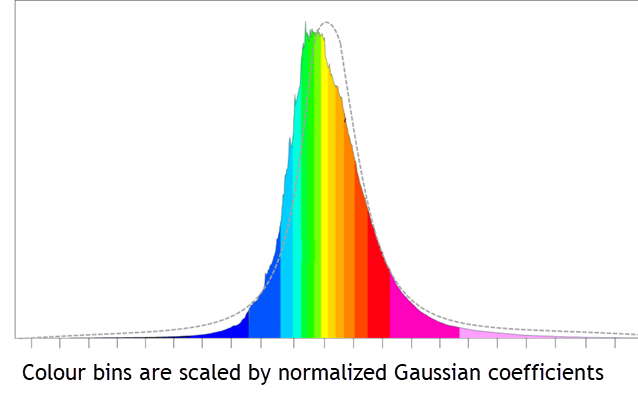
This method first divides the range into equal increments, as indicated on the illustration below with the grey ticks. Then these increments are scaled using the calculated coefficients for a symmetrical normal distribution (illustrated with the grey dashed line) to reduce the increments around the mean and increase them away from the mean. In the illustration below, the normal distribution increments are adjusted to occur at the colour breaks.
If the data is skewed, the central colour (yellow below) will be offset from the mean of the data.
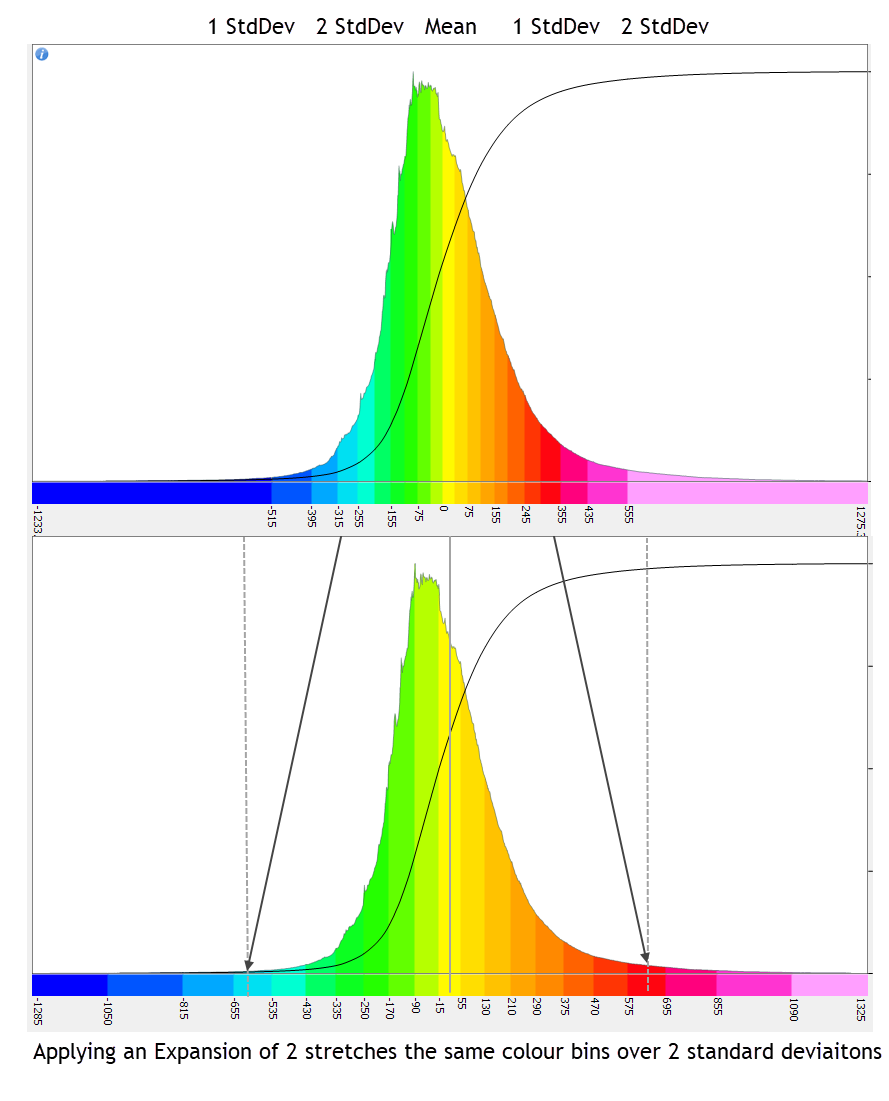
The expansion factor is multiplied by the standard deviation before calculating the colour breaks. This results in the same number of bins to be distributed over the expanded standard deviation.
If a contour level is defined, once the colour distribution is fully calculated, values between the min and max are adjusted to the nearest multiple of the contour interval. In the above illustration, a contour interval of 5 has been used.
Got a question? Visit the Seequent forums or Seequent support
© 2023 Seequent, The Bentley Subsurface Company
Privacy | Terms of Use