
Edit MAPPLOT Template
Use the Edit MAPPLOT Template dialog to modify a map template based on existing default formats. The dialog opens from the MAPPLOT Template Manager.
Edit MAPPLOT Template dialog options
|
Template name |
The name of the template you want to edit is displayed. |
|
|
Map style |
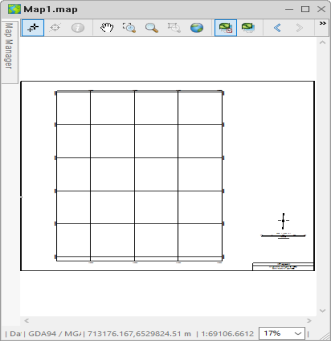
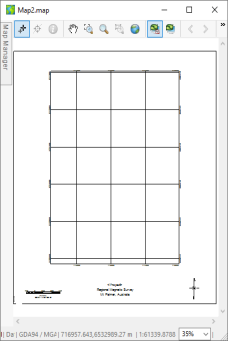
Select either a Full Map (select Map) or Figure (select Figure) style map. The Full Map style is normally used for A1/A0 size maps, the Figure style map for A3/A4. |
|
|
Media size |
Select from a variety of metric (A4, etc.) and imperial standards (letter, etc.) |
|
|
Layout |
Select from one of the two options:
|
|
|
Fixed or minimum size |
Select the size on page: |
|
|
Map margins (cm.) |
Specify the margin width in cm for bottom, right, top, and left margins. |
|
|
Inside data margin |
Enter the margin width between the data and map surround in cm. |
|
|
Positive plot direction |
Specify the direction in which x is positive (left or right). |
|
|
Vertical reference angle |
Enter the angle (counter-clockwise in degrees) at which a line is considered vertical. Any line up to this angle is considered vertical (Default is 67.5). |
|
Application Notes
This GX only runs in interactive mode.
The system provides a variety of default templates that enable you to create your own standard maps with logos, custom layouts and other elements as required. For example, you may use the default A4 or A3 templates to create your own layout that you use regularly for map-making.
Map templates are currently saved permanently in your system so when you are learning the system, we suggest you experiment using the same template until you are ready to create a final version with a custom name. You may want to make up a testing template, called TEST, for example.
Full map and figure style layouts:
See Also:
Got a question? Visit the Seequent forums or Seequent support
© 2024 Seequent, The Bentley Subsurface Company
Privacy | Terms of Use