
The Profile Window
The Profile window enables you to display channel data in profile graphical format. It consists of profile panes (in which the data are displayed), horizontal and vertical scale areas and a slider bar for manipulating the view of the profiles in the window.
![]() Click to view the parts of the profile window
Click to view the parts of the profile window
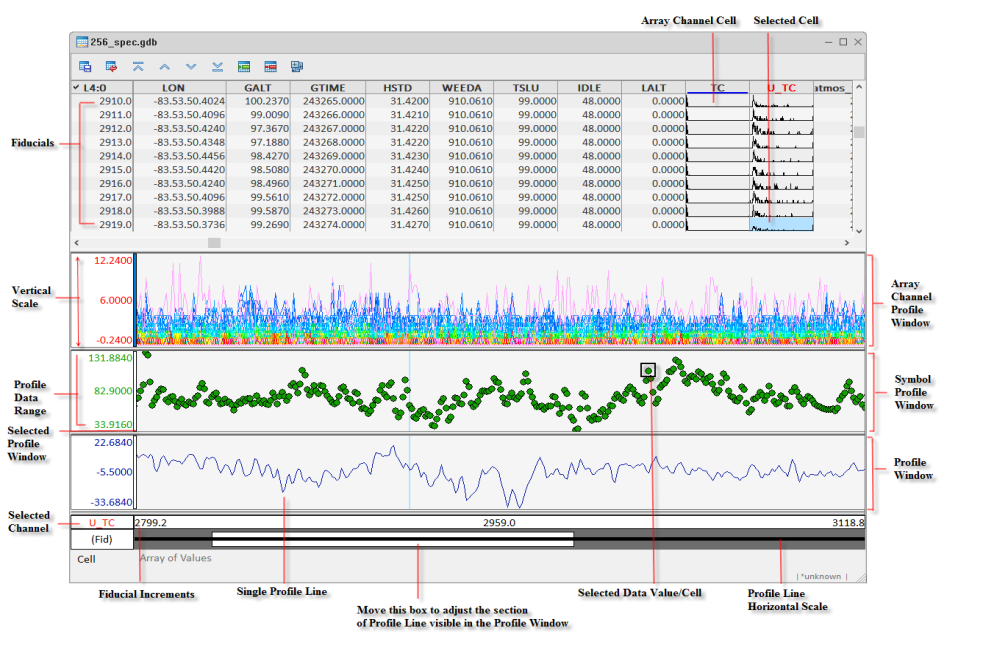
Each displayed profile will have a different colour to match the colour of the corresponding channel header cell. The vertical reference scales on the left side of the profile windows are also colour coded and will change depending on which channel is currently selected in the spreadsheet window.
You can have up to five profile panes open at once, and each pane can have up to 32 profiles displayed for a total of 160 profiles simultaneously.
How Do Profiles Work?
The Profile view is your "graphical window" to the Geosoft database. You can display profiles of one or more variables in your database simply by selecting a channel and then selecting the 'Show Profile' context menu item. The profile appears directly below its corresponding database in the profile window.
Profiles and Linking
Profile windows are linked dynamically to their corresponding database. When you select a value or range of values in either the database or profile window respectively, they are also highlighted in the other window.
This capability keeps you in touch with your data and gives you an interactive means of accomplishing quality control or analysis tasks.
See Also:
Got a question? Visit the Seequent forums or Seequent support
© 2024 Seequent, The Bentley Subsurface Company
Privacy | Terms of Use