|
Channel to grid
|
(Display only) The select channel to be gridded.
|
|
Output grid
|
(Display only) The selected output grid.
|
|
Grid cell size
|
(Display only) The grid cell size.
|
|
Xmin, Ymin,
Xmax, Ymax
|
The minimum and maximum X and Y coordinates of the grid.
-
Leave this field blank to create a grid that covers the entire dataset.
-
To grid a subset of the data, specify the bounds of the desired rectangular area.
-
To default any value while preserving field order, use commas as placeholders.
Example: ,#,#,# sets only Ymin, Xmax, and Ymax, with Xmin defaulting to its maximum extent plus the blanking distance.
If a blanking distance is not specified, the grid will extend to the data's maximum limits plus eight times the grid cell size.
Script Parameter: RANGRID.XY
|
|
Log option
|
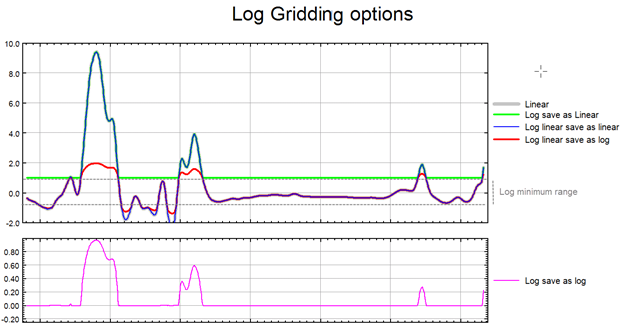
Choose whether to grid the original data or its logarithmic (base 10) form. Gridding in log space can help reduce distortion in highly skewed data, such as geochemical measurements.
Available options:
- linear: Grid the data as-is.
- log, save as linear: Grid the base-10 log of the data (in logarithmic space). Any values below Log minimum are clipped at that threshold. The resulting grid is converted back to linear space before being saved to a grid file.
- log-linear, save as linear:
- Values above the positive Log minimum and below the negative Log minimum are gridded in logarithmic space.
- Negative values are temporarily sign-flipped to compute logs, then flipped back.
- Values outside the ± Log minimum range are converted back to linear space post-gridding and scaled to ensure boundary continuity.
- Values within the ± Log minimum range remain intact and are gridded linearly.
- Finally, the linear representation of the data (in both ranges) is saved to the grid file.
- log, save as log: Same as log, save as linear, but grid values are kept in log space - the gridded data is saved to the grid file in its logarithmic representation.
- log-linear, save as log: Same as log-linear, save as linear, but the grid values are not converted back from log space. The output grid remains in logarithmic space with large amplitude anomalies being somewhat moderated.
Script Parameter: RANGRID.LOGOPT
linear: 0
log, save as linear: -1
log-linear, save as linear: -2
log, save as log: 1
log-linear, save as log: 2
|
|
Log minimum
|
When gridding in logarithmic space (see Log option above), this parameter sets the minimum threshold value. The default is 1.
Script Parameter: RANGRID.LOGMIN
|
|
Low-pass desampling factor
|
The de-sampling factor as a multiple of the grid cell. This factor effectively acts as a low-pass filter by averaging all points into the nearest cell defined by this factor.
For example, a factor of 3 would first average database points into a coarse grid whose cells size is 3 times the final cell size. The default is 1, producing no pre-filtering other than de-aliasing by averaging points within a cell. If the resulting grid is too noisy around data points, increase the desampling factor.
Script Parameter: RANGRID.DSF
|
|
Blanking distance
|
Grid cells located farther than the specified blanking distance from any valid data point will be assigned dummy values in the output grid. The default is calculated as: Ideally, set this parameter to slightly greater than the maximum distance over which interpolation is required. Ideally, set this parameter to slightly greater than the maximum distance over which interpolation is required.
Script Parameter: RANGRID.BKD
|
|
Tolerance
|
Specify the allowable absolute error per grid cell (in grid data units). The default is 0.1% of the observed data's maximum range.Lowering the tolerance increases grid accuracy.
Script Parameter: RANGRID.TOL
|
|
% pass tolerance
|
The minimum percentage of points that must meet the specified tolerance. The default is 99%.
For a higher-quality grid, consider increasing this threshold.
Script Parameter: RANGRID.PASTOL
|
|
Maximum iterations
|
Iterations at the finest coarseness level will stop when the maximum number or iterations is reached (default is 100). At each greater coarseness, the maximum iterations is reduced by 2.
Increase this value if more iterations are required to produce a more accurate grid.
Script Parameter: RANGRID.ITRMAX
|
|
Starting coarse grid
|
Select a value of 16, 8, 4, 2, or 1 to set the desired coarseness of the starting iteration level relative to the final grid cell size. By starting with a coarser grid, the algorithm is able to produce a reasonable result in under-sampled areas. As the coarseness decreases, the algorithm becomes more sensitive to local features. Only reduce the starting coarseness from 16 if faster processing time is required.
Script Parameter: RANGRID.ICGR
|
|
Starting search radius
|
Set the maximum search radius used to establish starting grid values for the coarse grid. Default: four times the coarse grid size set by the Starting coarse grid parameter. If no data is found within this radius, the mean of all data is used as the starting value.
If the search radius is too small, the starting grid can be a poor approximation of the desired grid, resulting in excessive processing time.
A radius that is too large may unnecessarily delay coarse grid generation.
Script Parameter: RANGRID.SRD
|
|
Internal tension (0-1)
|
The degree of internal tension (between 0 and 1). Default: 0, resulting in a true minimum curvature grid with no tension.Increasing tension can be used to prevent overshooting of valid data in sparse areas; however, curvature in the vicinity of real data will increase. In general, the sparser the areas in the data—with localized highs and lows— the higher the tension should be set.
Script Parameter: RANGRID.TENS
|
|
Cells to extend beyond data
|
This is the number of grid cells to extend beyond the outside limits of the data. The default is the integer value of blanking distance/grid cell size.
If the X and Y range values aren’t explicitly defined, the grid size defaults to the actual data range plus this value (the specified number of cells).
This parameter is typically used in conjunction with the blanking distance parameter. For best results, use the blanking distance to control coverage around the data, and use this parameter to set the default grid size – with this distance generally being smaller than the blanking distance to provide clipping around the grid.
Do not use this parameter in place of the blanking distance to fill interior regions of the grid. It yields inferior results because blanking distance measures the true radial distance between a given location and the nearest data point, whereas cells to extend beyond data is measured only in the X or Y. Since the blanking distance is a true distance and this parameter is a count of grid cells, you must multiply the number of cells by the actual cell size to compare the two properly.
Script Parameter: RANGRID.EDGCLP
|
|
Weighting power
|
Weighting power is used to generate the coarse starting grid. Within each coarse cell, values are weighted by the inverse of their distance from the coarse grid nodes, raised to this power.The two weighting settings, weighting power and weighting slope, can be used to reduce high-frequency aliasing that may occur when gridding at overly coarse intervals.
Script Parameter: RANGRID.IWT
|
|
Weighting slope
|
Weighting can be further refined using the slope parameter. The overall weighting is determined by the following expression:

Where:
- distance is in grid distance units.
- power is applied to the distance.
- slope is in cell units; the default is 0.0, meaning only the nearest data points influence the weight at each grid node.
To grid anisotropic data, set the weighting slope greater than 1. For instance, in aeromagnetic survey data with 200-metre line spacing and readings taken every 5 metres along the lines, a 50-metre cell-size block will include a large number of real data points to be combined into a single weighted location and z value. In such cases, setting the weighting slope to 5.0 will yield a smoother, non-aliased outcome relative to using a slope of 0.0.
Script Parameter: RANGRID.WTSLP
|
Prior to gridding the data for the 2 log-linear options the data is altered as follows:
The illustration below intends to convey the variation between the various log options.