
Create Colour Zone File
Use the Grid and Image > Display on Map > Create Colour Zone File option (GRIDZONE GX) to generate a colour zone file from statistics compiled across multiple grids.
Create Colour Zone File dialog options
|
Output colour table |
Specify the name of the output zone file. Supported formats include:
Script Parameter: GRIDZONE.FILE |
|
Grid name 1 |
First grid name (required). Script Parameter: GRIDZONE.GRID1 |
|
Grid name 2 |
Second grid name (optional). Script Parameter: GRIDZONE.GRID2 |
|
Grid name 3 |
Third grid name (optional). Script Parameter: GRIDZONE.GRID3 |
|
Grid name 4 |
Fourth grid name (optional). Script Parameter: GRIDZONE.GRID4 |
|
Grid name 5 |
Fifth grid name (optional). Script Parameter: GRIDZONE.GRID5 |
|
Colour table |
Select the colour scheme to render the colour zone file. Hover over a colour scheme to display its name and location. To change the selection, click the colour bar and browse the available scheme categories. Script Parameter: GRIDZONE.COLOR |
|
Colouring method |
Select one of the following colouring methods:
Script Parameter: GRIDZONE.METHOD [1 – Linear; 2 – Normal distribution; 3 – Histogram equalization; 5 – Log-linear] |
|
Contour interval |
Specify the contour interval used to round colour bin values. See Application Notes for details. Script Parameter: GRIDZONE.CONTOUR |
|
[Histogram] |
Click the button to open the View Histogram dialog. A combined histogram of all input grids is calculated and displayed. In this dialog, you can:
Close the dialog to save the changes to your customised colour zone file. |
Application Notes
The selected grids are scanned sequentially to determine the data range. For the Normal distribution and Histogram equalization methods, the grids are re-scanned to compute statistics.
No normalization by cell size is performed; elements are considered individually when building the statistics and histogram.
Contour Interval and Colour Bins
The contour interval controls how the numerical values defining each colour bin are rounded before being written to the output colour table (*.zon, *.itr, or *.lut). This directly determines how many distinct colour zones are created.
-
A contour interval of 0 preserves the full precision of the calculated bin values.
-
A non-zero contour interval rounds bin boundaries to the specified interval, which can merge adjacent bins and reduce the total number of colour levels.
This effect is illustrated below:
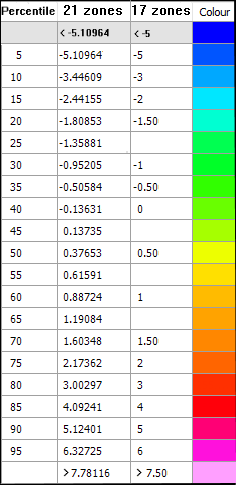
The second column shows the default calculation for 21 colour levels (zones) using a contour interval of 0 (unrounded bin values).
The third column shows the same values rounded to a 0.5 interval, resulting in fewer distinct zones (17 total).
Choosing an appropriate contour interval
Histogram equalization and Normal distribution:
-
It is generally recommended to use contour interval = 0. The primary advantage of these methods is their ability to highlight variations in the middle of the data range through colour changes. Increasing the contour interval reduces the number of colour bins and diminishes this effect.
Working with multiple grids:
-
Start with Linear colouring — particularly if the data ranges of the input grids do not overlap — as it makes comparison between the grids easier.
After verifying comparability, alternative colouring methods can be applied if needed.
Using a Script to Create a Colour Zone File
A script can be used to create a colour zone file from up to eight grid files, as shown below:
/ LOG OPENED :
/-------------------------------------------------------------------------
SETINI GXRUN.GX="C:\\Program Files\\Geosoft\\Oasis montaj\\gx\\gridzone.gx"
SETINI GXRUN.DIALOG="BROWSE"
SETINI GRIDZONE.FILE=".\\test.zon"
SETINI GRIDZONE.GRID1=".\\Grid1.grd(GRD)"
SETINI GRIDZONE.GRID2=".\\Grid2.grd(GRD)"
SETINI GRIDZONE.GRID3=".\\Grid3.grd(GRD)"
SETINI GRIDZONE.GRID4=".\\Grid4.grd(GRD)"
SETINI GRIDZONE.GRID5=".\\Grid5.grd(GRD)"
SETINI GRIDZONE.GRID6=".\\Grid6.grd(GRD)"
SETINI GRIDZONE.GRID7=".\\Grid7.grd(GRD)"
SETINI GRIDZONE.GRID8=".\\Grid8.grd(GRD)"
SETINI GRIDZONE.COLOR="C:\\Program Files\\Geosoft\\Desktop Applications \\tbl\\geophysics\\colour.tbl"
SETINI GRIDZONE.METHOD="3"
SETINI GRIDZONE.CONTOUR=" "
GX gxrun.gx
/-------------------------------------------------------------------------
/ LOG CLOSED :
/-------------------------------------------------------------------------
Got a question? Visit the Seequent forums or Seequent support
Copyright (c) 2026 Bentley Systems, Incorporated. All rights reserved.
Privacy | Terms of Use