The Modify tab of the Drillhole Symbology pane allows you to create custom symbology styles, or appearances that may be difficult or impossible to create using the Esri symbology tools.
Use the Modify tab to create new custom symbology styles to use with drillhole feature classes or attributes. Examples of symbologies that can be created with this tool are:
2D or 3D Lines colored and sized by values
For any of the above Line types, the Offset control can be used to reposition a data layer symbology from the drillhole trace. In addition, the Align option, available on 2D maps for Lines sized by values or Lines colored and sized by values, allows you to display the data on one side of the hole trace (to the left or to the right), so that another data set could also be shown. By default, the data layer symbology is mirrored on both sides.
The options, when used on various data layers, help to better visualize these "sets" of information (e.g., assay values, lithology, alteration and structural data) on the same map and to identify the relationships between them more easily.
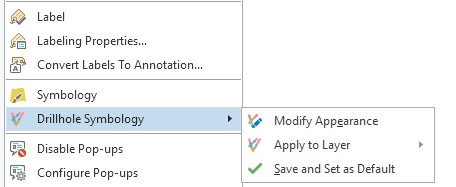
Once you have created or modified a custom symbology using this tool, you can save it by right clicking Drillhole Symbology > Save and Set as Default on the drillhole layer in the Contents pane. This will save the symbology to the current drillhole dataset for future use.