
Find Magnetic Dipoles
Use the Find Magnetic Dipoles option (geosoft.uxo.gxnet.dll(Geosoft.GX.UXO.UxoPeakDipoles;Run)*) to find peak dipoles on a magnetic data grid. The Find Magnetic Dipoles option can be used to either automatically select target location from a magnetic data grid, or to find dipoles near already picked target locations. The targets locations are selected using a grid peak-picking algorithm (Blakely, 1986).
Find Magnetic Dipoles dialog options
Input grid | Specify the input grid name that is to be used for locating the magnetic dipoles. Script Parameters: UXO_PEAKDIPOLES.GRIDFILE |
Minimum positive peak value | Specify the cut-off level of the positive peaks. You may choose to set this field blank, in which case it will internally default to [0.5 * STDDEV + MEAN] where STDDEV and MEAN are calculated from the grid. Script Parameters: UXO_PEAKDIPOLES.MINPOSITIVEPEAKVALUE |
Maximum dipole separation | Specify the maximum distance between the positive and negative peaks belonging to the same dipole. Script Parameters: UXO_PEAKDIPOLES.SEARCHRADIUS |
Find dipoles near existing locations | Select this option to find dipoles that are near existing dipole locations. If this is not selected, the target group will be overwritten. Script Parameters: UXO_PEAKDIPOLES.FIND_CLOSE_DIPOLES |
Target database | Specify the name of the Target database. Script Parameters: UXDETECT.TARGET_GDB |
Group | Specify the name of the "group" to save the target data. This value is the same as the most recently specified target group from any of the other dialogs that require a Target Group. Script Parameters: UXDETECT.TARGET_GROUP |
Mask channel | Specify a name for the target mask channel or select an existing MASK channel from the drop-down list. If the field is blank, no mask will be applied. Script Parameters: UXDETECT.TARGET_MASK |
Dipole amplitude channel | Select the channel that contains the dipole amplitudes. Script Parameters: UXO_PEAKDIPOLES.DIPOLE_AMPLITUDE_CHANNEL |
Survey Database | Select the survey database that contains the channel to be gridded. Script Parameters: UXTARGETLIST.SURVEY_GDB |
[More] | |
Plot target symbols | Select the Plot Target Symbols option to enable the target symbol parameters below. |
Symbol size (mm) | Specify the symbol size in millimetres. |
Plot Legend | Select the Plot Legend to plot a legend to your map. You can specify a location for the legend either by typing its upper-left coordinates or by clicking the [Locate] button to interactively select a point on the map. |
Legend X (mm) | Specify the upper-left X coordinates for the legend. |
Legend Y (mm) | Specify the upper-left Y coordinates for the legend. |
[Locate] | Click the Locate button to interactively select a point (upper-left X/Y coordinates) for the legend. |
Application Notes
The advantage of using this method over picking Peaks on the analytic signal is that when the operator returns to the field to locate the targets, the instrumentation used generates only magnetic total field readings, and not an analytic signal.
Find the Positive Peak
When there is an existing target list:
When there is an existing target list, and Find dipoles near existing locations is selected, we use the inflection points; we look for the inflection points that fall into the search area of each existing target. If we find more than one inflection point in the area, we pick the closest one. Similarly, as described below for the negative peak, a positive peak is searched for in the data surrounding the inflection point.
When there is an new target list:
When there is an new target list, or Find dipoles near existing locations is not selected, we automatically search for positive peaks using a grid peak-picking algorithm (Blakely, 1986).
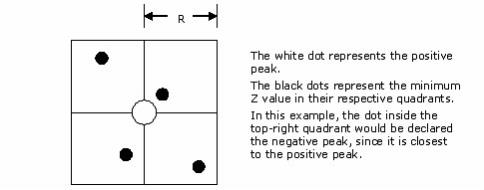
Find the Negative Peak
For each positive peak, the corresponding negative peak is found using the following method:
Extract a window (a square) of dimension 2xR, centred on the XY location of the positive peak
Divide the window into 4 equal quadrants
Find the minimum Z value in each quadrant
Of the four minimum Z values, the one with the smallest [NORMALIZED_DISTANCE_FROM_POSITIVE_PEAK / NORMALIZED_AMPLITUDE] value is chosen as the corresponding negative peak.
Output
The search results will be stored in the following channels:
- X: The X location of the targets
- Y: The Y location of the targets
- Target_ID: The ID number of the targets
- Dipole_Amp: The dipole amplitude, the difference between the positive and negative (Z) values.
- Dipole_Length: The dipole length is the peak to peak length using the XY distance, calculated from the X and Y negative and positive peak channels.
- CPLineNum: The closet survey line, if the survey database is specified
- CPDistAlong: The distance along the survey line to the closest point, if the survey database is specified
- CPFid: The fiducail in the survey database along the line to the closest point, if the survey database is specified
- X_Positive_Peak: The X location of the positive peaks
- Y_Positive_Peak: The Y location of the positive peaks
- Z_Positive_Peak: The Z value of the positive peaks
- X_Negative_Peak: The X location of the negative peaks
- Y_Negative_Peak: The Y location of the negative peaks
- Z_Negative_Peak: The Z value of the negative peaks
If the "Group name" does not exist in the database, the output X and Y channels above will represent the inflection point of each dipole pair.
If the "Group name" exists in the database, it must contain existing X and Y channels that specify the location of existing targets. In this case, 1) the X and Y channels will remain unaltered, and 2) the other channels stated above will contain the dipole information associated with the existing targets. If for a given target a dipole pair is not found, then the corresponding values will be dummies.
If the survey database is specified, the closest point of approach (line and station) to the target location will be determined. In the target database channels will be added that include nearest survey line, fiducial and distance along the line. In the survey database two channels are added the target id and grid value, that contain values at the point nearest to the target locations.
On the current map, if Plot target symbols is selected, the peaks are specified by different colours and symbols: black + for inflection point, blue x for positive peak, and red x for negative peak. Also, the negative and positive peaks are connected thorough a line to show the association between the peaks. In order to distinguish between the peaks and the connecting lines, each is appended to a specific map group: peaks to "PeakPairs" and connecting lines to "PeakPairs_Line".
Reference
- Richard J. Blakely and Robert W. Simpson, 1986, "Approximating edges of source bodies from magnetic or gravity anomalies", Geophysics, vol.51, pp.1494-1498.
Got a question? Visit the Seequent forums or Seequent support
© 2024 Seequent, The Bentley Subsurface Company
Privacy | Terms of Use