
6 Line Test
Use the 6 Line Test menu option (UCE6LINETEST GX) to compare the profiles over a causative body.
6 Line Test: Data Type dialog options
Input data | Select the data type as either an XYZ or a GDB file. Script Parameter: UCE6LINETEST.DATATYPE |
6 Line Test: Input Data dialog options
Input data set | Enter the name of the input data set that contains the surveyed information. Script Parameter: UCE6LINETEST. INPDATA |
6 Line Test: Input Parameters dialog options
Input data set | The name of the input data set is displayed. Script Parameter: UCE6LINETEST. INPDATA |
Data Channel | Select the channel name of the surveyed data. Script Parameter: UCE6LINETEST.ZCHAN |
Main direction channel | Select the coordinate channel that changes the fastest. Script Parameter: UCE6LINETEST.XCHAN |
Orthogonal direction channel | This channel is optional, if entered it corresponds to the channel that is orthogonal to the above entry. Script Parameter: UCE6LINETEST.YCHAN |
Target position along main direction | Specify the actual target location along the main direction, in ground units. Script Parameter: UCE6LINETEST.TARPOS |
Lateral tolerance | Specify the horizontal acceptance tolerance for the location of the peak, in ground units. Script Parameter: UCE6LINETEST.LTOL |
Ignore multi-directional lines | If the 6 lines are collected as one continuous line, select 'No' and the lines will be broken at the turn arounds on the fly. If the 6 lines are collected as separate lines, select 'Yes', so that the occasional backtrack does not cause the line to be broken into sub-lines. Script Parameter: UCE6LINETEST.MULTI |
Horizontal scale (units/mm or blank) | Specify a horizontal scale in units/mm, or leave blank to use a default scale. A default scale is chosen to make the plot window 15 cm wide. The vertical scale is always chosen to create a plot with the same aspect ratio as displayed in the profile windows. Note that to achieve a real map scale (say 1:50000), the horizontal scale of the profile window must be set to a distance channel (right-click when in the profile window and select X Axis Options, the All panel options dialog appears. Select a distance channel to use as X-Axis). If the distance channel is metres, the scale will be 50 (units/mm) for 1:50000. Script Parameter: UCE6LINETEST.SCALE |
Title | Specify a title to display above the graph. Script Parameter: UCE6LINETEST.TITLE |
Project | Specify the project name. Script Parameter: UCE6LINETEST.PROJECT |
Instrument | Specify the type of instrument used in the survey. Script Parameter: UCE6LINETEST.INST |
Operator | Specify the operator's name. Script Parameter: UCE6LINETEST.OPERATOR |
6 Line Test: Line Selection dialog options
Normal pace | Select the line that includes data collected using a normal (regular) pace. Script Parameter: UCE6LINETEST.REGLINE1 |
Normal pace opposite direction | Select the line that includes data collected using a normal pace in the opposite direction. Script Parameter: UCE6LINETEST.REGLINE2 |
Normal pace with object | Select the Line that includes data collected using a normal pace with an object. Script Parameter: UCE6LINETEST.OBJLINE1 |
Normal pace with object opposite direction | Select the line that includes data collected using a normal pace, in the opposite direction, with an object. Script Parameter: UCE6LINETEST.OBJLINE2 |
Fast pace with object | Select the line that includes data collected using a fast pace with an object. Script Parameter: UCE6LINETEST.FSTLINE1 |
Slow pace with object opposite direction | Select the line that includes data collected using a slow pace, in the opposite direction, with an object. Script Parameter: UCE6LINETEST.SLWLINE2 |
AddMoreLines | Click this button to add more lines. |
6 Line Test: Adding Line dialog options
Title (Description) | Specify the title and/or description of the new line. |
Line | Select the name of the new line. |
Application Notes
The use of a "Lag Bar Test" or a "6-Line Test" is recommended to measure latency effects for all geophysical instruments.
This test will accept the data collected in a single line. It checks the data for turnarounds, and if it locates any the data is broken down into its line constituents prior to prompting the user to identify how each line has been surveyed.
The amplitude tolerance, present in earlier versions of this test, has been removed because the change in speed when conducting the 6-line test affects the amplitude and as a result the absolute amplitude should not be subject to scrutiny.
Conducting a 6-Line Test
Use an area that has little background noise and no sources of anomalous responses. A line selected from the site’s geophysical prove-out grid is ideal, provided that the prove-out grid is convenient to the survey area.
The test line should be well marked to facilitate data collection over the exact same line each time the test is performed. Background response over the test line is established for Lines 1 and 2.
After collecting the background response, a standard test item, such as a steel trailer hitch ball, should then be placed on the line, and Lines 3-6 are collected at normal, fast and slow paces.
Heading effects, positional accuracy, and latency are evaluated in Lines 3-6.
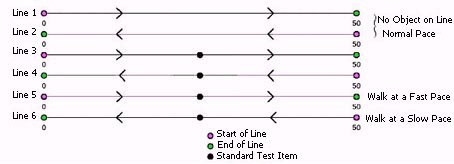
Figure 1: One test line is traversed 6 times.
Conducting a Lag Bar Test
In a "lag bar" test, a steel rod is commonly used, in which the geophysical instrument is traversed over the rod in several passes. A typical latency test consists of three passes over the steel rod, as follows:
First pass walking to the north, pass over west end of rod
Second pass walking to the south over centre of rod
Third pass walking to the north, over east end of rod
If no latency effects were observed in the data, the rod will appear as a narrow, linear anomaly. If latency effects are observed, the anomaly will demonstrate a chevron pattern. The required shift will be saved in the workspace and appear as the default value in the lag correction dialog. This dialog generates a profile plot of the overlapping profiles to show areas of probable latency effects, and report the lag in the legend.
Distance calculation:
When running the 6 line test a Distance channel is added to the database. This is calculated as the distance between each data point and the minimum coordinate in the main direction and optionally orthogonal direction as follows:
When only the main direction is specified:
Distance = Main Direction Coordinate - Minimum Coordinate in Main Direction
When both the main direction and the orthogonal direction are specified:
				Distance = SquareRoot( (Main Direction Coordinate - Minimum Coordinate in Main Direction)2
					+ (Orthogonal Direction Coordinate - Minimum Coordinate in Orthogonal Direction)2)
Acknowledgments
The following document has been used in the compilation of this Help file, and further information can be obtained directly from it:
- ORDNANCE AND EXPLOSIVES DIGITAL GEOPHYSICAL MAPPING GUIDANCE - OPERATIONAL PROCEDURES AND QUALITY CONTROL MANUAL (DGM QC Guidance), U.S. Army Corps Engineering and Support Center, Huntsville, Prepared by NAEVA Geophysics, Inc. December 2003.
Got a question? Visit the Seequent forums or Seequent support
© 2024 Seequent, The Bentley Subsurface Company
Privacy | Terms of Use