
Invert for Sources (Static)
Use the Invert for Sources (Static) option (Geosoft.uxo.gxnet.dll(Geosoft.GX.UXO.UxaBatchFit2;Run)*) from the menu AGC Expert User > Static Data Inversion to invert/model static advanced EM Sensor data to determine the source location, polarizabilities, and other parameters. The results are saved in the Source database.
Invert for Sources (Static) dialog options
Databases | |
Databases prefix | Select the databases prefix. Script Parameter: UXANALYZE.MODELING_PREFIX |
Target database group | Select the group to read the measurement from the list of groups in the Target database. Script Parameter: UXANALYZE.TARGETGROUP |
Source database group | Specify the group to write the inversion results from the list of groups in the Source database. Script Parameter: UXANALYZE.SOURCEGROUP |
ID channel | Select the ID channel from the list of channels in the Target database. Default: UXA_Target_ID Script Parameter: UXANALYZE.TARGETID |
Mask channel | Choose the mask channel that selects/deselects measurements to invert from the list of channels in the Target database. Default: UXA_Mask Script Parameter: UXANALYZE.TARGETMASK |
Sensor channel | Select the sensor channel to use in the inversion from the list of channels in the Data database. Script Parameter: UXANALYZE.SENCHAN |
Gates | Select the low and high time gates from the list, which limit the range of data used when modelling the data. Default value for low gate is the one with the first valid time (UXA_GateFirstValidTime). Default value for high gate is the maximum number of gates minus one. Script Parameters: UXANALYZE.Static_LoGate UXANALYZE.Static_HiGate |
Number of dipoles | Select the maximum number of dipoles to invert. This determines how many sources will be modeled. For example, if the number of dipoles selected is 3, a total of six sources will be calculated: one 1-dipole, two 2-dipole, and three 3-dipole. In the Source database, the Target ID of each source follows this pattern: [FLAG]_[MEASUREMENT]_[SOLVER][SOURCE]. If flag ID is 79 and measurement ID is 1, the number of dipoles (for a value of 3) generates the following sources: 79_001_11, 79_001_21, 79_001_22, 79_001_31, 79_001_32, and 79_001_33. Default value is 1. Script Parameter: UXANALYZE.NDIPOLE_SOLVER |
Chi2 threshold | Specify the Chi-squared threshold. As part of the inversion process, the Pearson's cumulative test statistic is calculated and saved in the subset database under the UXA_CHI2 channel (see the Application Notes below). The Transmitter and Receiver combinations that exceed the “Chi2 threshold” are tabulated in the Source database (UXA_CHI2_ABOVETHRESH). In addition, these combinations are highlighted in yellow on the Decay Display Measured vs Modeled plots. Script Parameter: UXANALYZE.CHI2THRESHOLD |
Signal amplitude | Specify the signal amplitude type:
If a Z transmitter-receiver (Tx/Rx) combination is not available for the selected dataset, the option is disabled. For example, for the APEX and UltraTEM sensors, there are no monostatic Tx-Rx combinations, and Monostatic Z is disabled. The signal amplitude is calculated as the maximum measured response for the selected Z transmitter-receiver combination. The result is saved in the UXA_Sig_Amplitude channel. Script Parameter: UXANALYZE.STAT_CHANNEL_AMPLITUDE |
Application Notes
The static advanced EM Sensor data in the Data and Target databases are inverted to determine source location, polarizabilities, and other parameters. The results are saved in a Source database.
Source Database Parameters
UXA_TARGET_ID The target ID. This ID field is composed of four parts:
- Geo ID
- Flag ID
- Measurement ID
- Source ID
Each part is delimited by an underscore (_).
UXA_X_Array The easting or X coordinate of the sensor array or cart location. UXA_Y_Array The northing or Y coordinate of the sensor array or cart location. UXA_Z_Array The elevation of the sensor array or cart. UXA_ACQ_DATE The acquisition date of the sensor data. UXA_ACQ_TIME The acquisition time of the sensor data. UXA_MASK The mask channel that can be used to select/deselect sources for subsequent analysis. UXA_MASK_QC The quality control mask channel that can be used to select/deselect sources for subsequent analysis. UXA_FIT_X Fitted X location of the source. This channel will be set as the default X channel in the Source database. UXA_FIT_Y Fitted Y location of the source. This channel will be set as the default Y channel in the Source database. UXA_FIT_Z Fitted Z location (elevation) of the source. UXA_Fit_BGS The depth below ground surface of the source. This channel will be set as the default Z channel in the Source database. UXA_FIT_CHI2 The Chi-Square test metric – a measure of how well the model data matches the observed data for all Transmitter (TX) and Receiver (RX) combinations.
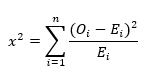
Pearson's Chi-Square test is calculated across the entire time window for all TX-RX combinations. The value of the Chi-Square test statistic is:
Where:
x2= Pearson's cumulative test statistic, which asymptotically approaches a x2 distribution.
Oi = observed or measured data.
Ei = expected or modeled data.
n = the number of selected time gates multiplied by the number of transmitter and receiver combinations.
This measure is the overall fit for all the data for a single anomaly (as opposed to the Chi-square in the Subset database, which is the individual fit for RX-TX combinations).
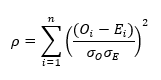
UXA_FIT_COH The fit coherence metric, the correlation coefficient squared – a measure of how well the model data matches the observed data for all Transmitter (TX) and Receiver (RX) combinations.
The value of the correlation coefficient squared is:
Where:
ρ = Pearson's correlation coefficient.
Oi = observed or measured data.
Ei = expected or modeled data.
σO = standard deviation of the observed data.
σE = standard deviation of the expected data.
n = the number of selected time gates multiplied by the number of transmitter and receiver combinations.
A high fit coherence does not guarantee that the fit results are accurate – only that the match between modeled and measured data is high. A fit coherence of 0.8 or less indicates poor inversion results and should not be used for analysis.
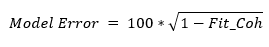
UXA_FIT_MODERR Inversion or model error, a measure off the error in the inversion as a percentage.
UXA_FIT_ERROR Error flag:
- 0: Fit converge successfully
- 1: Unexpected or general error
- 2: Maximum number of iterations reached
UXA_FIT_B1
UXA_FIT_B2
UXA_FIT_B3
The polarizabilities (or sometimes “betas”), primary, secondary and tertiary.
These are the three response coefficients that represent the eigenvalues of the magnetic polarizability tensor. They can be thought of as components along the three orthogonal axes of the induced dipole. Negative values are physically impossible.
The relative size of the coefficients provides information about the shape of the object. For an isolated metallic object:
- Cylindrical shape, B1>B2≈B3.
- Spherical shape, B1≈B2≈B3.
- Plate shape, B1≈B2>B3
UXA_FIT_AZ Declination or azimuth of the source dipole (degrees). UXA_FIT_INC Inclination of the source dipole (degrees). UXA_FIT_ROLL Rotation or roll of the source dipole (degrees). UXA_SIG_AMPLITUDE The signal amplitude of the largest measured signal for the monostatic Z TX-RX coil combinations. UXA_CHI2_TOTAL The total or sum of the values in the UXA_CHI2 channel (see Subset database). UXA_CHI2_ABOVETHRESH The number of TX-RX combinations (see the Subset database) where the UXA_CHI2 are above the Chi2 threshold.
In addition, these combinations are highlighted in yellow on the Decay Display Measured vs Modelled plots.
UXA_diff_array_fit_SCF The difference between the array and fit location in the sensor coordinate reference frame (SCF). The SCF is a cartesian measurement frame that is orthogonal to the sensor coil, as opposed to the earth coordinate reference frames (ECF), such as geographic (Longitude/Latitude) coordinates. UXA_BLOCKTIMEONECOIL The length of the entire measurement cycle (include transmits, record, and repeats) in milliseconds. UXA_GATECENTERS The time in milliseconds of the centre for each time gate. UXA_INITIAL_ACQUISITION_ID The ID of the group of the sensor data used in the inversion. Retrieved from the data database. UXA_FLAG_X The easting or X coordinate of the flag location. UXA_FLAG_Y The northing or Y coordinate of the flag location.
UXA_COMMENTS User comments. UXA_COMMENTS_2 User comments.
Subset Database
During the inversion of the target data, a subset database is created to manage the data. For most processing of static data, there is no need to usually view the subset database.
The subset database will have the name <Prefix>_Subset_<Target group>_<Source group>.gdb. Within the subset database, the data for each flag to be modeled is stored in groups that have the name <Target ID>.<Number of Dipoles>.
The calculated modeled data is saved in the subset database alongside of the observed data.
The subset database contains the parameters listed below:
UXA_X_Coil
UXA_Y_Coil
UXA_Z_Coil
The easting (X), northing (Y), and elevation (Z) of the sensors receiver (RX) coils. UXA_TX The transmitter coil name/label. UXA_RX The receiver coil name/label. UXA_DATA_NORM The sensor data normalized for current. UXA_DATA_NORM_final The data used for the inversion (currently the same as UXA_DATA_NORM). UXA_DATA_NORM_model The model data resulting from the inversion. UXA_DATA_NORM_residual The residual, the difference between the observed/measured data, and the modelled data. UXA_Noise_Floor The background sensor noise channel.
The background noise channel, UXA_Noise_Floor, is created when there is repeated background data from the same time period and Level Advanced Sensor Data is executed.
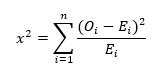
UXA_DATACHIPID Not used. UXA_MASK A mask channel used to grid the data for Data Map. UXA_CHI2 The Pearson Chi-Squared test metric – a measure of how well the model data matches the observed data for each Transmitter (TX) and Receiver (RX) combination.
The Chi-Square is calculated across the entire time window for each TX-RX combination. The value of the Chi-Square test statistic is:
Where:
x2 = Pearson's cumulative test statistic, which asymptotically approaches a x2 distribution.
Oi = observed or measured data.
Ei = expected or modeled data.
n = the number of valid time gates in a TX-RX combination.
For each flag, the Source database tabulates the sum of the Chi-square (UXA_CHI2_TOTAL) and the number of TX-RX combinations that exceed the “Chi2 threshold” (UXA_CHI2_ABOVETHRESH). In addition, the combinations that exceed the threshold are highlighted in yellow on the Decay Display Measured vs Modeled plots.
UX-Analyze Configuration File
The configuration file contains various default or standard settings for the tools. The file, "uxa.config", is in the "C:\Program Files\Geosoft\Desktop Applications \etc" folder.
<modeling>
<generateLog value='false'/>
<concurrentTargets value="10" max='1024'>
</modeling>
It is not recommended that you edit this file unless directed by Support.
*The GX tool will search in the "gx" folder. The GX.Net tools, however, are embedded in the Geosoft.uxo.gxnet.dll located in the bin folder. If running this GX interactively, bypassing the menu, first change the folder to point to the bin folder, then supply the GX.Net tool in the specified format.
See Also:
Got a question? Visit the Seequent forums or Seequent support
© 2024 Seequent, The Bentley Subsurface Company
Privacy | Terms of Use