FEFLOW Model Display
If you do not have the Hydrogeology extension, FEFLOW models will appear in the project tree as Restricted. You can change how FEFLOW models are displayed, but you will not be able to make changes to the models themselves.
In the project tree, 3D FEFLOW models are made up of a grid object representing the finite elements, a nodes object and a material types table (![]() ) object. If there is no material types table, an evaluation has not yet been set for export. See FEFLOW Evaluations for more information.
) object. If there is no material types table, an evaluation has not yet been set for export. See FEFLOW Evaluations for more information.
A 2D FEFLOW grid is made up of a grid object and a nodes object. Here, three types of FEFLOW models are shown expanded in the project tree:
- Feflow 3D Simulation is a 3D model created in Leapfrog Works.
- Feflow 2D Simulation is a 2D model created in Leapfrog Works.
- Feflow Results is an imported 3D model (DAC file).

From the information in the project tree, we can see that:
- The 3D simulation created in Leapfrog Works (
 ) uses the GM geological model to define the layers.
 - The 2D simulation created in Leapfrog Works (
 ) uses the GM geological model as a boundary and has had collar points added as a feature.
 - The imported results model (
 ) includes a number of simulation outputs.
For each type of FEFLOW model, dragging the model itself into the scene will display the grid (![]() ) object. The different parts of the model can also be displayed.
) object. The different parts of the model can also be displayed.
Displaying a 3D Model
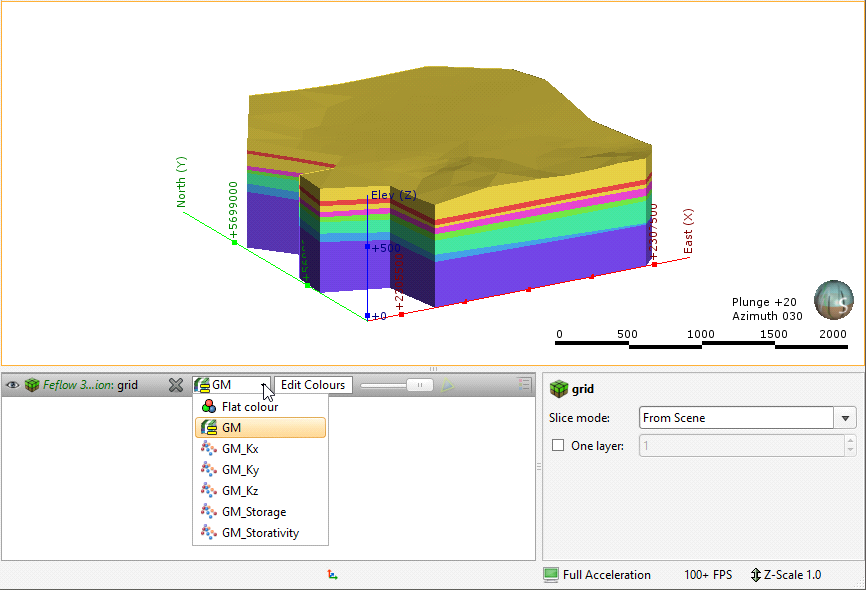
Dragging a 3D simulation into the scene displays its grid object, which represents the finite elements. Here, a 3D model created in Leapfrog Works (![]() ) has been added to the scene:
) has been added to the scene:

For 3D models imported into Leapfrog Works, you can display the model using other information available for the grid, such as conductivity data. This is available from the view list.
Grids for 3D models are displayed as blocks. You can also display a legend for the grid when a geological model evaluation is displayed.
When Show edges (![]() ) is enabled, the edges of the blocks will be displayed.
) is enabled, the edges of the blocks will be displayed.
To display a single layer, tick the One layer box in the shape properties panel, then select the layer to display.
You can display the nodes by adding the nodes (![]() ) object to the scene. When a model with results is displayed, the simulation outputs can be displayed when the nodes are viewed in the scene. Here, the nodes for an imported results file have been added to the scene. The heads are displayed for a single layer:
) object to the scene. When a model with results is displayed, the simulation outputs can be displayed when the nodes are viewed in the scene. Here, the nodes for an imported results file have been added to the scene. The heads are displayed for a single layer:

When the results are time-dependent, a timestep slider will be available from the shape properties panel. Click and drag the slider or click along the timeline to view the different timesteps available.
Displaying a 2D Model
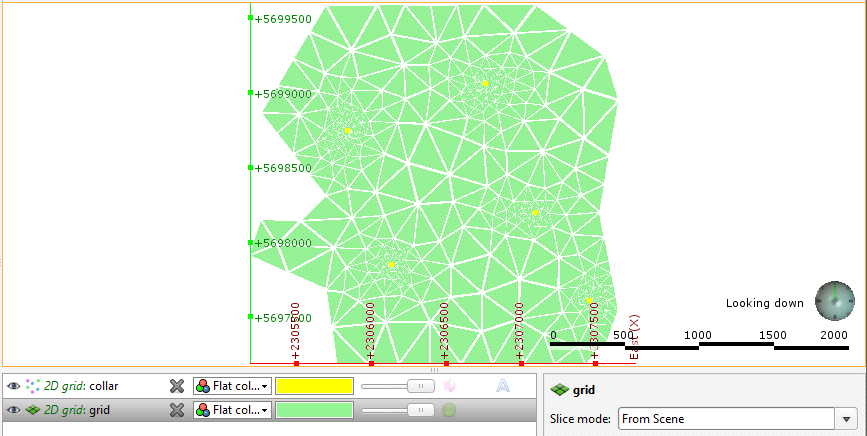
As with 3D models, dragging a 2D model into the scene displays its grid object. Here, a 2D model created in Leapfrog Works ((![]() ) has been added to the scene and viewed from above:
) has been added to the scene and viewed from above:

Also in the scene is a collar points object that shows collar points that have been added to the grid as a feature.
2D grids can be viewed as points or as blocks. As with imported 3D grids, an imported 2D grid can also be displayed using other information available for the grid.
Other viewing options are available for 2D grids created in Leapfrog Works. These are useful in refining a 2D grid and are described in Creating a 2D FEFLOW Model.
Viewing Block Information
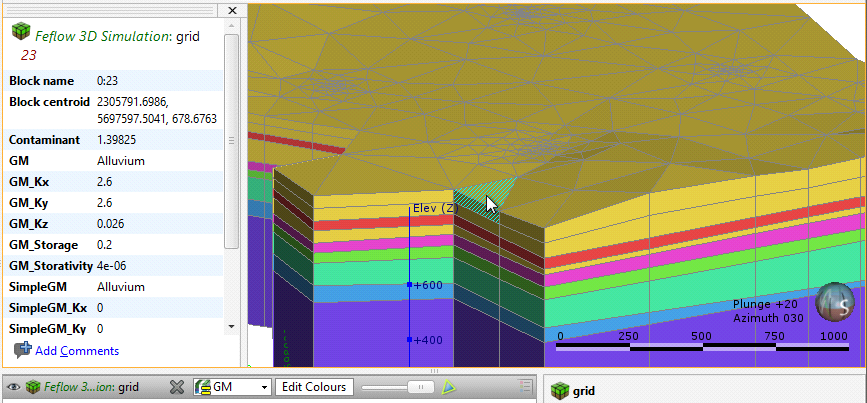
When a FEFLOW model is displayed in the scene, you can view information about the individual blocks in the model by clicking on a block. The window that appears shows information about the selected block, including its centroid and the lithology assigned to the block from all evaluated geological models and interpolants:

Information from all geological models and interpolants the grid has been evaluated against will be displayed:
Got a question? Visit the Seequent forums or Seequent support