
Validation and Reporting
Leapfrog Works provides tools to validate the contaminant estimation models and report the results. Block estimation interrogation is used to inspect the contaminant estimate results. Swath plots and reports add additional insights and provide the basis for visual assets for inclusion in reporting documents.
The rest of this topic describes these tools. See:
Block Estimate Interrogation
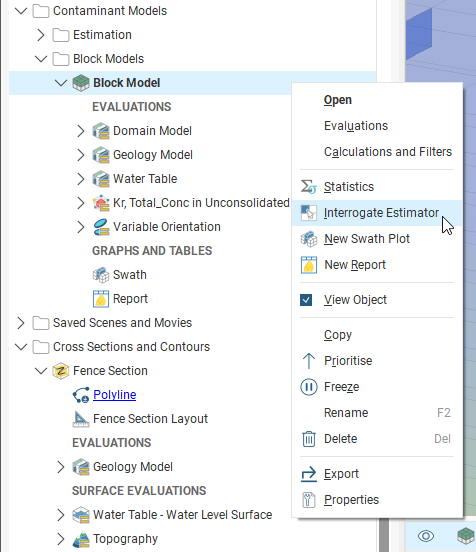
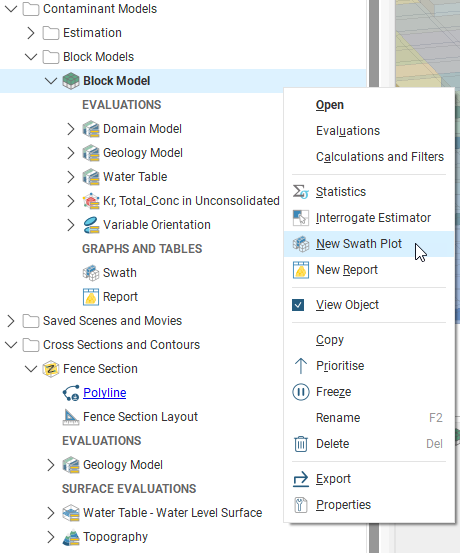
It is good practise to check the estimates produced for blocks, inspecting the data used to create the estimate. The block estimate interrogator exposes the data used to produce an estimate. Right-click on a block model in the project tree and select Interrogate Estimator.
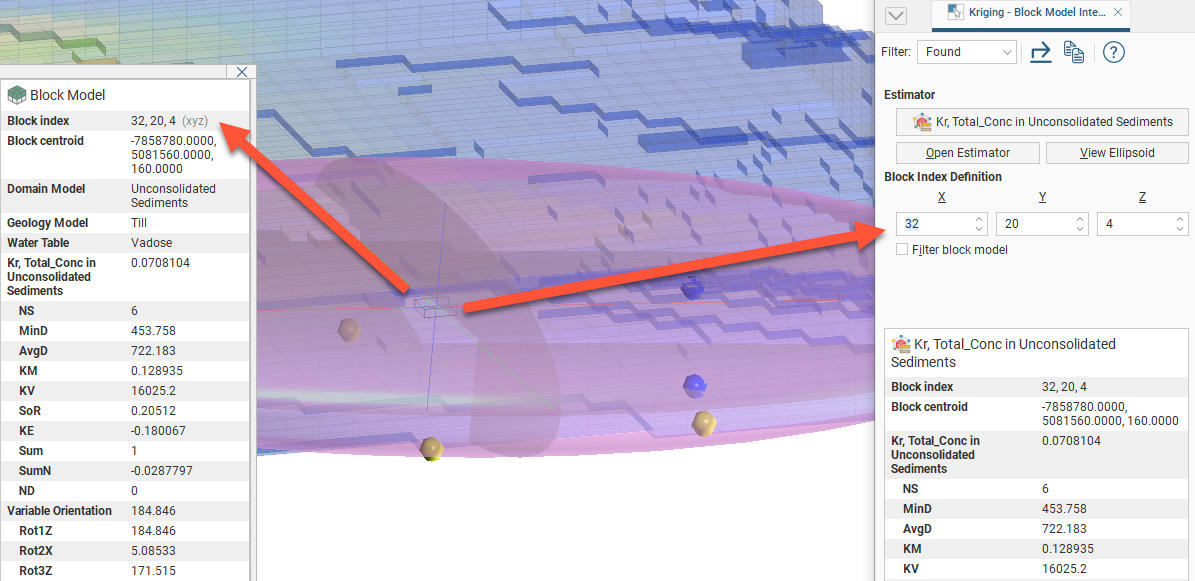
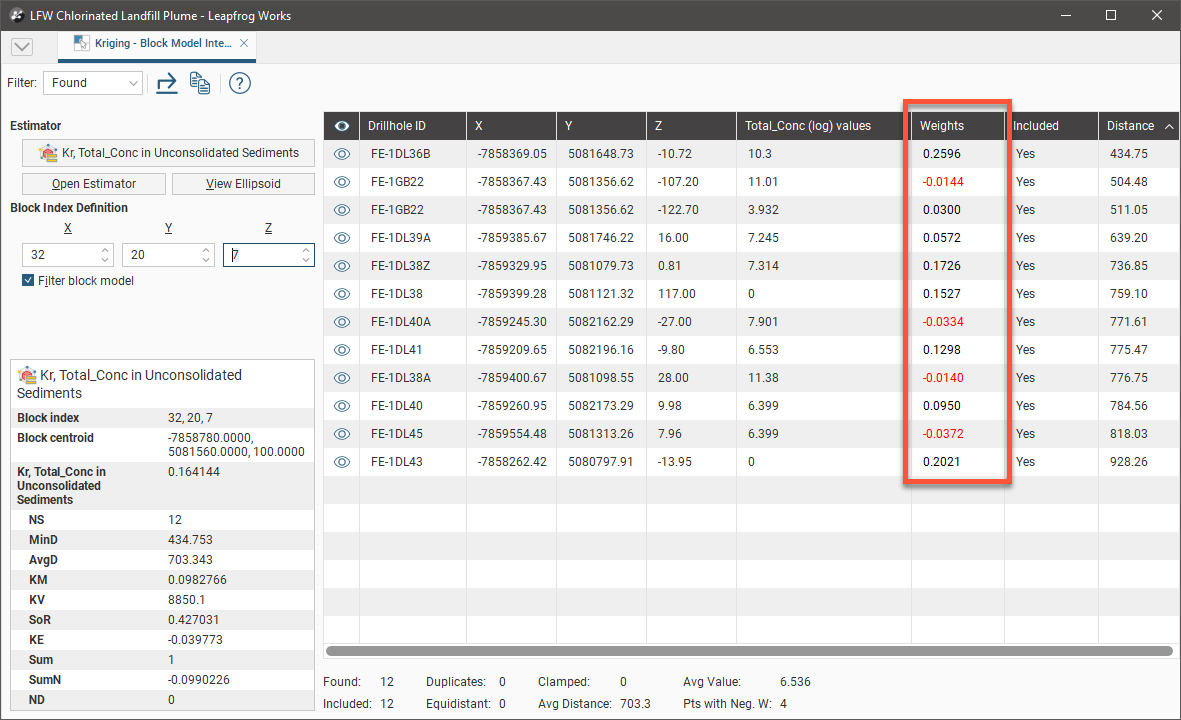
The Block Model Interrogation window will open as a dockable tab, showing the input data used in producing the estimates and other results. Additionally, in the scene view, the block details window will display inside the scene, containing properties for the currently selected block. These are primarily result properties.
Use the filter selector (![]() ) to see all the Found data points in the block estimate interrogator table, or only the data points Included in the estimate, or only the data points that are Clamped. The Clamped option will only be present if Outlier Restrictions are being used by the estimator.
) to see all the Found data points in the block estimate interrogator table, or only the data points Included in the estimate, or only the data points that are Clamped. The Clamped option will only be present if Outlier Restrictions are being used by the estimator.
You can change the Estimator to select between the inverse distance and Kriging estimators evaluated on the block model. Other estimators are not supported by the block model interrogation feature.
Click the Open Estimator button to inspect the estimator used in the estimate. This will open in a new window.
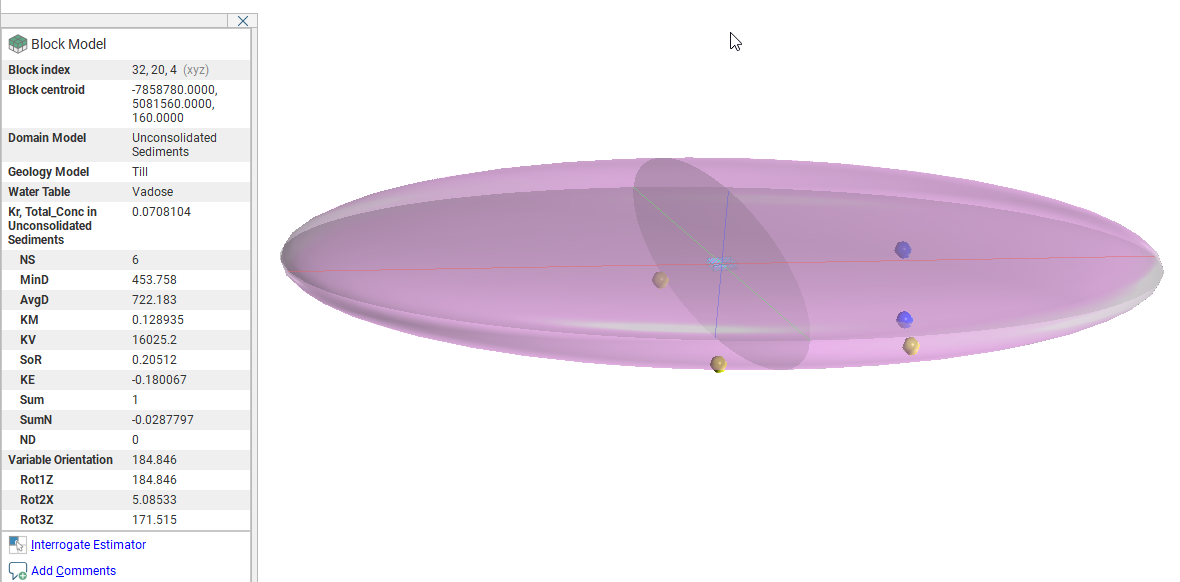
View Ellipsoid will display the search ellipsoid in the scene. The axial planes of the ellipsoid are shaded, which helps to visualise the 3-dimensional shape of the ellipsoid as well as it’s orientation.
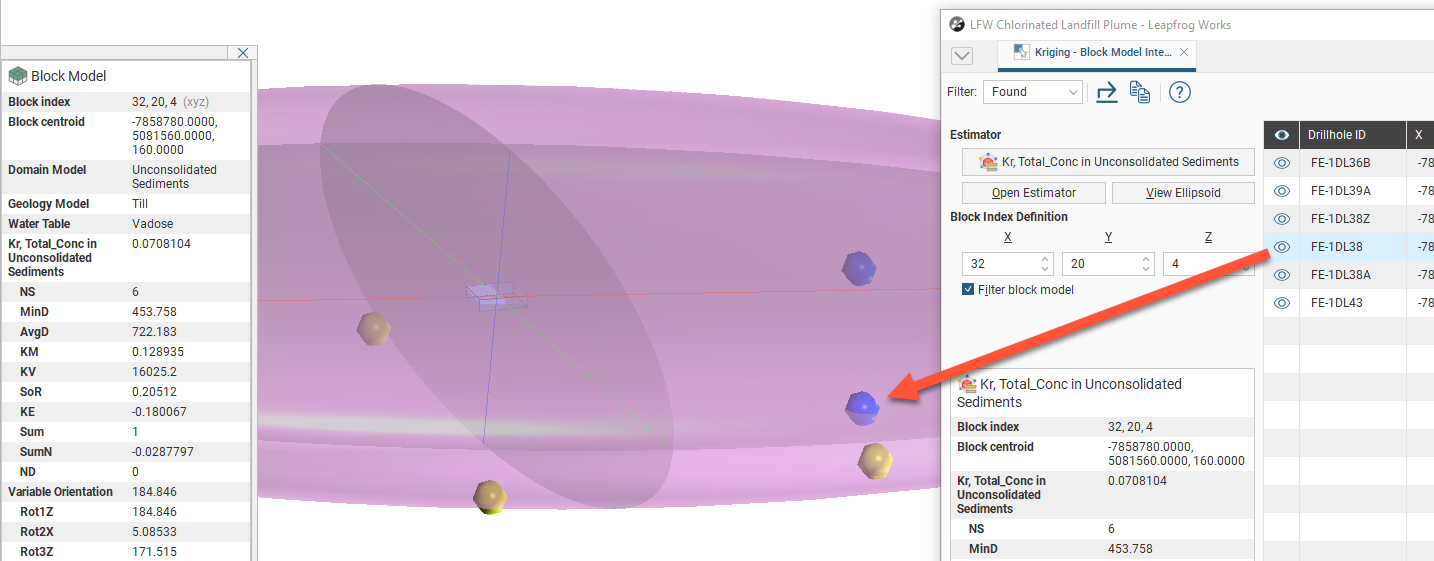
Click a block in the scene or set the Block Index Definition X, Y and Z coordinates to select a specific block.
Enable Filter block model to see only the selected block in the scene, which will reduce the visual noise of all the other blocks. This will help you see the associated data points and the search ellipsoid in relation to the selected block:
In the block estimate table, you will see all the input data columns for each data point. Data points can been hidden or made visible in the scene using the visibility button (![]() ).
).
Block information is shown in the bottom left corner of the Block Model Interrogation window, so it is not necessary to refer back to the scene and select the block information for the appropriate block.
In the Weights column, negative values are highlighted in red to make them easier to see.
The block estimate interrogator table data can be exported for use in other programs such as Microsoft Excel. Click the Export button to save a CSV file, which will include the table data and the search statistics (found, clamped, included, equidistant, duplicates, etc) and the block information (index, centroid, Kriging attributes, etc). Click the Copy button to put a copy of the table data on the operating system clipboard, and you can then paste it into another program.
Swath Plots
Swath plots are an important validation tool for providing comparisons between sample points (composited or uncomposited) and estimated values to identify any bias towards under-estimation or over-estimation or any smoothing in the results. The effect of different estimation methods and parameters can also be compared.
The swath plot is a one-dimensional graph in a specific direction of interest. A swath is a sectional slice through the block model with a specified thickness. The swath plot shows the average values for the blocks in the swath, along with the averaged sample values in the swath.
To create a swath plot, right-click on a block model and select New Swath Plot:
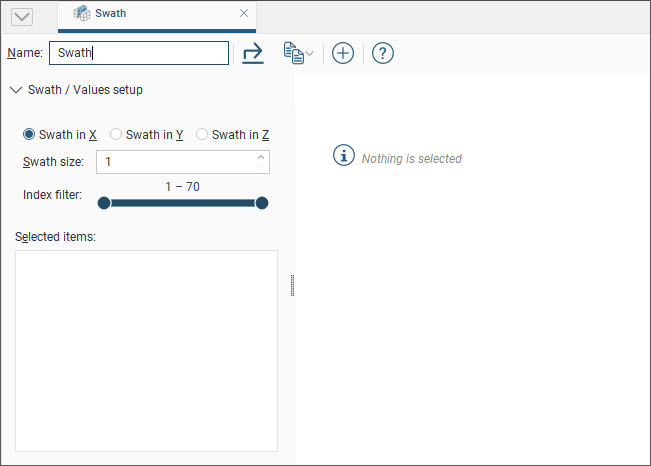
A new Swath window will open:
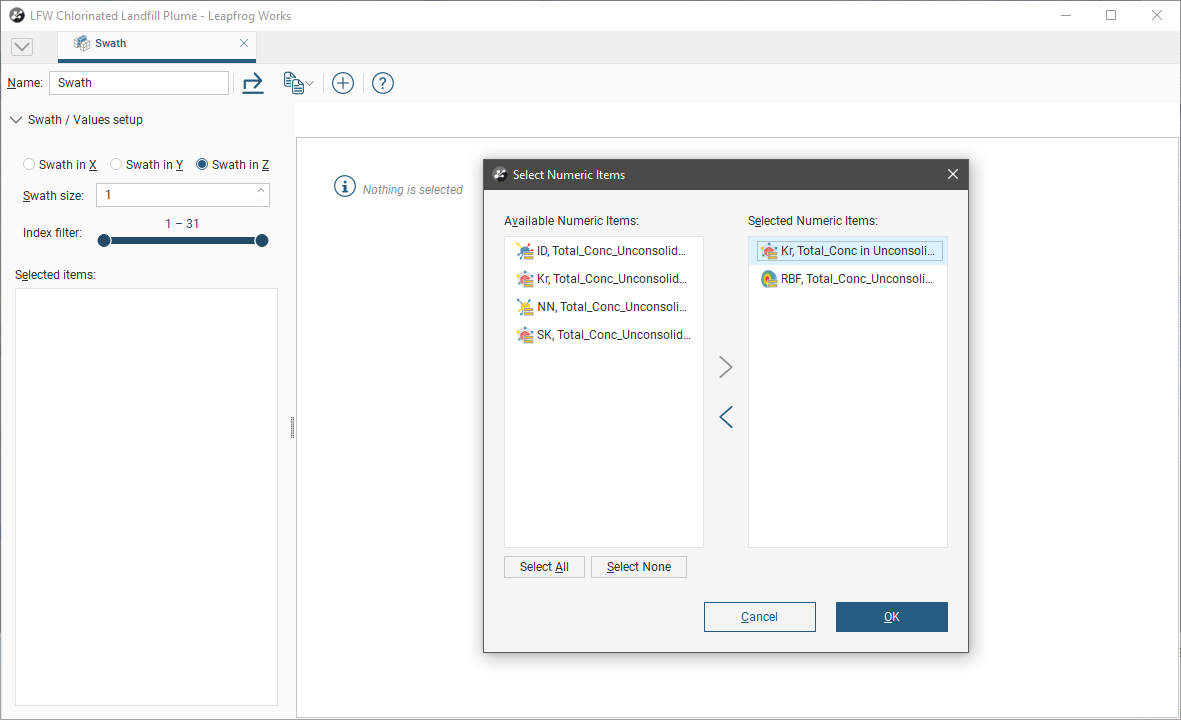
Click the add button (![]() ) to add data sets to the plot. You can select individual items from the list of Available Numeric Items or you can select a parent object to select all the child items within it. Click the right arrow button to move the selected items into the Selected Numeric Items list:
) to add data sets to the plot. You can select individual items from the list of Available Numeric Items or you can select a parent object to select all the child items within it. Click the right arrow button to move the selected items into the Selected Numeric Items list:
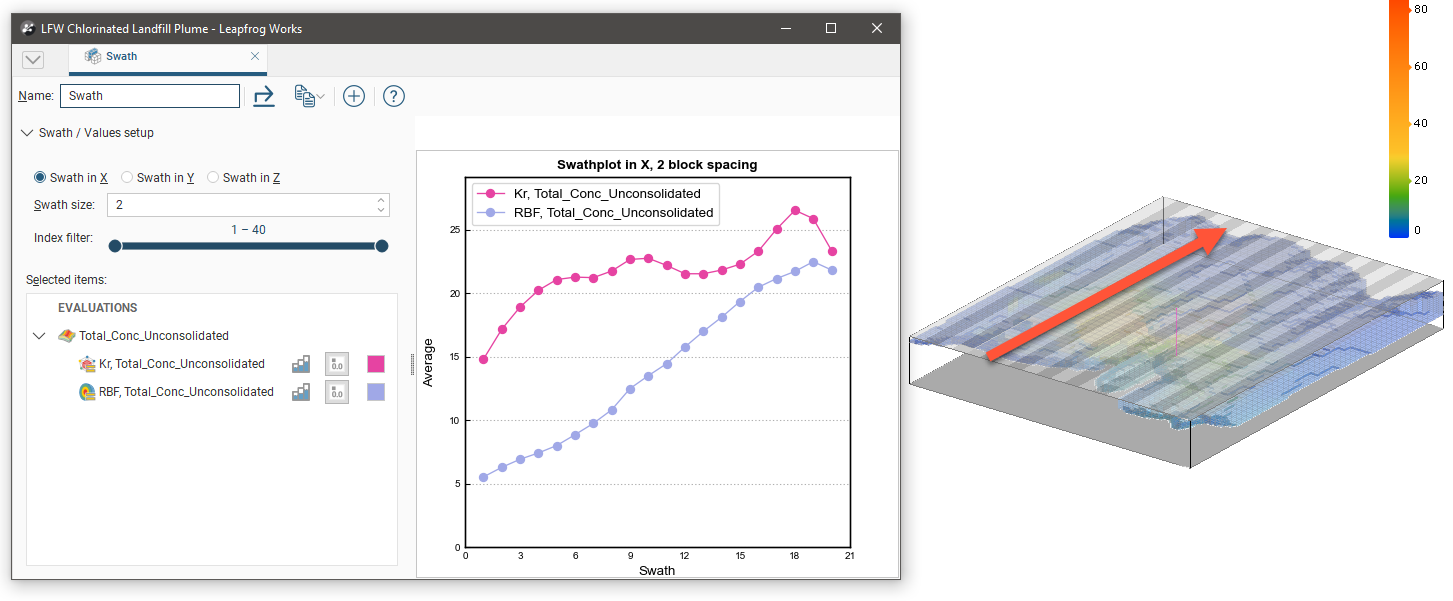
The graph plots the averaged sampled values against the averaged block values for a series of swaths slicing through the block model in a selected direction. The Swath size can be altered for finer or more coarse slices. The Scene view overlays a bounding cuboid that shows the Swath size and direction:
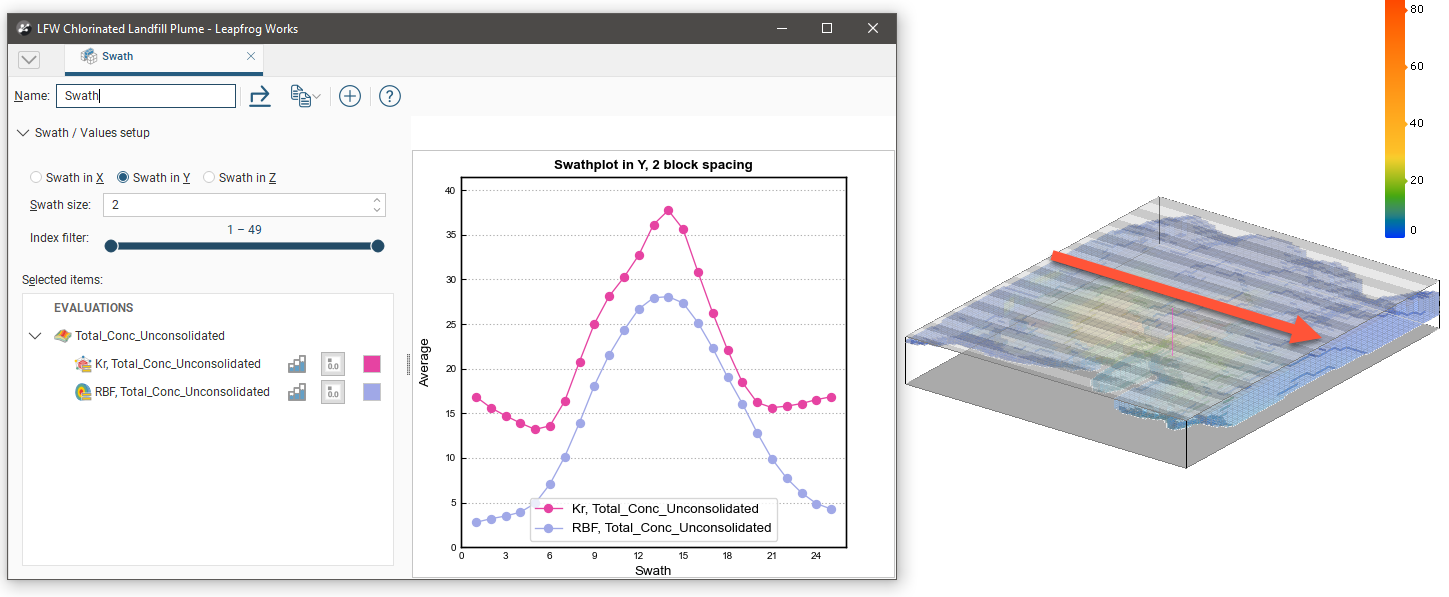
Changing the swath direction to Swath in Y is reflected in the scene:
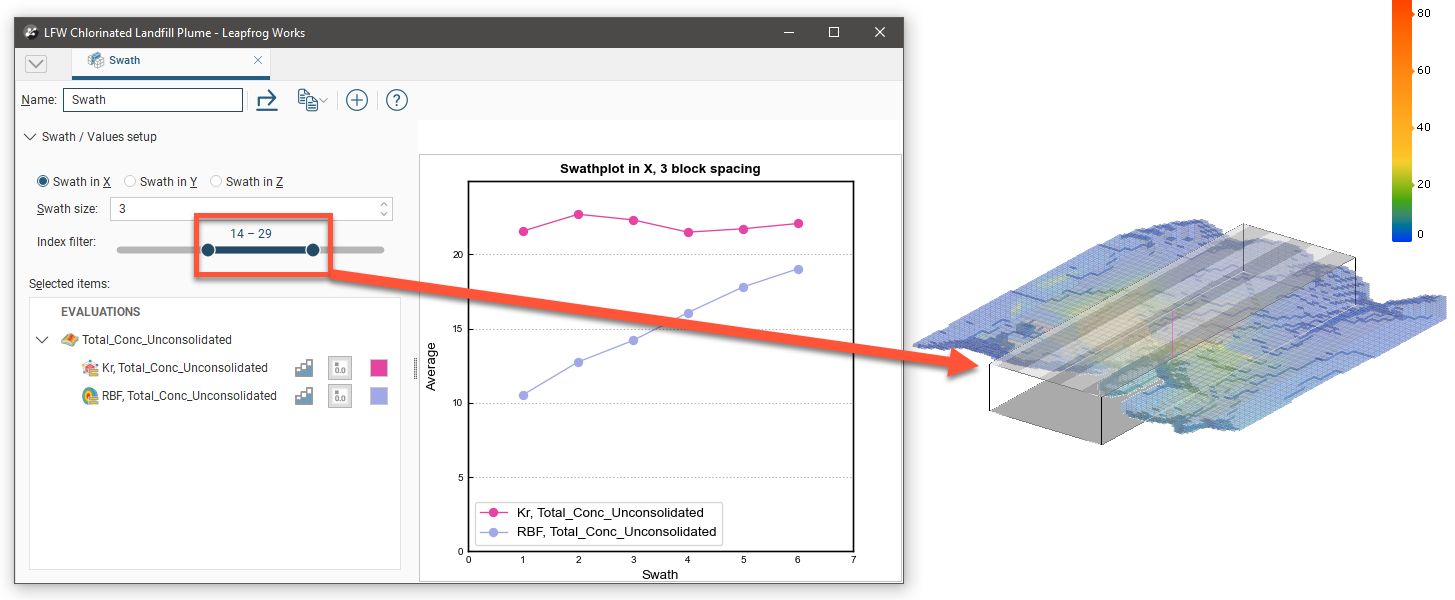
The Index filter can be used to graph a reduced set of the swaths. Either the minimum or maximum threshold for the Index filter can be dragged to change the width of the filter, and the selected portion can be changed by sliding the inner bar. The swath indicator widget in the Scene is updated to show what the Swath plot is depicting:
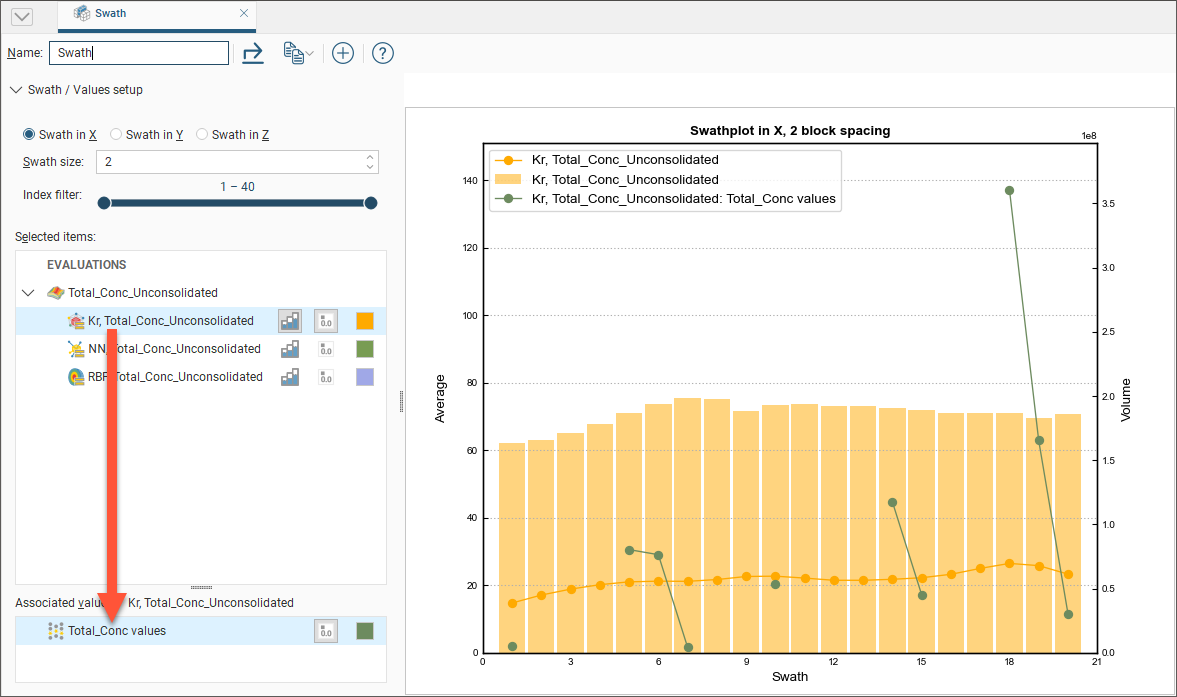
Selected data sets in the chart can be hidden or revealed by clicking the line segment visibility button (![]() ) next to the data set. The histogram visibility button (
) next to the data set. The histogram visibility button (![]() ) will reveal or hide a histogram showing the volume of blocks used in the swath calculation. The block volume may not be identical for all estimators.
) will reveal or hide a histogram showing the volume of blocks used in the swath calculation. The block volume may not be identical for all estimators.
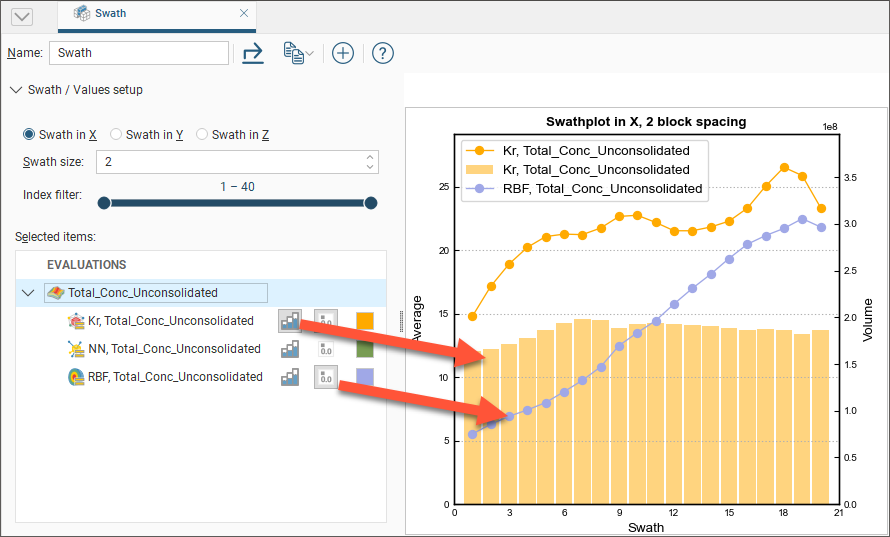
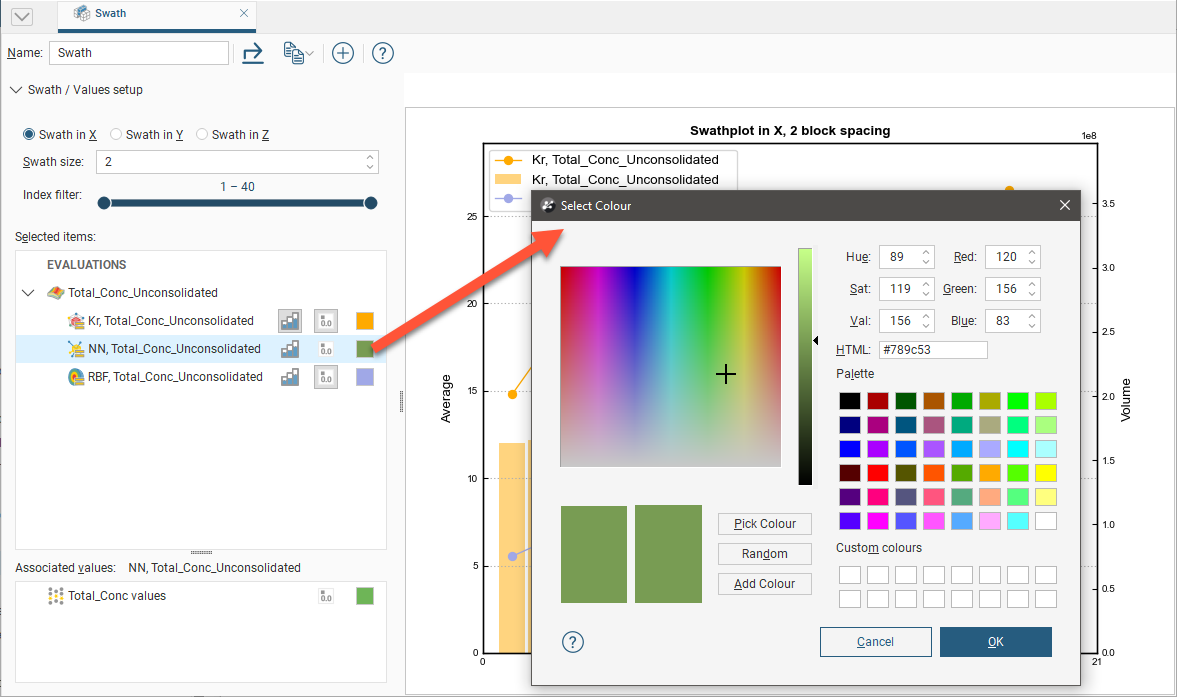
The colour for the line segment plots and histograms can be changed for each data set by clicking the colour chip, and selecting a new colour from the colour picker:
Selecting an evaluation will show an Associated Values panel. This provides options to set the visibility and colour preference for the evaluation’s raw data values.
Changes you make to swath plots are preserved. Multiple swath plots can be created to show different points for analysis and reference.
You can export the graph for use in external reports and other documents. There are three options:
- The Export button saves a PDF, SVG or PNG file of the graph.
- The Copy button opens a menu to offer the options of copying a image of the graph to the Windows clipboard, or copying the graph data as CSV data to the Windows clipboard, where they can be pasted into another application. It also allows you to select the resolution of a copied image: a low resolution Screen Image, a Medium Quality, 300 dpi image, or a High Quality, 600 dpi image. Choose your preferred resolution before selecting Copy Graph Image.
Reports
The contaminant report is a pivot table for reporting on contaminants, with the freedom to customise the table to the unique needs of the project requirements. A contaminant report can display multiple categories and multiple numeric columns.
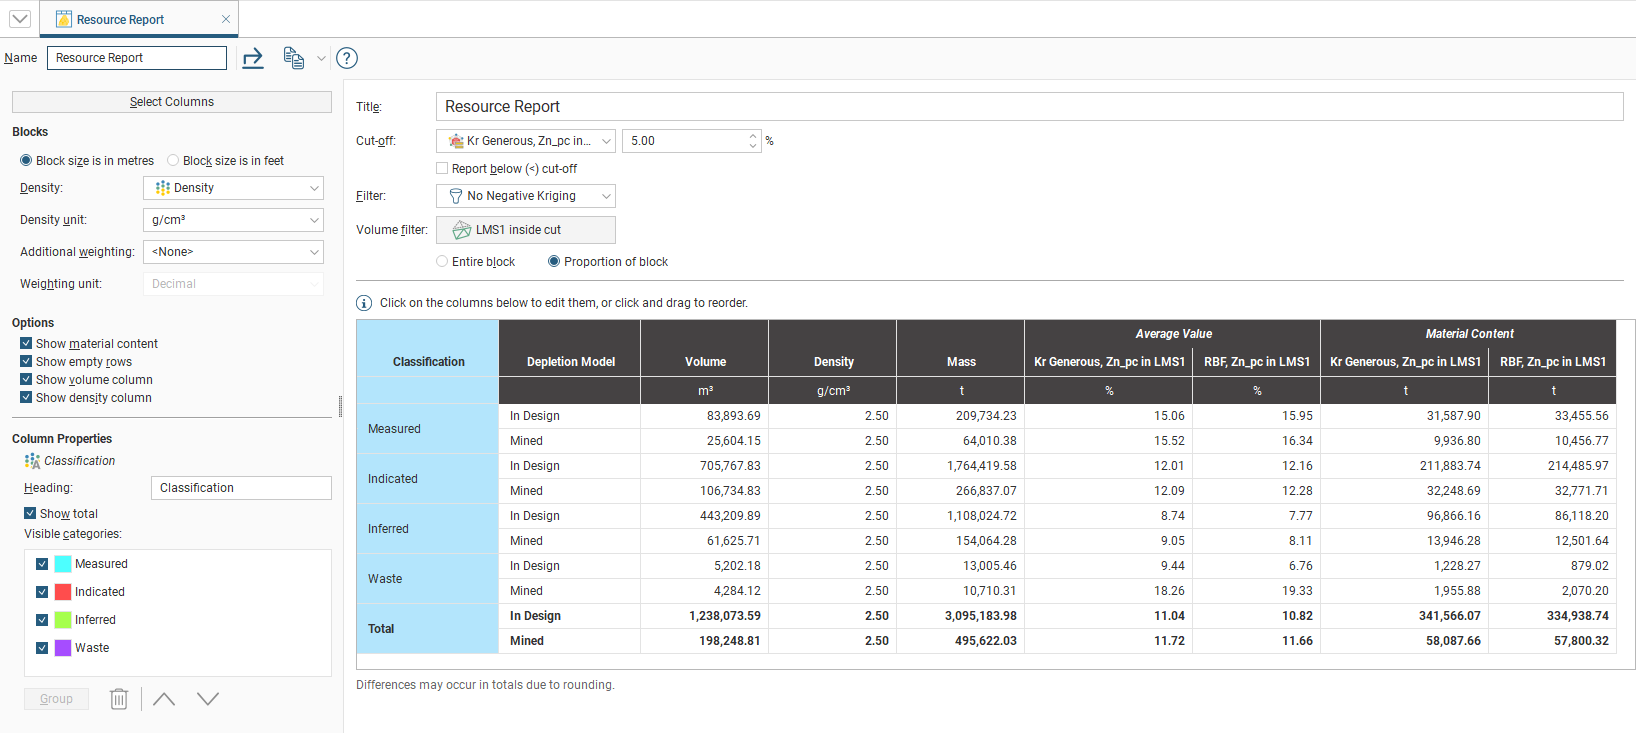
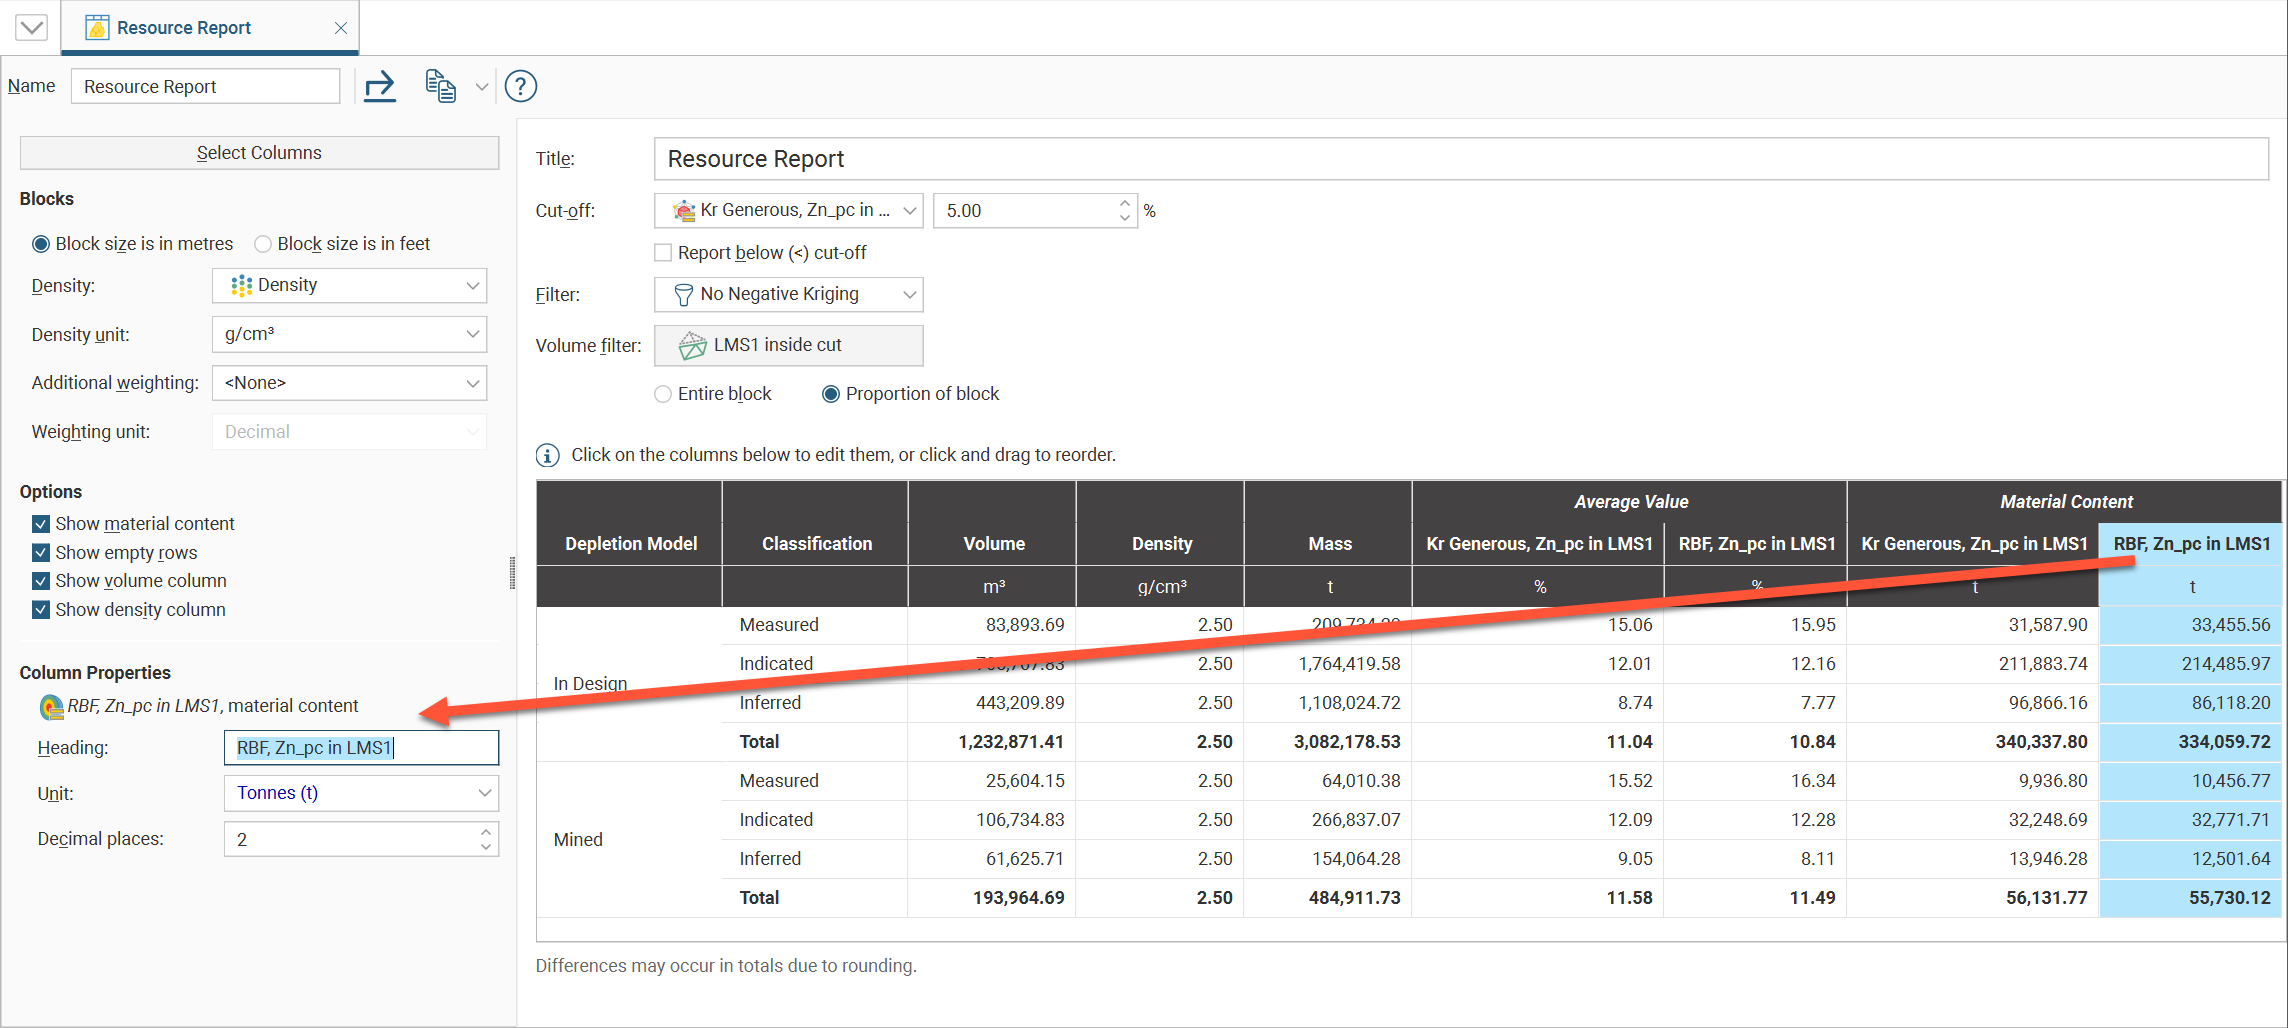
To create or view a contaminant report, right-click on a block model in the project tree and select Report. In the window that appears, click the Select Columns button to choose from the Category columns and Value columns evaluated onto the block model. If you wish to set a Cut-off value, select from any numeric column evaluated on the block model and set the cut-off value. The column selected for the Cut-off does not need to be a column included in the resource report. You can also apply a Filter to the report.
Select between Block size is in metres and Block size is in feet to ensure units are correctly converted. Select Constant value from the list of Density options and specify a numeric constant, or select a density data measurement from the numeric columns listed. Specify the appropriate Density unit to match the Density selection.
Select an option from Additional weighting when you want the selected columns scaled by the value in another column. This is especially useful when you have a proportion column you wish to use to weight the report data, such as a volumetric proportion. You may need to use the Weighting unit to specify if the column selected is a decimal value or a percentage if Leapfrog Works cannot determine this automatically.
It is not advisable to use a stored proportion Additional weighting along with a Proportion of block volume filter. This is because the report would be calculating a proportion of a proportion. To make this calculation assumes these proportions can be simultaneously applied, which may not be the case, resulting in incorrect results.
You can also choose to Show material content columns, Show empty rows, Show volume column and Show density column.
To only include blocks in the report that are beyond a specific threshold, select a data column from one of the options available in the Cut-off dropdown list, then specify the threshold in the adjacent numeric field. In many cases, the preferred behaviour is to report on blocks that exceed the specified threshold, but you can tick the Report below (<) cut-off box to select blocks under the threshold.
Only blocks that are selected by the Filter will be reported on. Filters created by Calculations and Filters will appear in this dropdown list, and
If you have an estimator that produces outside, blank, without_value or error statuses for blocks, these will result in #Invalid entries in the resource report table. To address this:
- Create a filter (or modify your existing filter) to discard blocks with an invalid status, and select this filter in the Filter field above the resource report table, or
- Create a calculation that sets invalid values to an appropriate acceptable value, and select this column instead.
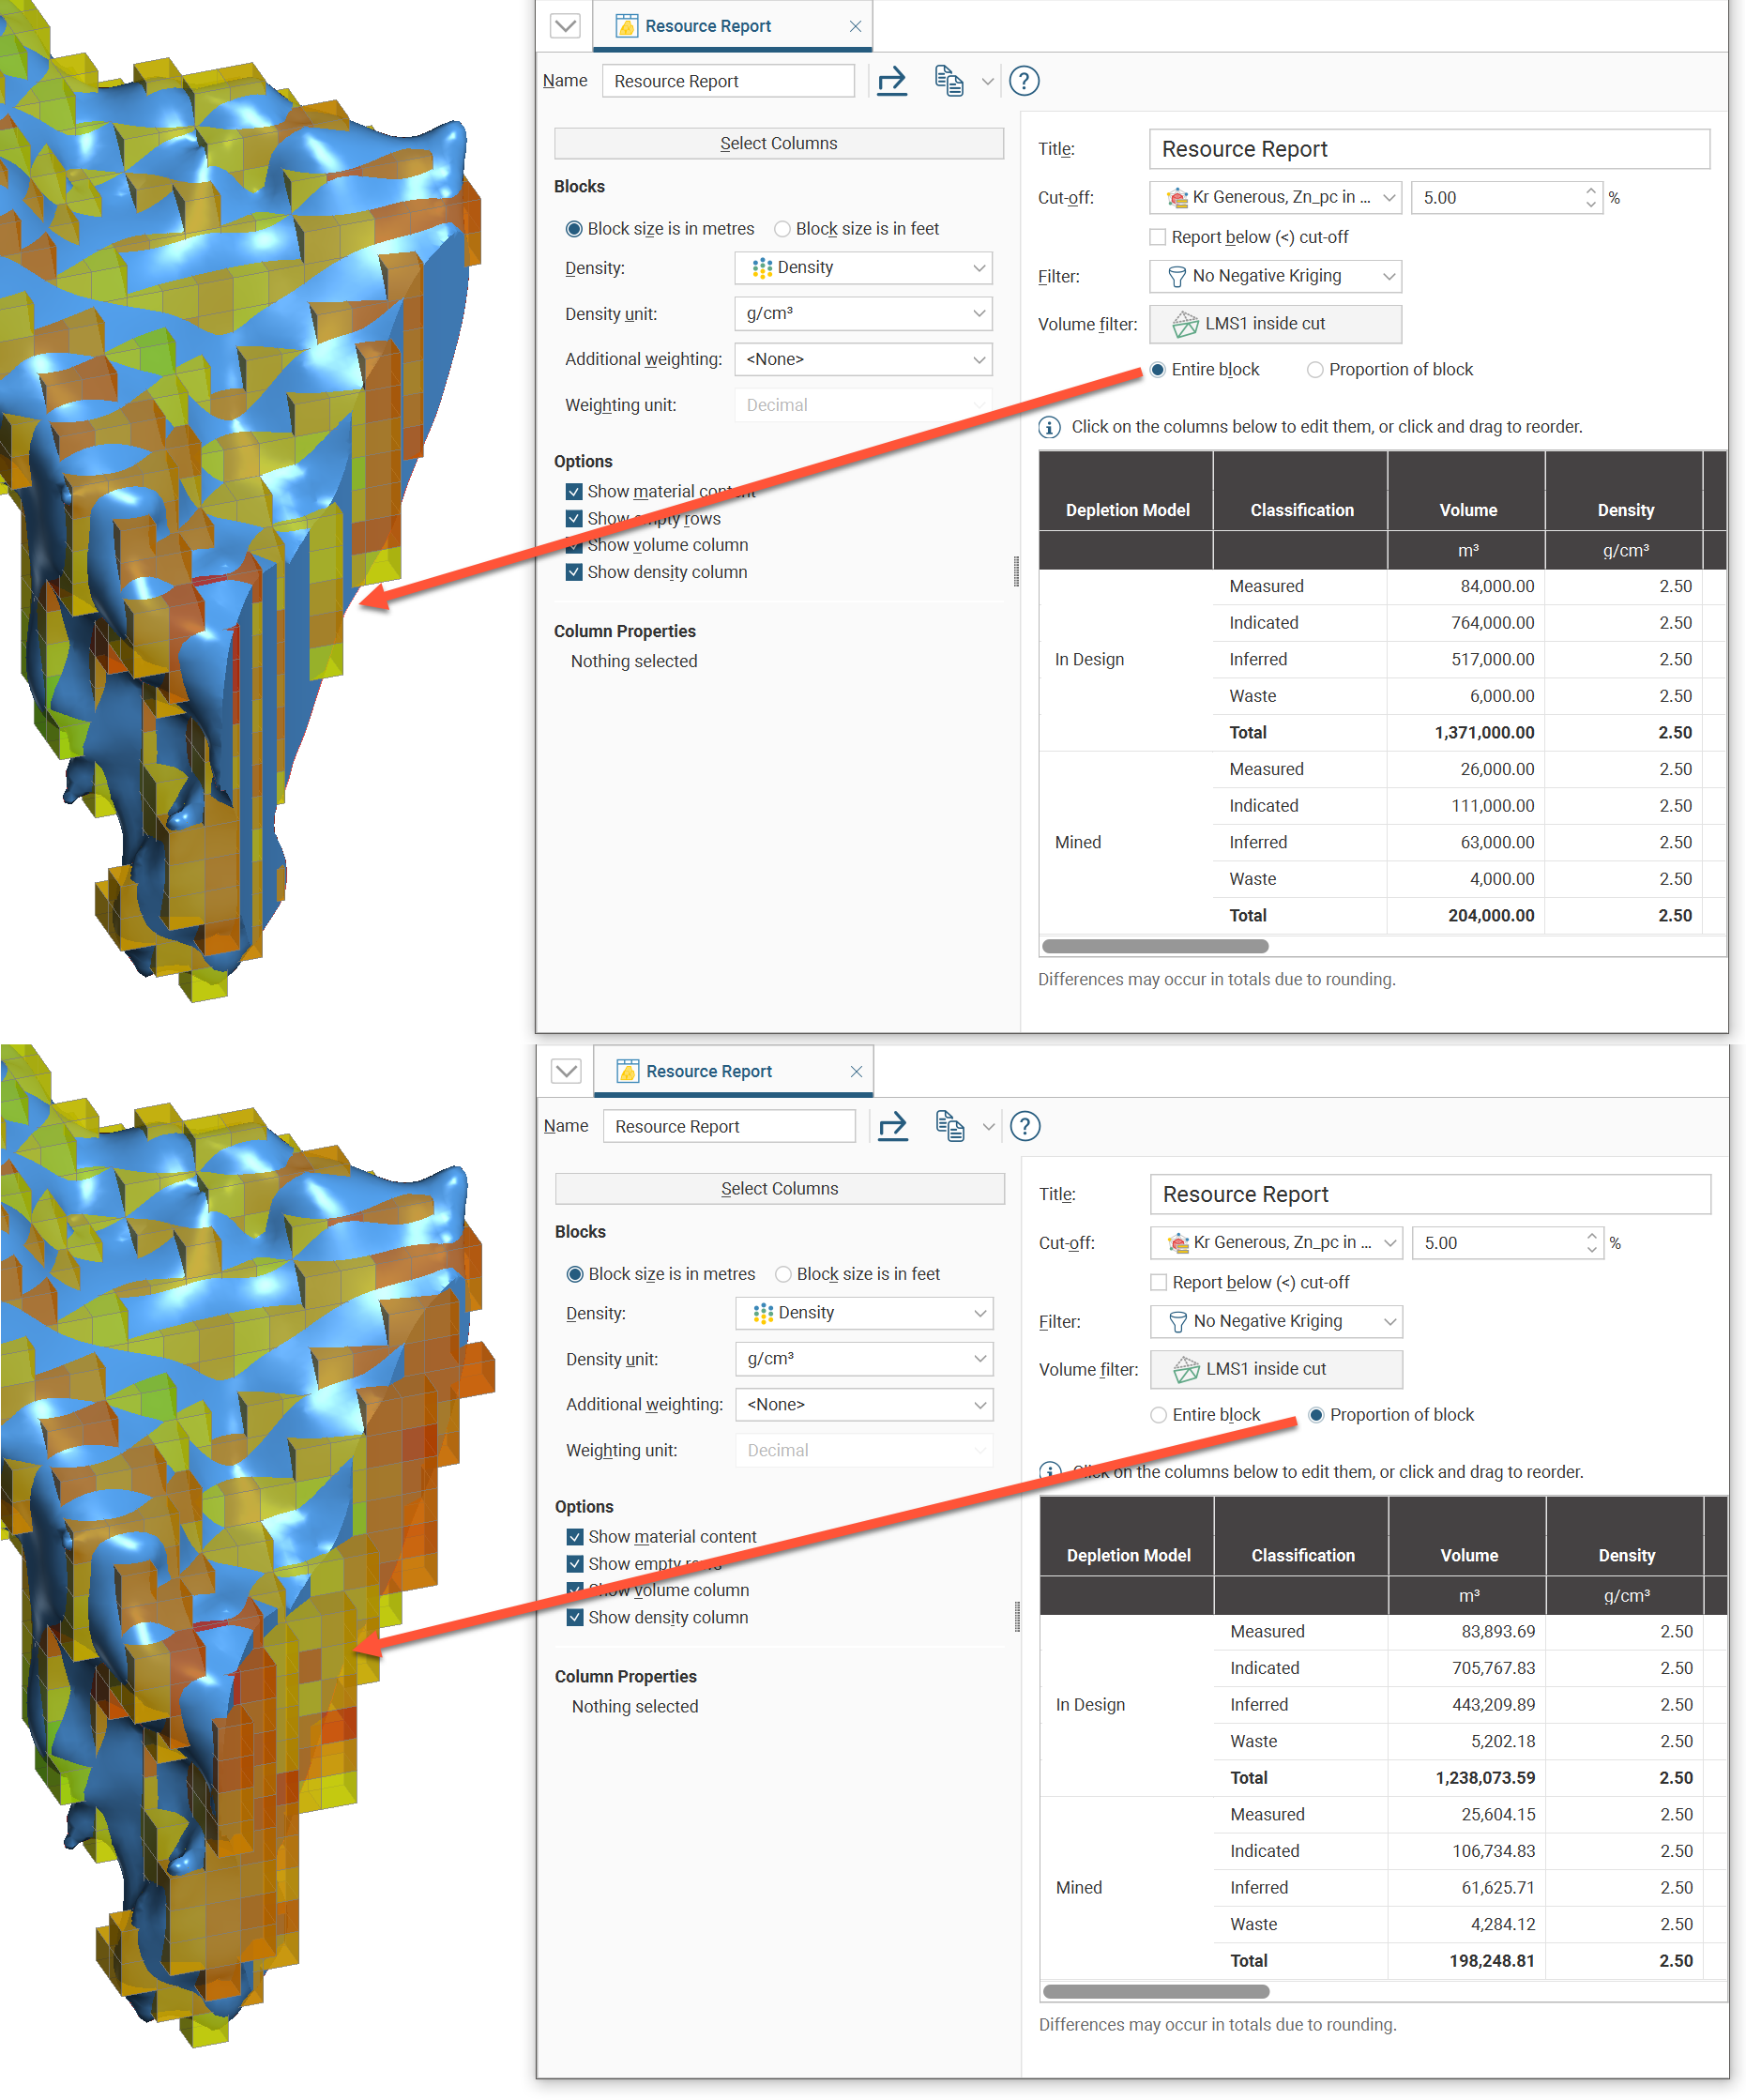
If you select one of the options in the Volume filter dropdown, only blocks within the selected volume will be reported on in the report.
- If Entire block is selected, an entire block will be included in the report as long as the block centroid is within the volume being used as a filter.
- If Proportion of block is selected, only the proportion of a block that is within the selected volume will contribute to the report.
It is also possible to select None as a Volume filter so the reporting will not be restricted.
It is not advisable to use a stored proportion Additional weighting along with a Proportion of block volume filter. This is because the report would be calculating a proportion of a proportion. To make this calculation assumes these proportions can be simultaneously applied, which may not be the case, resulting in incorrect results. Note also that Entire block applied with a stored proportion weighting will result in slightly different results to an unweighted Proportion of block report.
Click on a column to customise how the information is displayed. You can change the column title by editing the Heading field.
Enabling Show total will add a category row called Total with a summation for the categories. Any row that is a summation of categories will appear in bold in the table. It is possible to get a sub-total of some of the categories by grouping them, and these will also be shown in bold. To group categories, select multiple items in the Visible categories list by holding down the Ctrl key as you click the mouse. Click the Group button to add the new category.
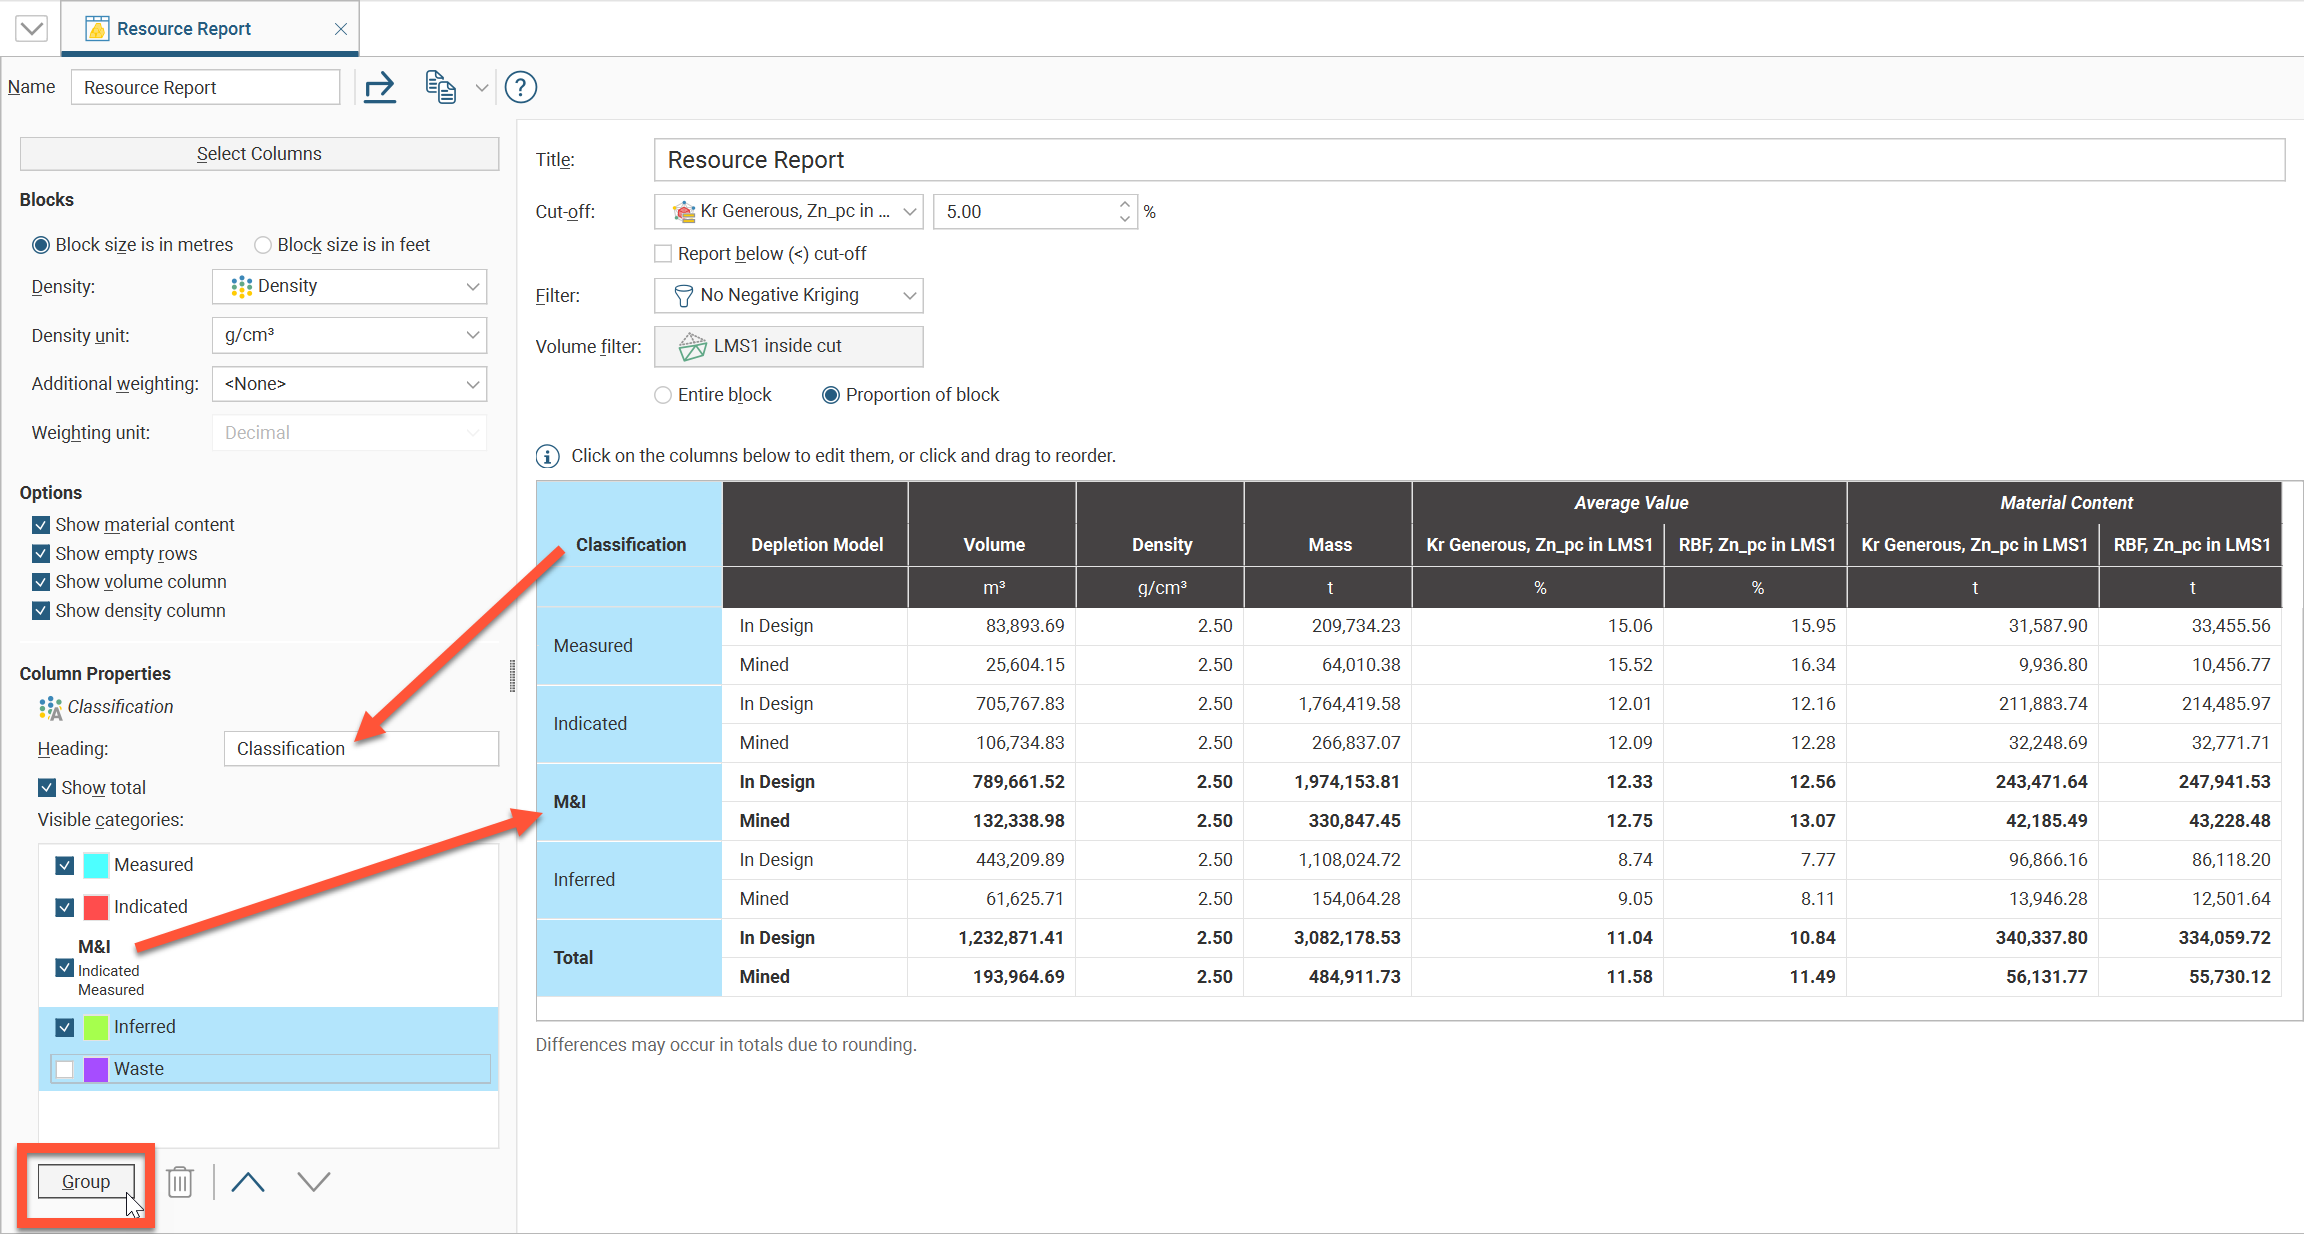
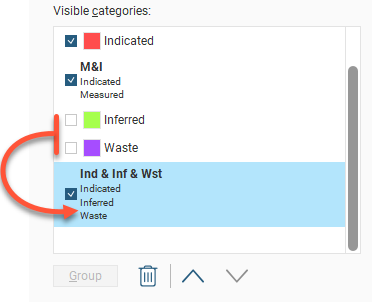
Note that some of the Visible categories can be unticked to hide them; these hidden categories can still be included in a grouped category:
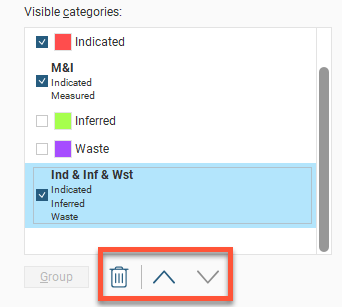
Select a category and click the up or down buttons to reorder them in the list. Delete a grouped category by selecting it and clicking the Delete button (![]() ).
).
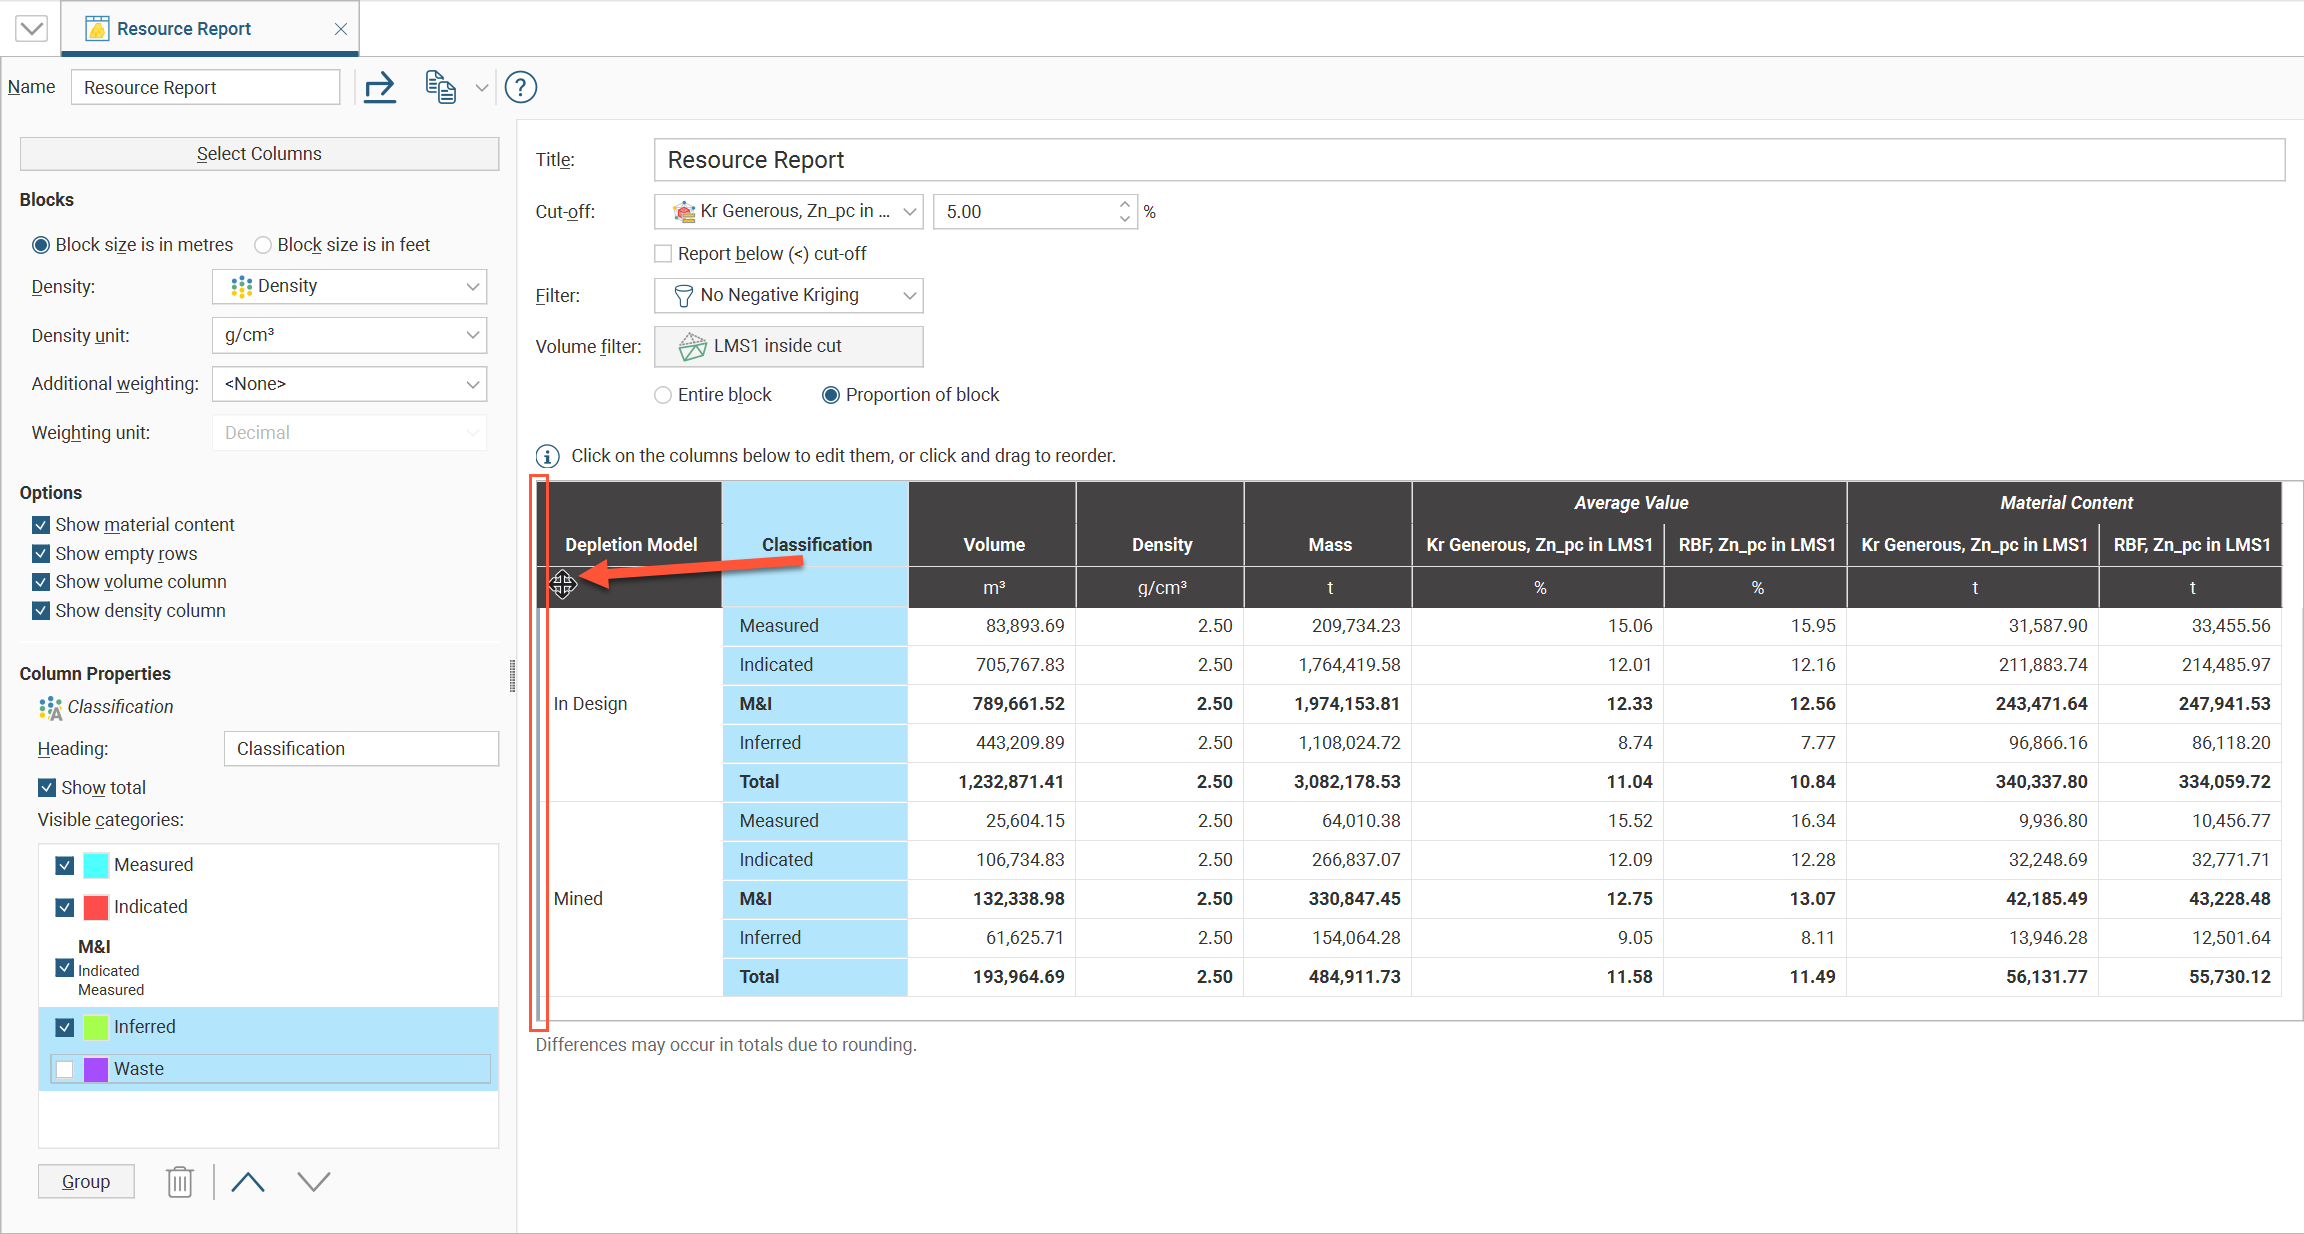
If there are multiple category columns, these can be reordered to select one as the primary categorisation, with the others shown as sub-categories. Click anywhere in a category column and drag it to a new location. While you hold down the mouse button, a vertical bar will appear where the column will be inserted:
When Average Value columns are selected, it is possible to change:
- The Heading
- The Data unit
- The Display unit to use in the table, which may be the Same as data or some other unit to convert to
- The number of Decimal places to display in the table
Data unit has the options Unknown, Grams per tonne, Parts per million, Parts per billion, Percent, Troy ounces per short ton, Dollars per tonne, Dollars per short ton, Milligrams per kilogram, Micrograms per kilogram, Milligrams per gram and Micrograms per gram. The Data unit may be automatically set based on indicators in the selected column name, but must be checked for correctness. Make sure that the column data matches the Data unit selected. Note that "dollars" is used as a general term to refer to whichever currency you are using.
When Dollars per tonne or Dollars per short ton are selected as the Data unit, the Display unit option is not selectable, and must be Same as data.
Material Content columns can have the Heading changed, as well as the column’s Unit and Decimal places.
The Report tab has Export and Copy options for making use of the resource report in external documents.
- Select Export to save the table as a Microsoft Excel spreadsheet, a CSV file, or an HTML file. Formatting is preserved in the spreadsheet and HTML file so the table will be arranged identically to the report in Leapfrog Works. CSV files do not contain formatted data. If you select CSV, you will also be asked if you would like to use the Rounded numbers used in the table, or Full precision numbers. You can also select between ASCII characters only and Allow all characters, with UTF-8 encoding, as required by the software you are exporting to.
- If you select Copy, then Copy Table, the table is copied to the operating system clipboard, and you can paste it into another application such as Microsoft Excel or Microsoft Word. Formatting is preserved so the table will be arranged identically to the report in Leapfrog Works and only the column and row sizes need to be adjusted to your preferences.
Reports you create appear in the Graphs and Tables section under the relevant block model. To delete a report, right-click the report and select Delete from the context menu.
In Leapfrog Works 2023.1 there may be a small difference in the values in a report using proportion of block volume filtering compared to the values in reports from earlier versions. Leapfrog Works 2023.1 introduced some improvements to how proportions are calculated and combined. Because computers do not store real numbers but convert them to binary, this can result in slight imprecisions when combining volume proportions that should add up to a whole 1. With the improvements introduced in Leapfrog Works 2023.1 that ameliorate this effect, there can be a slight change at about the fifth or sixth significant figure in reports making use of the proportion of block volume filter.
Proportions of Proportions Not Advised
When Additional weighting is set to something other than <None> while Volume filter is set to Proportion of block, Leapfrog Works shows a warning: Applying both a Proportion and a Weighting to the same block may affect the resulting calculations. This standard caution is displayed to make sure the combination being selected makes sense.
Often, it is not advisable to use a stored proportion Additional weighting along with a Volume filter. This is because the report would be calculating a proportion of a proportion. To make this calculation assumes these proportions can be simultaneously applied, which may not be the case, resulting in incorrect results. If the Additional weighting selected is not a volumetric proportion, there should be no conflict with a Proportion of block.
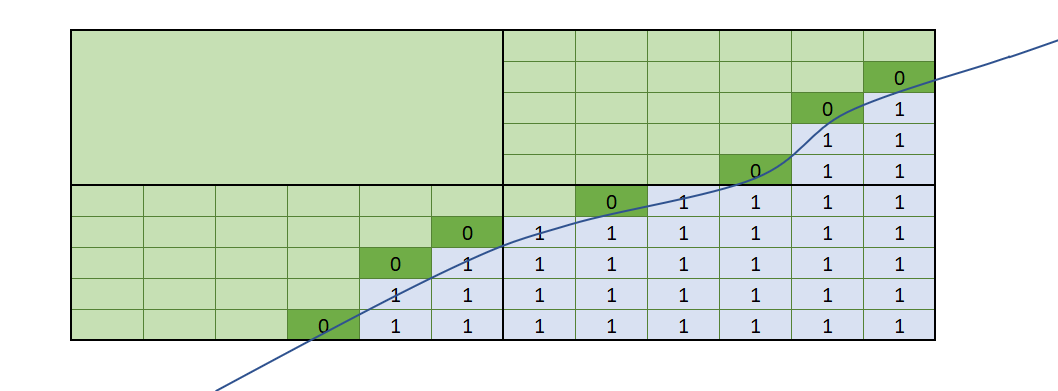
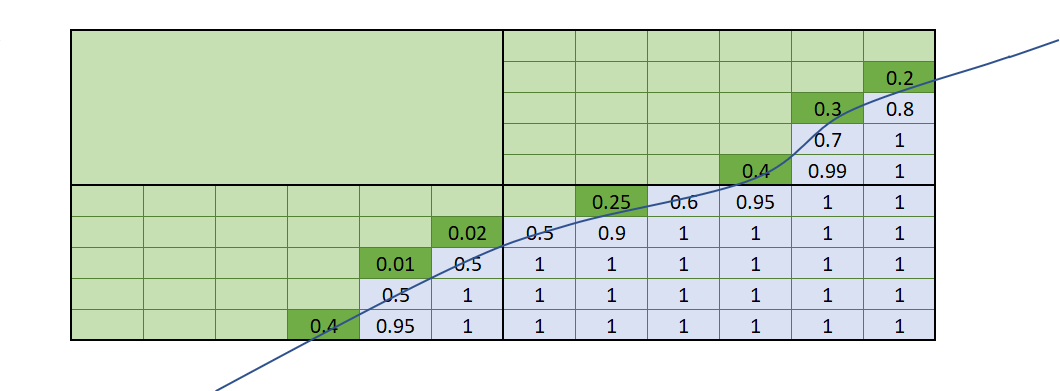
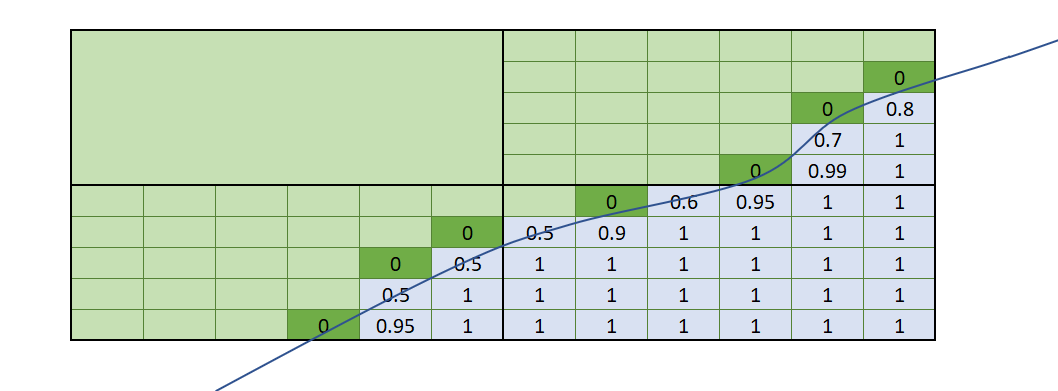
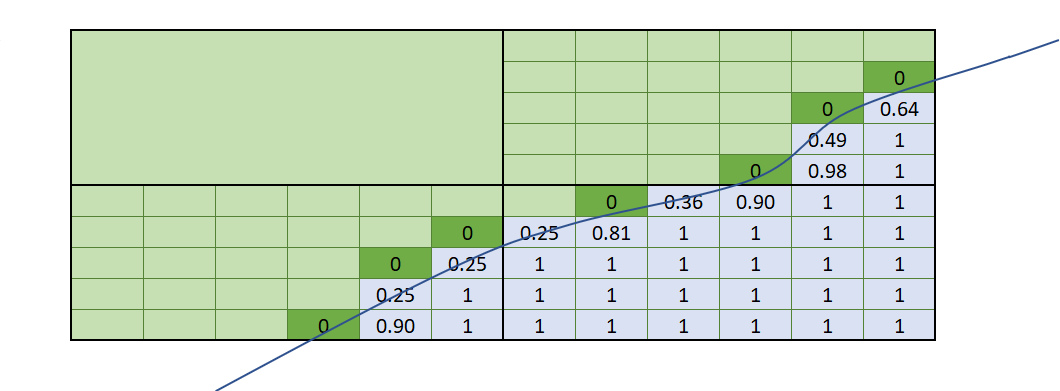
This matrix shows the results of the combinations of the volume filter’s Entire block and Proportion of block options against Additional weighting being selected as none or the volume of interest. The line crossing through the boxes shows part of a closed mesh volume. Blocks shaded grey have their block centroids within the mesh volume. Note that even though the same volume of interest is used in all cases, when both Proportion of block and Additional weighting are applied at the same time, the values in the blocks are undervalued because the proportion has been applied twice.
| Entire block (where centroid is inside mesh volume) | Proportion of block inside volume filter determined by mesh | |
| Additional weighting = <None> |
|
|
| Additional weighting of proportion inside mesh |
|
|
Note that the combinations:
- Additional weighting = <None> plus Proportion of block volume filter
- Additional weighting = proportion of block inside volume plus Entire block volume filter
do not result in precisely matching data. Take note of the dark green boxes that depict blocks with the block centroids outside the volume of interest. The Entire block volume filter selects only blocks that have the block centroid within the volume, so these dark green blocks get 0 values. When Proportion of block is used, even though the block centroid is outside the volume, the amount of the block within the volume is assigned as a value. Each approach is valid, and which you choose depends on the result you want to achieve.
Got a question? Visit the Seequent forums or Seequent support
© 2023 Seequent, The Bentley Subsurface Company