
Adding and Styling Points
The Points folder contains all points objects that have been added to the section layout. To add another points object, right-click on the Points folder and select Add Points. You will be prompted to select the interval tables to display; more than one can be selected. When available, filters can be selected to constrain the data in the selected table. Each selected table will be added as a separate item below the Points folder.
This list of interval tables will include downhole points, if they exist in the project. You can also add downhole points to the Boreholes section. Downhole points added in the Points folder will be projected using minimum distance projection. To ensure that downhole points coincide with borehole traces (which may use illustrative or orthogonal projection), add downhole points in the Boreholes section, as there the downhole points will use the same projection as the boreholes.
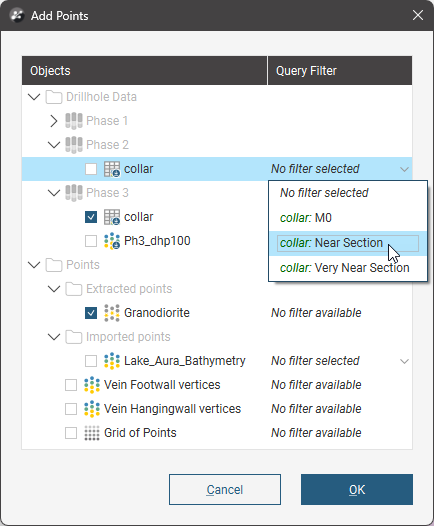
When you click OK, the points are added to the layout tree. They will be flagged with No Selection.
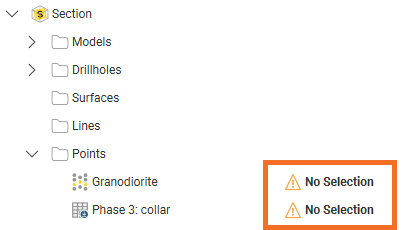
If you add a single points table, the Select Points window will automatically appear to prompt the selection of at least one data point. Otherwise, double-click on a points object to open the Select Points window.
This window can also be opened by right-clicking on the points object and selecting Projection settings.
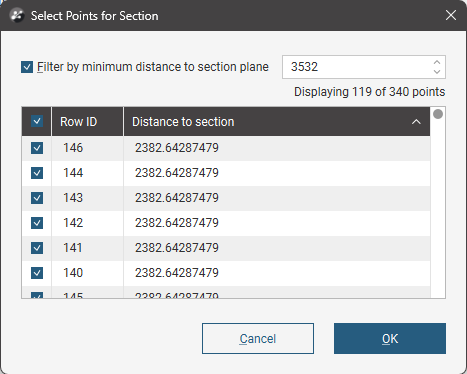
Enabling the Filter by minimum distance to section plane value sets a limit for the projection of the points onto the section.
Use the check boxes next to each point in the list to determine which should be projected. To select all, click the check box above in the table header.
If projecting drilling data points such as collar points onto a section, the Select Points for Section window will include a Hole ID column for ease of identifying which points you want to enable or disable when managing point visibility selections:
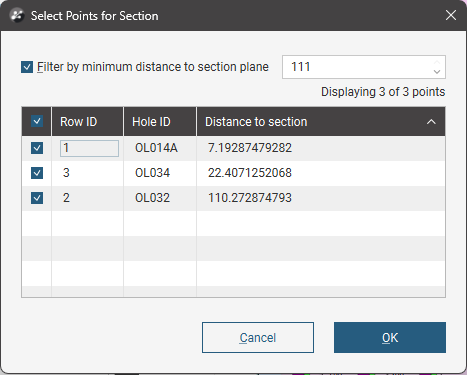
If projecting downhole points onto a section, the Select Points for Section window will include Hole ID and Depth columns for ease of identifying which points you want to enable or disable when managing point visibility selections:
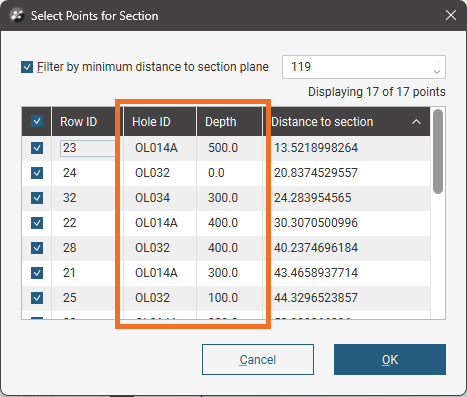
Like most tables, you can sort these projection settings table by clicking one of the column headers. You can cascade these table sorts; if you want to have the sort by Hole ID, then Depth,work backwards. Click the Depth header, then the Hole ID header.
Click on the points object in the layout tree to view point styling options. Visibility can be turned on or off and the Opacity of the points can be set.
The Colourings selection lets you choose the basis on which the points are coloured. If you choose Flat colour and click Options you can pick a Shape from 60 symbols, set the Size of the points on the section, and click the colour tile to make a new colour selection.
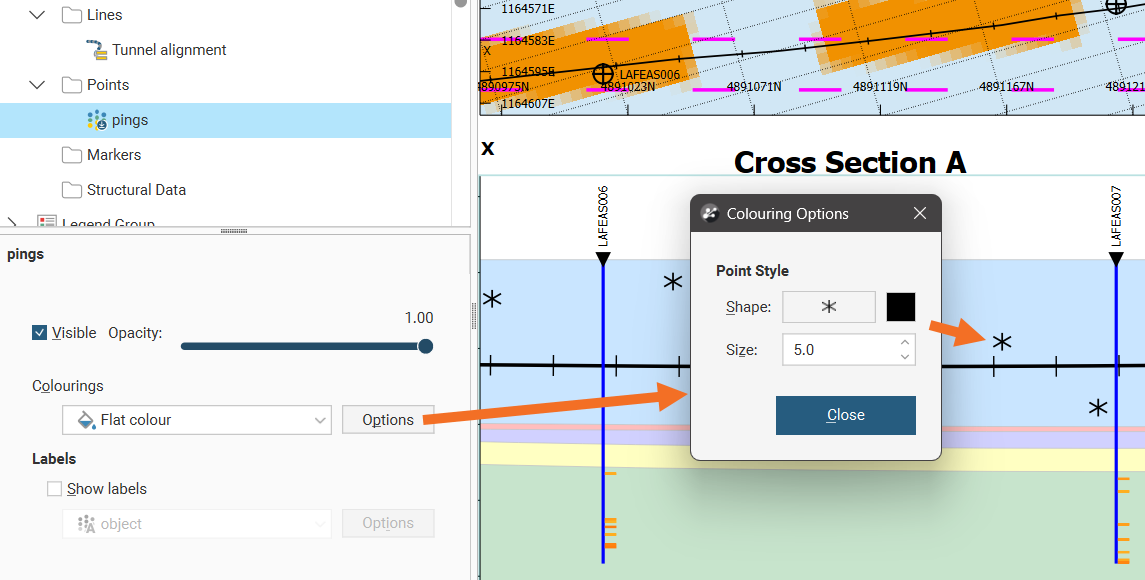
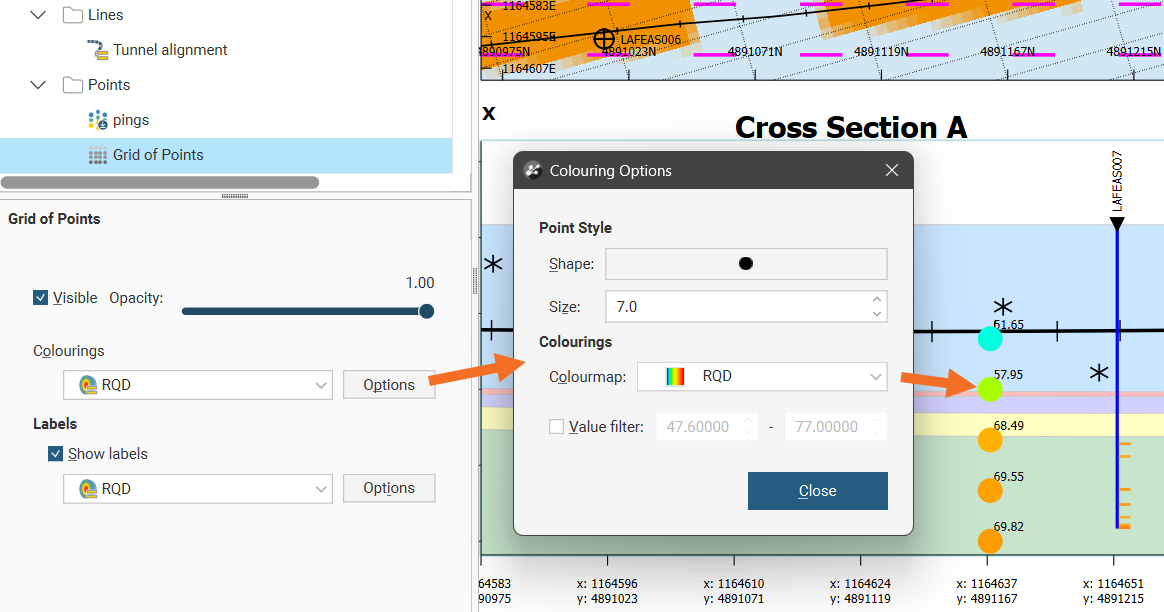
If you choose a numeric value column associated with the points data and click Options you can pick a Shape from 60 symbols and set the Size of the points on the section. You may also be able to select from available Colourmaps if more than one is available, and enable a Value filter to only show points between a specified minimum and maximum value.
If you choose a category column associated with the points data and click Options you can pick a Shape from 60 symbols and set the Size of the points on the section. You can also set the visibility for the points by category. The Code and Colour cannot be customised in this window.
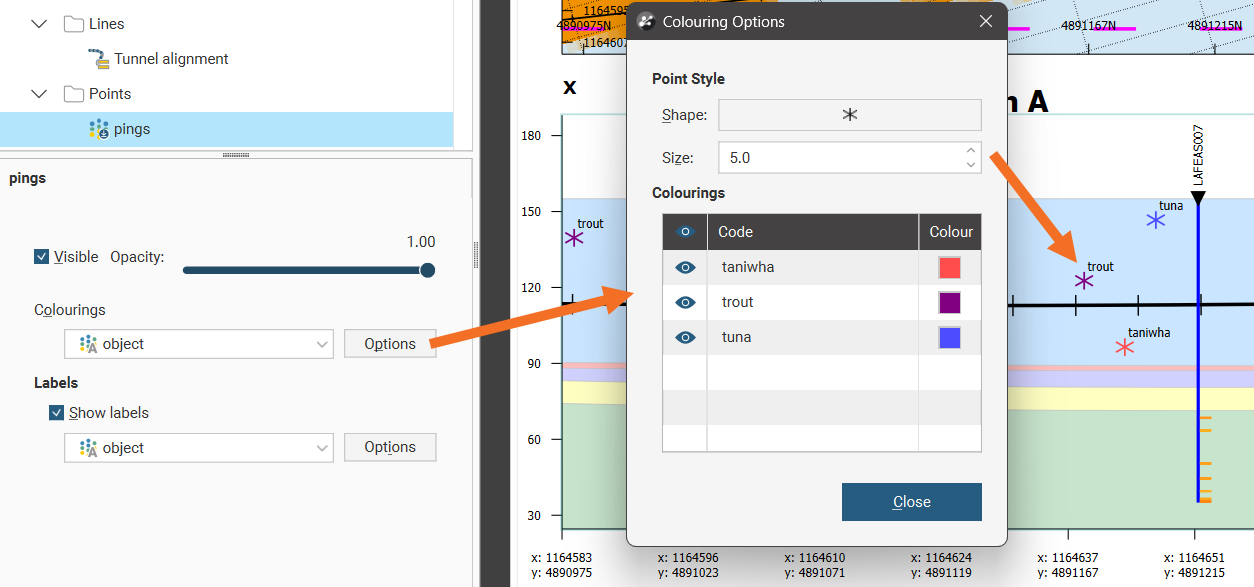
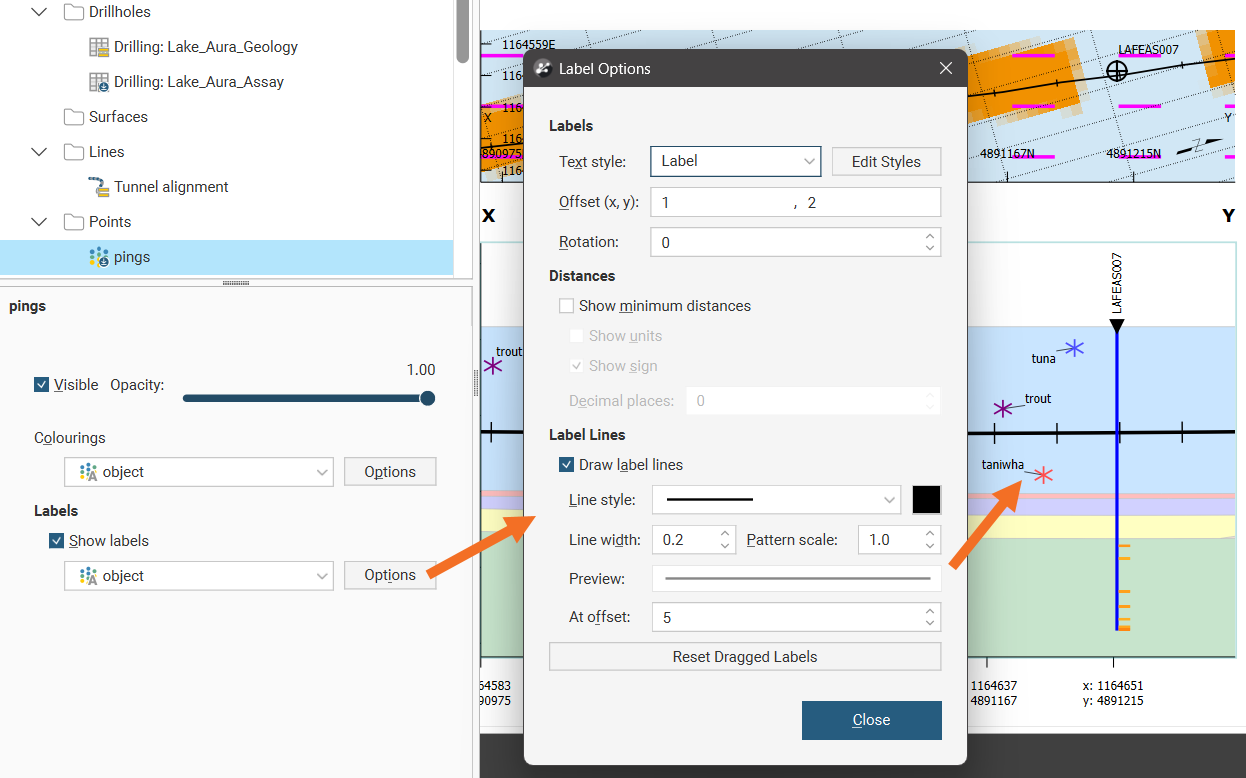
You can choose to Show labels or hide them. From the selector you can choose the same option as used for Colourings or a different option. Click the Options button to customise the labelling. Text style provides a list of available styles, or you can click Edit Styles to customise the style. Offset (x, y) positions the label a specified distance away from the point it is referencing. Rotation will put an angle on the label, useful when labels are close together. You can choose whether or not to Show minimum distances for the point from the section plane and you can also choose to Show units and specify the number of Decimal places to show.
When enabled, Show sign will add a + in front of the minimum distance if the point is behind the section, and a - in front of the minimum distance if the point is in front of the section. Points that pass through a section will have a minimum distance of 0 and no sign will be shown.
Labels can have a line connecting them to the point they refer to, if Draw label lines is ticked and once the label is more than the At offset length away from the point. The Line style, Line width, Pattern scale and colour can be customised. A Preview shows what the line will look like on the section.
Labels on sections can be selected and dragged into a new position to avoid overlapping with adjacent items on the section. Click the Reset Dragged Labels button to restore them to the default position.
If you have downhole points in the Points folder styled how you wish, but you want to have them in the Boreholes folder so the projection onto long sections matches the borehole traces, you can move the downhole points and retain the styling. Right-click on the Boreholes object and select Add Boreholes. Select the downhole points object you already have added and styled in the Points folder. You will see a message saying that the selected object already exists and if you proceed, it will be moved.
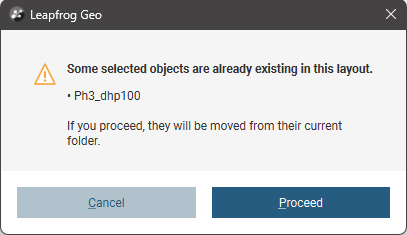
If you click the Proceed button, the downhole points will be relocated along with all their existing styling.