Adding and Styling Structural Data
The Structural Data folder contains all structural data objects that have been added to the section layout. To add another structural data object, right-click on the Structural Data folder and select Add Structural Data.
Click on the structural data object in the layout tree to view styling options. Visibility can be turned on or off and the Opacity of the structural data can be set.
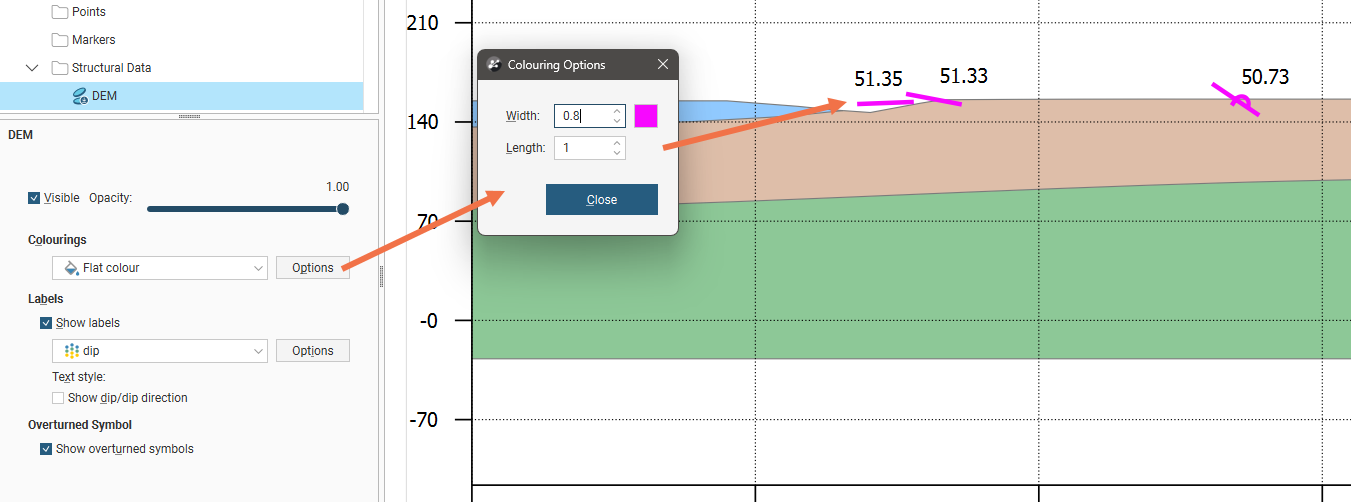
The Colourings selection lets you choose the basis on which the points are coloured. If you choose Flat colour and click Options you can set the Width of the lines in the symbol and the Length changes the size of the symbol, and you can click the colour tile to make a new colour selection.
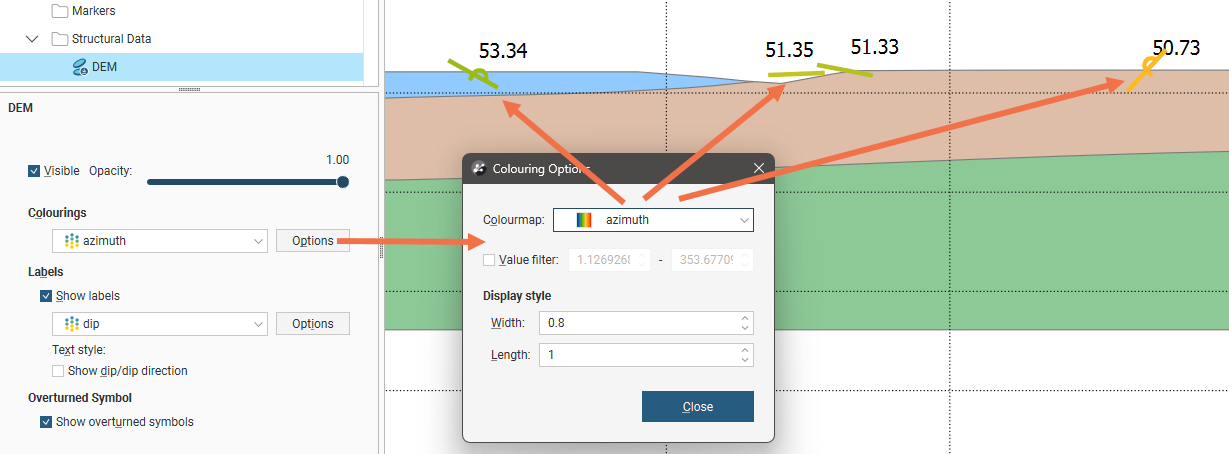
If you pick one of the azimuth, dip or polarity options instead of Flat colour, the symbols will be coloured according to a selected Colourmap. A Value filter can be used to limit the structural data points that are displayed to those within a minimum and maximum range for the selected orientation parameter. The Width and Length settings control the thickness of the lines in the symbol and the size of the symbol, respectively.
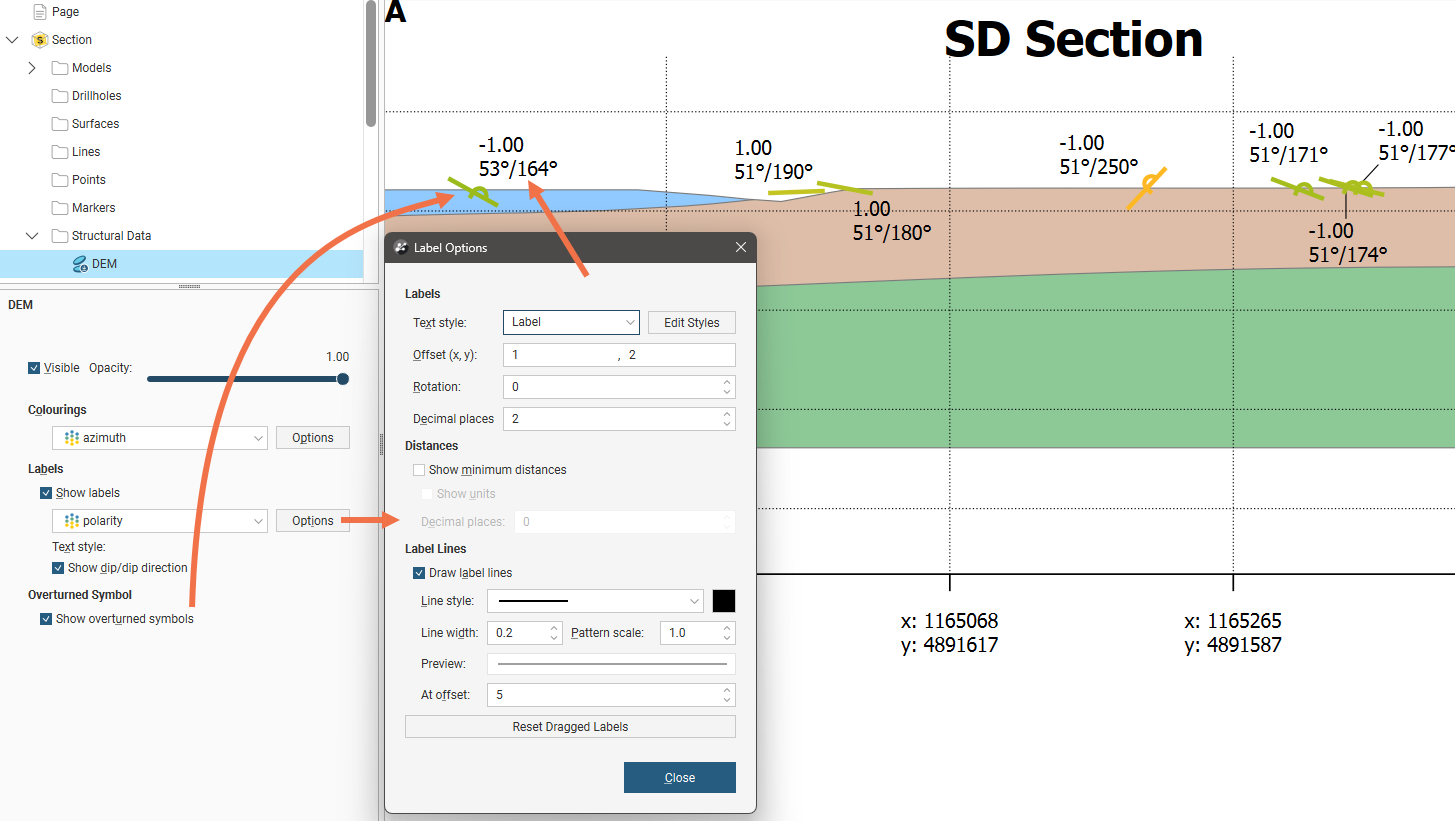
You can choose whether or not to Show labels, and choose from the Row ID, azimuth, dip and polarity options. There is also a <None> option, which is useful in conjunction with the tick box Show dip/dip direction which will add that pair of structural data orientation values. Having that enabled with dip or azimuth selected as the label option will result in redundant information being shown, so this tick box is really intended to supplement the Row ID, polarity, and <None> options.
When the Show overturned symbols tick box is unticked, all the structural data symbols appear as a bar on the section. When ticked, overturned structural data points are indicated with the addition of a swirl in the middle of the bar.
Click the Options button to customise the labelling. Text style provides a list of available styles, or you can click Edit Styles to customise the style. Offset (x, y) positions the label a specified distance away from the point it is referencing. Rotation will put an angle on the label, useful when labels are close together. The Decimal places setting under the Labels heading sets how many decimal places are shown in the label value. You can choose whether or not to Show minimum distances for the borehole from the section plane and you can also choose to Show units. The Decimal places setting under the Distances heading sets how many decimal places are shown in the minimum distance value.
When enabled, Show sign will add a + in front of the minimum distance if the structural data symbol is behind the section, and a - in front of the minimum distance if the structural data symbol is in front of the section. Structural data symbols that pass through a section will have a minimum distance of 0 and no sign will be shown.
Labels can have a line connecting them to the structural data they refer to, if Draw label lines is ticked and once the label is more than the At offset length away from the structural data. The Line style, Line width, Pattern scale and colour can be customised. A Preview shows what the line will look like on the section.
Labels on sections can be selected and dragged into a new position to avoid overlapping with adjacent items on the section. Click the Reset Dragged Labels button to restore them to the default position.