
Introduction to Points Data in Leapfrog Energy
Points are sets of X-Y-Z coordinates, with or without associated values. In Leapfrog Energy, points are used to define surfaces and for interpolation. You can use the Points folder to import different types of points data, extract points of data in the project, create guide points and create grids of points that can be evaluated against geological and numeric models and exported for use in other modelling.
The rest of this topic is divided into:
Types of Points
Leapfrog Energy has two broad categories of points, each containing several types of points:
- Derived points. These are points objects created from other data in the Leapfrog Energy project and will update as the source data changes. These data types include:
- Contact points. See Extracting Contact Points from Drilling Data.
- Guide points. See Creating Guide Points.
- Intrusion values. See Extracting Intrusion Values from Drilling Data.
- Interval mid points. See Extracting Interval Midpoints from Drilling Data.
- Grid of points. See Grids of Points.
- Combined points. See Combining Points Tables.
- Imported points. These are point locations that are imported into Leapfrog Energy without direct association to other data objects. See Importing and Reloading Points Data for information on importing this data.
Some points functionality is limited to imported points only. Derived points cannot, for instance, be selected and used to set elevation data.
If you have a derived points object you wish to utilise with functionality that is limited to imported points, you can export the points object and re-import it. The new object will not be derived from a parent data object and therefore will not automatically update as other data changes.
Displaying Points
Points data can be displayed using a single flat colour, using a colour gradient or using the points values. You can also import a colourmap, which is described in Colour Options.
As with wells, points data can be displayed as flat points or as spheres. When Make points solid button ( ) is enabled for points data, the data points are displayed as spheres. Here, the values are displayed as flat points:
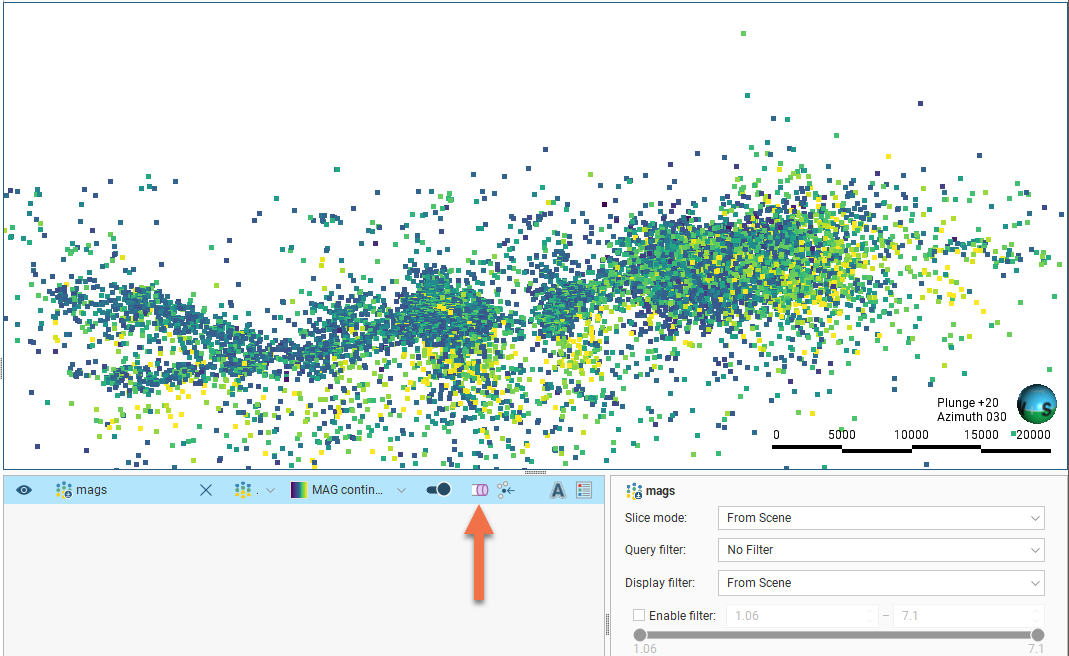
You can restrict the range of values displayed using the Display filter in the properties panel.
When using the spheres option, the points can be displayed using the values from any column in the points table. To do this, select a column from the Radius values list in the properties panel:
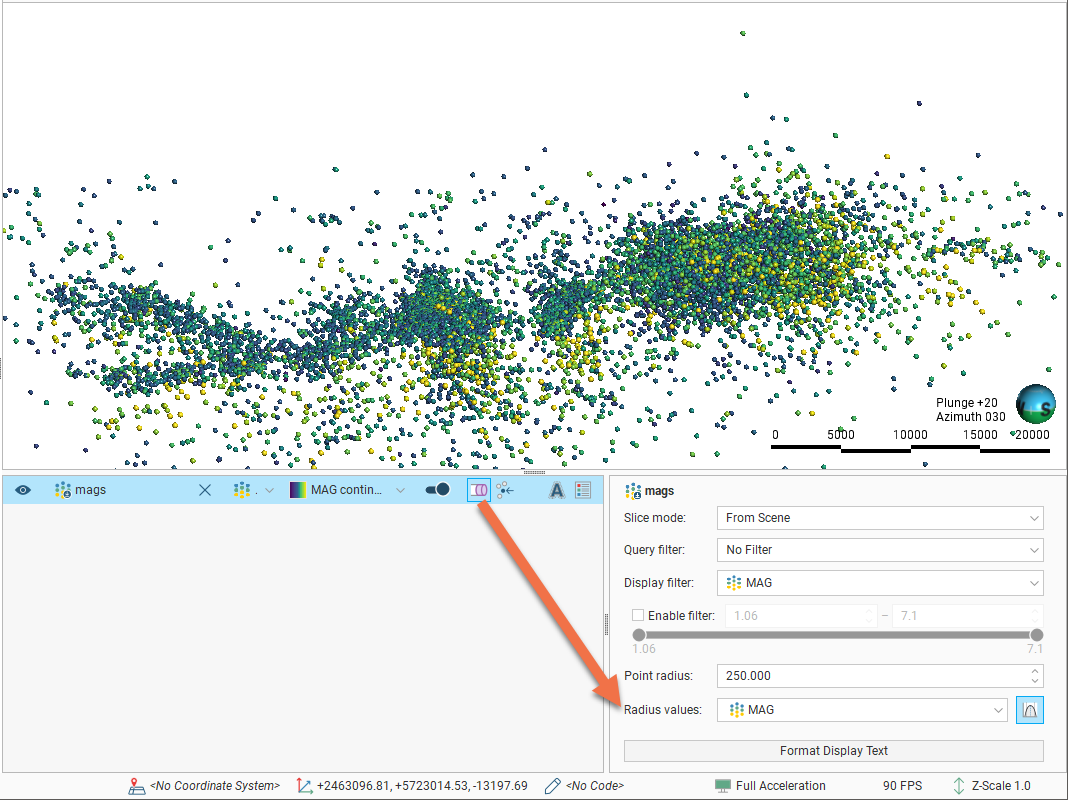
The Point radius setting then determines the maximum point size displayed in the scene.
Evaluating Points Data
Points data can be modified and evaluated against geological models, numeric models and estimators, as described in Evaluations.
In the case of geological models, you can also combine two or more models to evaluate the points data and set the priority used for evaluation. To do this, click on the Combined Evaluation button in the Select Models To Evaluate window. In the window that appears, select the evaluations to combined, then set their priority. Click OK to create the combined evaluation, then click OK in the Select Models To Evaluate window. The combined evaluation will be available from the colour list.
To delete a combined evaluation, click on the Delete Combined button in the Select Models To Evaluate window.
Setting Elevation for Points
You can set the elevation for imported points tables by projecting them onto a surface. This overwrites elevation values in the z column of the imported points table, using the data from the selected surface. If the surface does not intersect vertically with all points, you can choose how the z values for those unprojected points will be handled.
Derived points cannot be projected onto a surface to set the point elevation.
To set the elevation for points from a surface, right-click on the imported points object in the project tree and select Set Elevation. The Set Elevation window will appear:
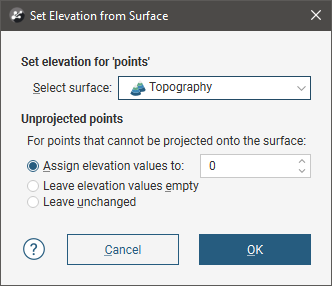
Select from the surfaces available in the project.
Next, select how unprojected points should be handled. There are three options:
- Assign elevation values to sets the z values to a fixed elevation for all unprojected points.
- Leave elevation values empty clears the z values for all unprojected points.
- Leave unchanged makes no changes to the z values for unprojected points.
Click OK to set elevation values.