Filtering Data in the 3D Scene
When data tables are displayed in the 3D scene, there are two ways of filtering data to aid interpreting the data. These are:
Filtering Data Using Queries
In Leapfrog Energy, you can define query and volume filters for data tables that select a subset of data for future processing; this is described in the Filtering Data topic. Filters can also be used when displaying data in the scene.
To apply a filter to the scene, select the object in the shape list, then select the filter from the Query filter list in the shape properties panel. For drilling data, any defined volume filters can will also be displayed in the Query filters list.
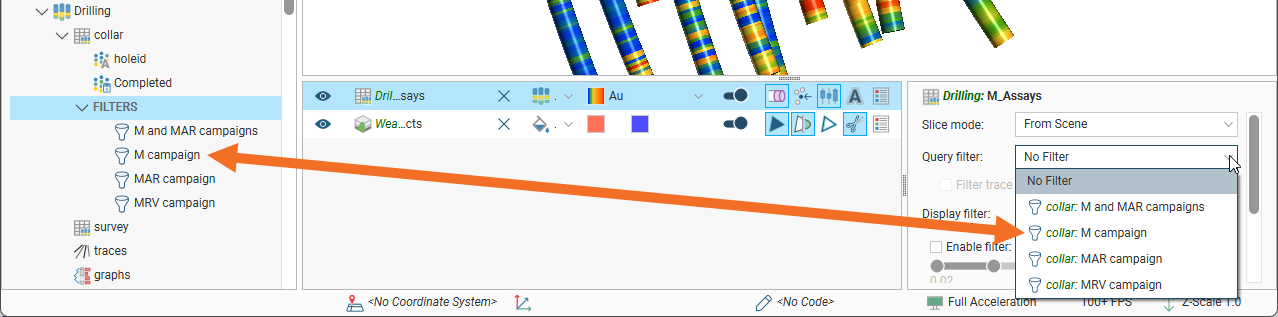
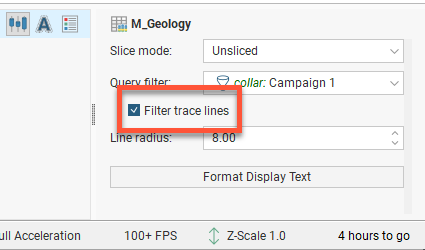
For a drilling data table, this displays only the data selected by the filter. The trace lines remain displayed in the scene. To filter out the trace lines so they are not displayed in the scene, tick the Filter trace lines box:
Using the Display Filter
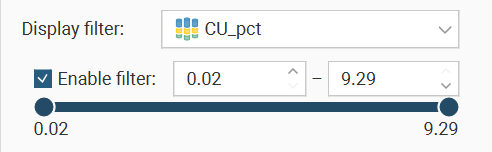
In the shape properties panel, you can also filter the range of values displayed. In the Display filter field, select the column to use as the value range filter. It does not need to be the same column as that selected in the shape list. Tick the Enable filter box to apply the filter or untick the box to stop using the display filter without discarding your filter selection settings. This allows you to turn the filter on and off easily, without having to redefine the filter each time.
If the column you select for the Display filter is a numeric column, a range slider will be displayed for selecting the values to filter:
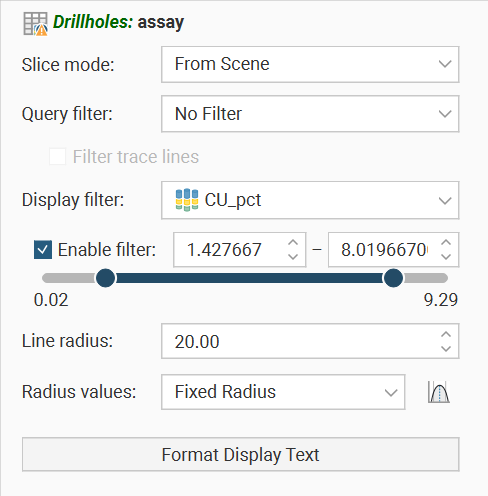
The lower and upper value bounds can be set by dragging the handles at each end of the range slider, or by entering values into the boxes above the range slider.
Range sliders have two modes: coarse control and fine control. Here a range slider is used for a set of values that ranges from 1 to 160; it is displayed in dark blue, to show the full range of values in coarse control mode:

You can restrict the data displayed by dragging on the handles. Here the range of values is restricted to 1 to 50:

You can click and drag on the selected range to change the values displayed:

To switch to fine control, double-click anywhere along the range slider. Here the range of 52-101 has been expanded along the whole slider, giving you more control over the position of the range end points:
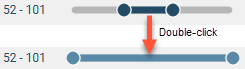
The slider is displayed in light blue in fine control mode.
Now you can use the handles to further restrict the range displayed:
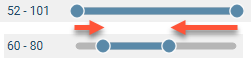
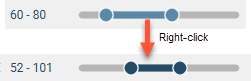
Right-click on the slider to return to coarse control and the full range of values. Here, right-clicking reverts to coarse control, with the range restricted to the original range of 52-101:
If the column you select for Display filter is a category column, the options for selecting the values to filter will look like this:
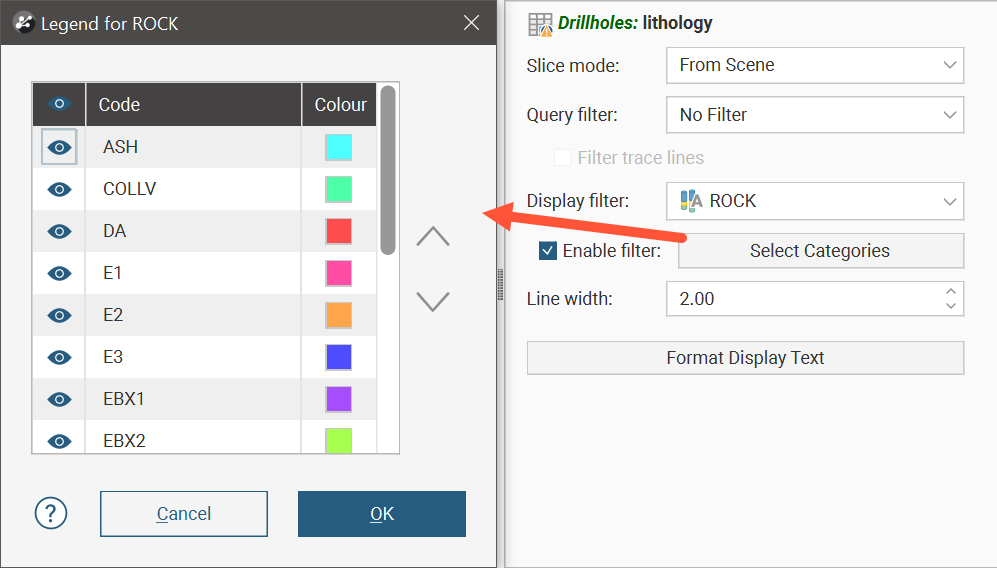
Click the Select Categories button to open a dialog that will allow each individual category to be shown or hidden.
If the column you select for Display filter is a date/time column, the options for selecting the values to filter will look like this:
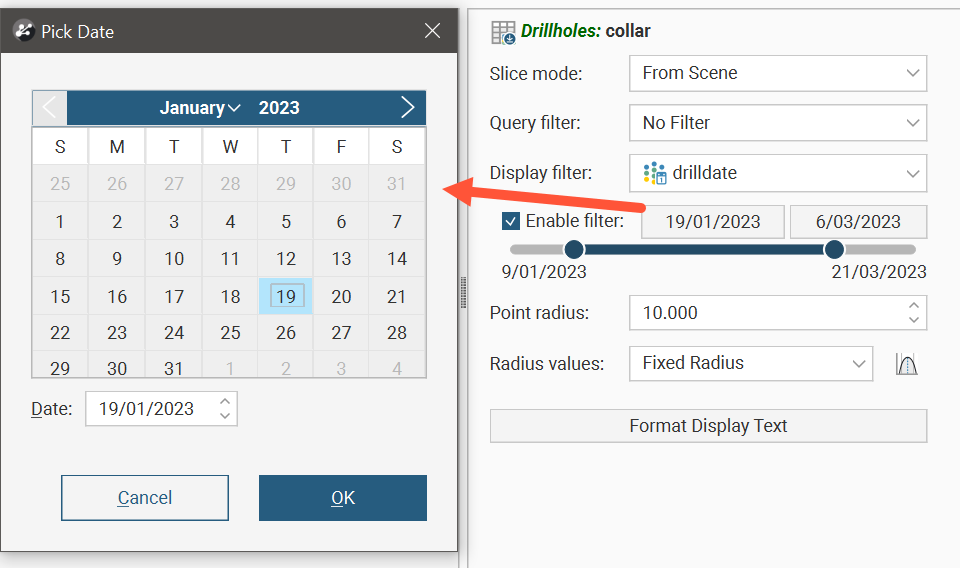
The lower and upper value bounds can be set by dragging the handles at each end of the range slider, or by clicking the date buttons above the range slider, which will open a date-picker dialog.
When the range slider is set to a portion of the whole value range, it can be clicked and dragged to move both the lower and upper limits by the same amount. This is handy when specifying a particular window which you can then drag across the whole range to observe the effect in the scene.
These range sliders have a feature that helps with fine refinement of the value range selection. Double-click on the range slider:
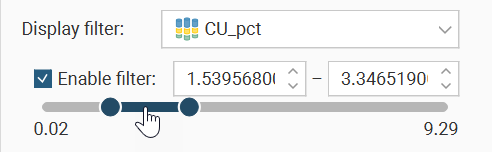
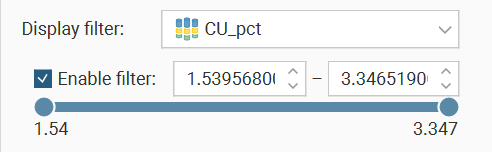
The slider will change to a pale blue and while the lower and upper limits remain the same, the slider has changed to fill the whole width of the shape properties panel.
You can then manipulate the lower and upper end points, and because the range has been restricted, you have finer-grained control as you move the range slider handles.
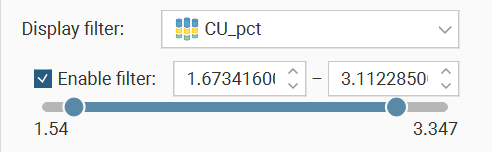
You can double-click the range slider to zoom in even further for higher resolution control.
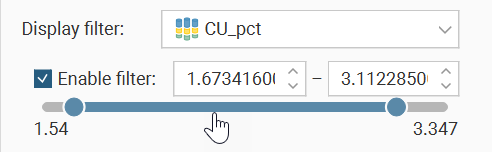
To return to the previous level of range selection, right-click the range slider.
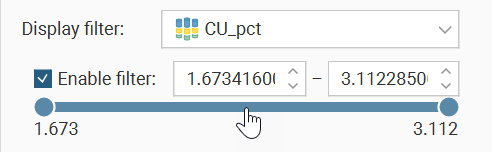
Repeat the right-click on the range slider again to go back another level.
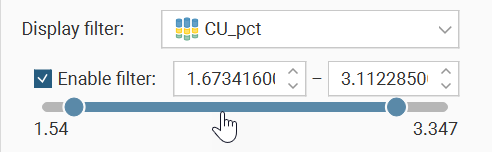
When you get back to the original range selection zoom level , the range slider will change back to dark blue.
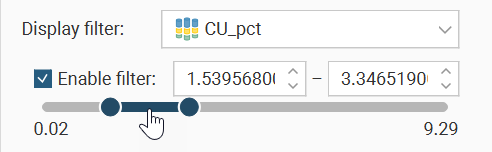
Right-clicking the range slider at this point will revert the range selection to the full value range.