Working With Data Tables
This topic describes how to work with data tables in Leapfrog Geo. It is divided into:
- Importing Data Tables and Mapping Data Columns
- Data Tables in the Project Tree
- Deleting Data Columns
- Viewing Table Data
- Adding and Updating Data for Existing Tables
- Mapping to a Different Data Source
Importing Data Tables and Mapping Data Columns
Importing data tables into Leapfrog Geo involves selecting the files to import and then mapping the data columns in the files to the format Leapfrog Geo expects. The data columns Leapfrog Geo expects differs for different data types, and you can find more information about the expected format in the help for each data type. See:
- Importing Drilling Data
- Importing Points Data
- Geophysical Data
- Importing Planar Structural Data
- Importing Lineations
Once you have selected the file or files to be imported, Leapfrog Geo prompts you to map the columns in the file to the expected format. For example, here we are importing a set of points. File Data shows a snapshot of the data in the file. The Column Summary shows what columns are in the file and how Leapfrog Geo will map these columns, unless you make changes in this window.
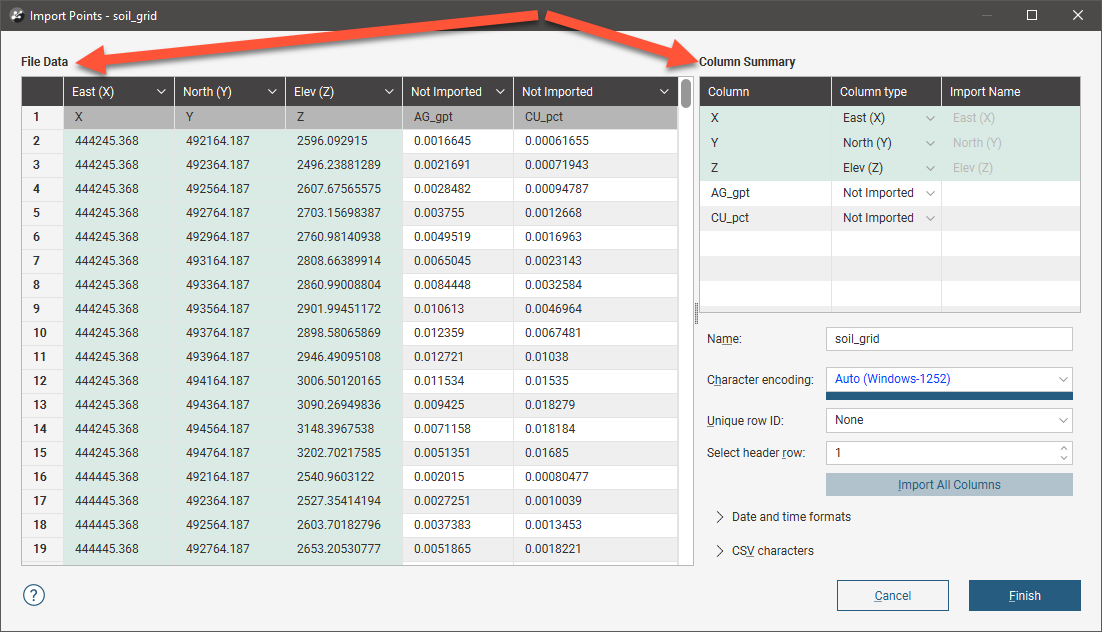
The fields below the Column Summary allow you to change settings such as the character encoding and date and time formats.
The dark header row shows how each column will be mapped in Leapfrog Geo and the row labelled 1 is the first row in the file. In this example, the first row of the file is the X, Y, Z, AG_gpt, CU_pct row.

For this file, columns X, Y and Z in the file have been mapped in Leapfrog Geo to columns East (X), North (Y) and Elev (Z). These are shown in green.
The AG_gpt and Cu_pct columns are currently marked as Not Imported.
Each type of table being imported will have different column assignments available, but all table types will display:
- The categories columns can be assigned to (top of the list)
- The option to not import the column
- The required columns, which in this example are East (X), North (Y) and Elev (Z)
- Any optional columns, which in this example is the Hole ID column
- The option to select a custom name
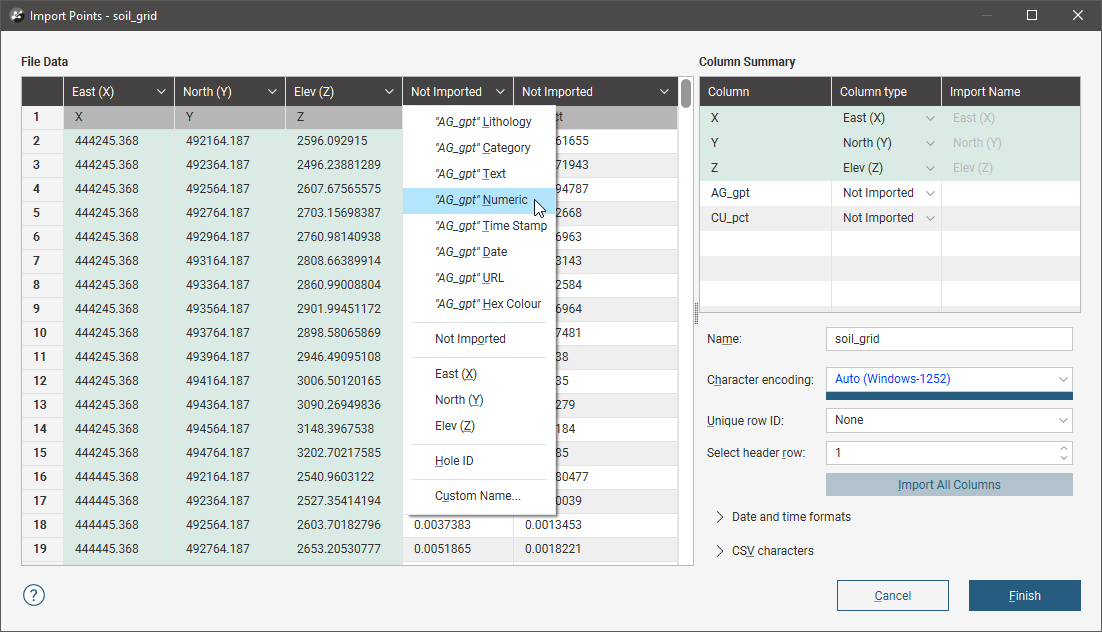
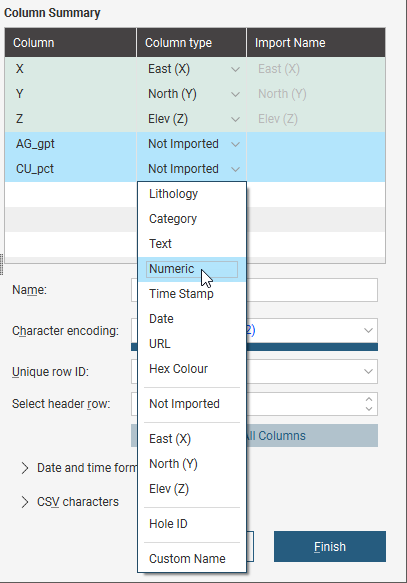
You can see the options available for importing columns by clicking on the column header. Here the AG_gpt column will be set to be a numeric data column:
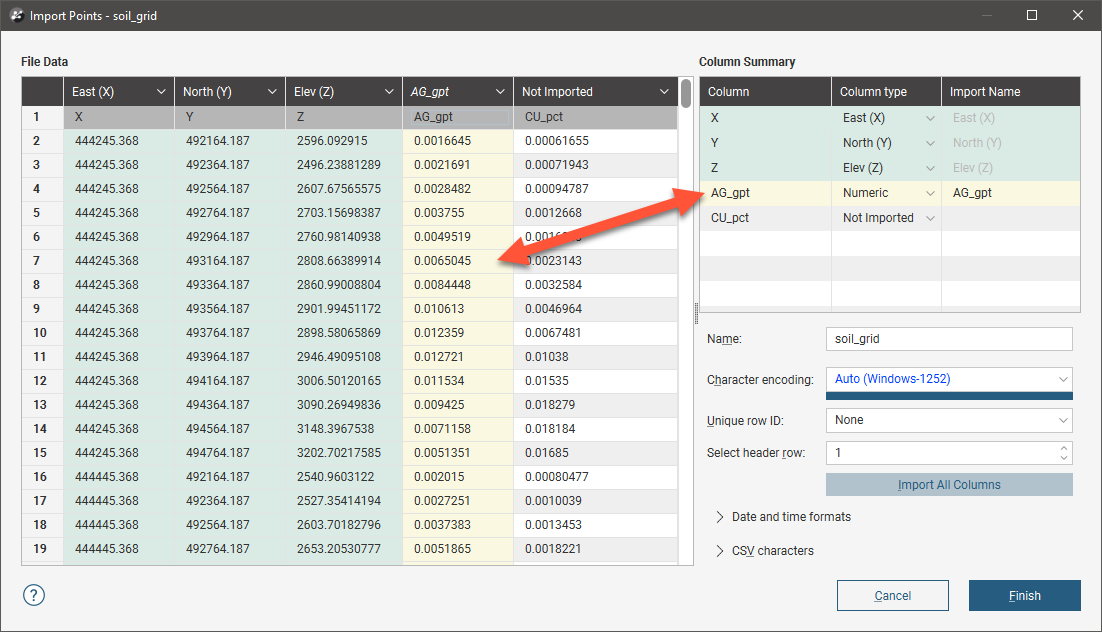
Note that both the File Data table and the Column Summary have been updated, with the new column assignment indicated in yellow:
If you choose not to import a column, you can do so later using the Import Column option, which is described in Importing Additional Columns to a Data Table below.
When setting import options for a column you can also work with the Column Summary. Here the Cu_pct column will be set to be a numeric data column:
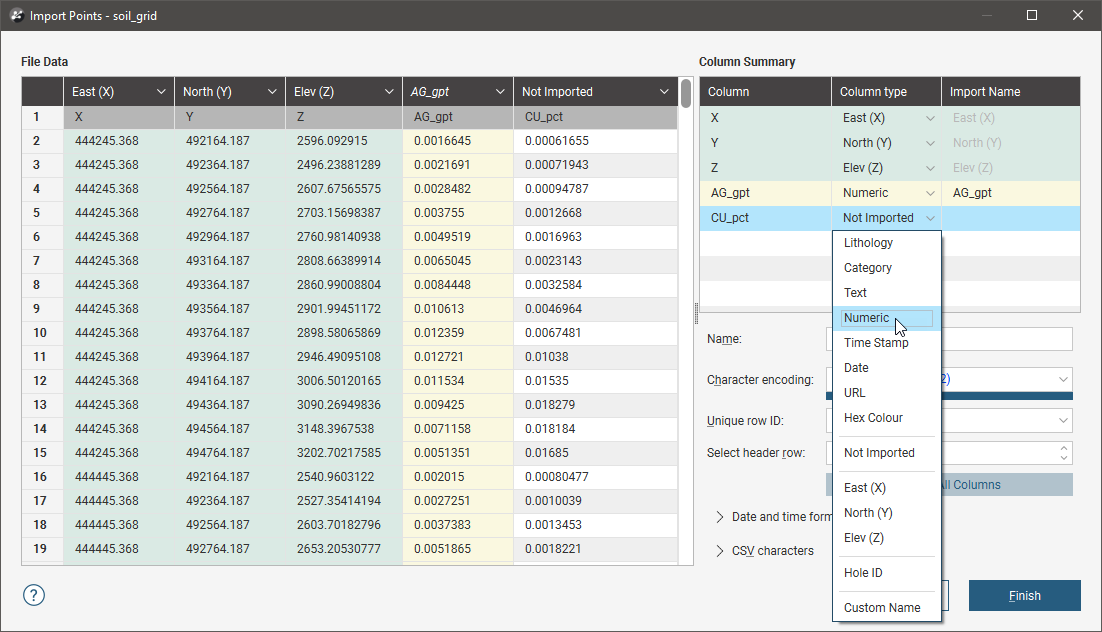
In the Column Summary, you can use the Shift key and the Ctrl key to select multiple columns, then change their Column type with one selection:
If you wish to import all columns, click on the Import All Columns button, then check that all columns have been correctly mapped.
You can select a column for import, then use it as a Unique Row ID. This can specify the column being used in other data systems to uniquely identify rows in a table. The column must not contain duplicate values. If a Unique Row ID is specified, Leapfrog Geo will use this column to match rows when appending columns or reloading tables.
If the data contains date and time information and the date and time format is not detected, click on Date and Time Formats to reveal more information:
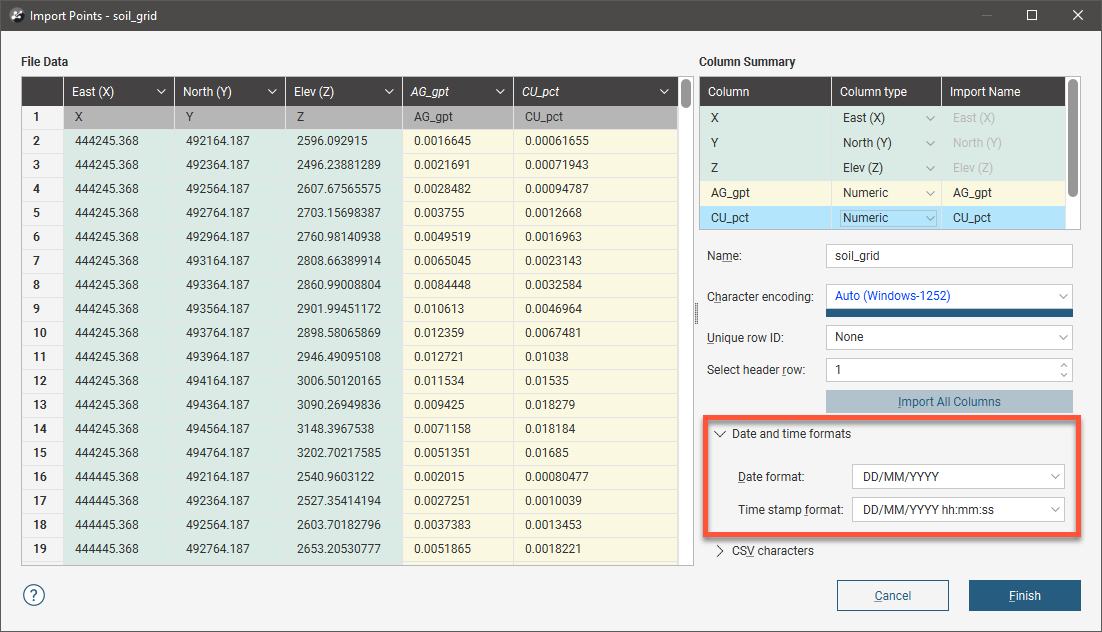
If the date and time format you wish to use is not among the options, you can create a custom format.
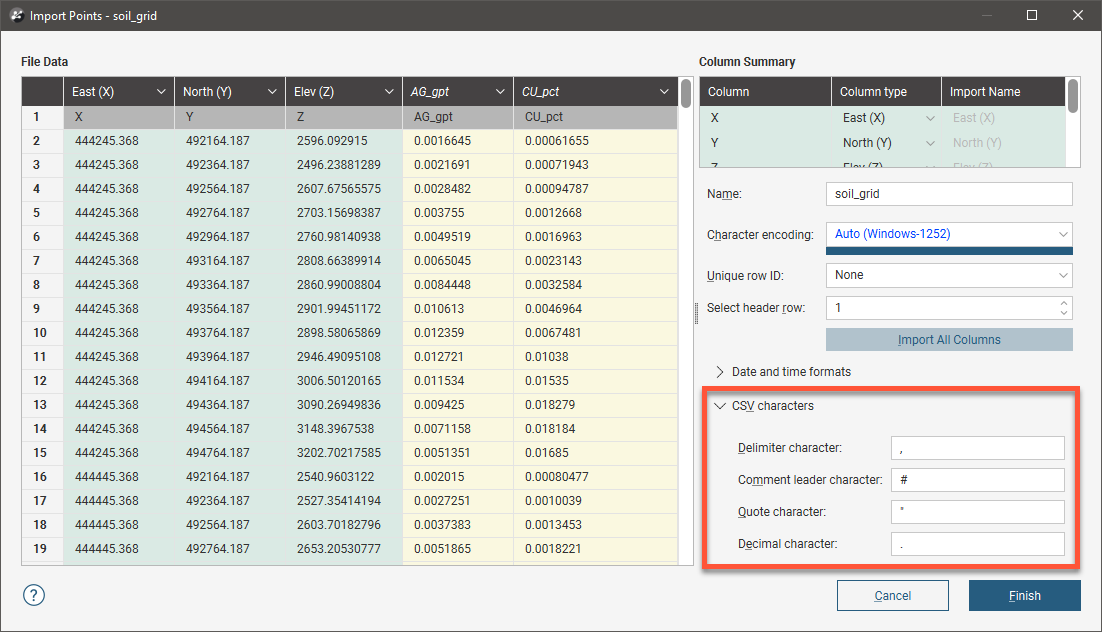
For *.csv files that use characters other than the comma as the separator, you can specify the delimiter, comment leader, quote and decimal characters in the Import window. Click on CSV characters to enter the characters used in the data files:
Data Tables in the Project Tree
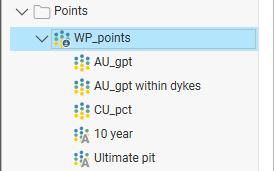
Expand a data table in the project to see the columns in the table. Here the WP_points table contains three numeric data columns (![]() ) and two category data columns (
) and two category data columns (![]() ):
):
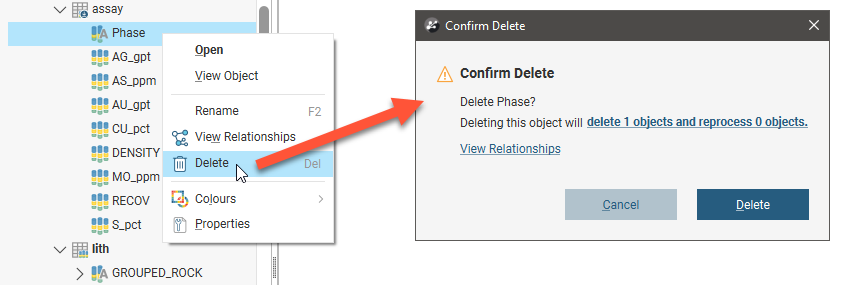
To delete a column, right-click on it and select Delete. You will be asked to confirm your choice, as any objects in that project that have been created from that data column will also be deleted.
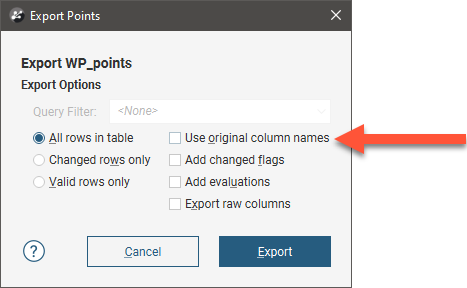
To rename a column, right-click on it and select Rename. If you later export the table and wish to use your new column name in the exported table, make sure you untick the Use original column names option:
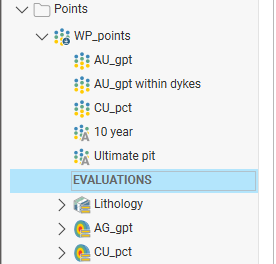
You can evaluate models onto data tables, as described in Evaluations. Evaluated models will appear under the table as a separate set of objects:
Deleting Data Columns
You can delete data columns by right-clicking on them and selecting Delete. You will be asked to confirm your choice.
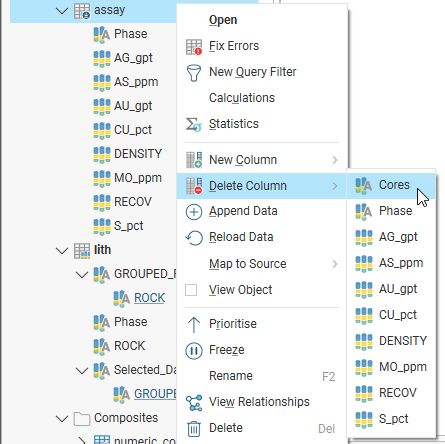
Some table columns are not shown in the project tree, such as text or URL columns that cannot be visualised in the scene. To delete one of these ‘hidden’ columns, right-click on the table and select Delete Column. All columns in the table are listed, including hidden columns such as the Cores column here, which is a column of URLs:
Viewing Table Data
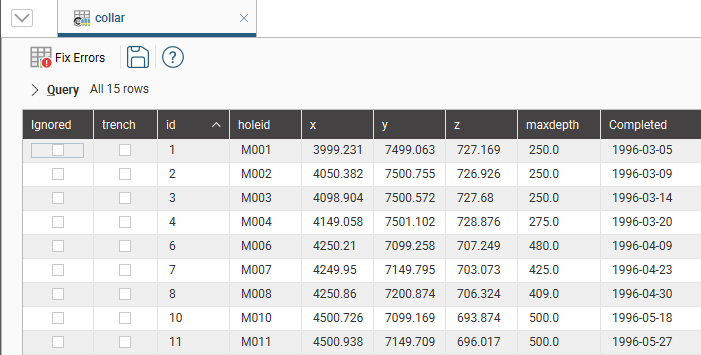
To view the contents of a data table, double-click on it in the project tree. The Table window will appear:
To view the contents of the attribute table for a GIS object, right-click on the object and select Attribute Table.
If the Ignored column is ticked, then Leapfrog Geo completely ignores that row, as though it has been deleted. This is useful for suppressing erroneous data from being processed.
If a row in a collar table is ignored, then all other data associated with that hole (e.g. surveys and interval measurements in other tables) are also ignored.
Collar tables have a trench column that indicates whether or not the drillhole is from a trench. When the trench column is ticked for a drillhole, the trench will be desurveyed in a different manner from other drillholes. See The Raw Tangent Algorithm for more information.
Cells in a table are editable, apart from the id column, which Leapfrog Geo uses as unique identifier. Double-click in a cell to edit it. If the cell you wish to edit is already selected, press the space bar to start editing.
When you edit a cell, the change will be indicated in bold text:

When you save the table, the edited text will no longer be displayed in bold.
The controls in the table toolbar provide quick access to table operations:
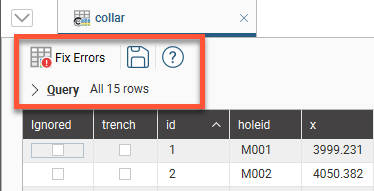
Click on Fix Errors to begin correcting errors in the table. See Identifying and Correcting Data Errors in Leapfrog Geo for more information.
Click on Query to open up the query editor:
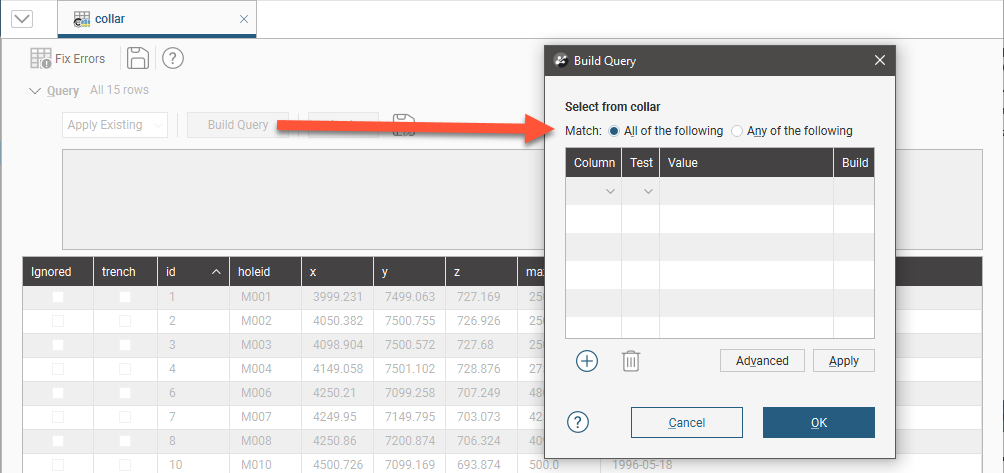
See the Query Filters topic for more information on how to build and use queries.
Adding and Updating Data for Existing Tables
If you wish to add or update data for an existing data table, you have several options. Which you choose depends on what new data is available:
- If new columns of data are available or if when you imported a table, you did not import all the columns, use the Import Column option. See Importing Additional Columns to a Data Table below.
- If new rows of data are available, use the Append Data option. See Adding New Rows to Existing Data Tables below.
- When the data in the table has been updated outside of Leapfrog Geo and you wish to refresh the data, use the Reload option. Note that the Reload option overwrites existing data. See Reloading Data Tables below.
Importing Additional Columns to a Data Table
If new columns of data are available or if when you imported a table into Leapfrog Geo you did not import all the available columns, you can add more columns by right-clicking on the existing table and selecting Import Column. You can choose the file to use as part of this process, so the new columns can be in the original file or in separate files.
Importing a column is similar to importing tables themselves. Leapfrog Geo will display the data in the file in the Add Table Column window and you can select how you wish to import any additional columns. Here, we will import the CU_pct column as numeric data:
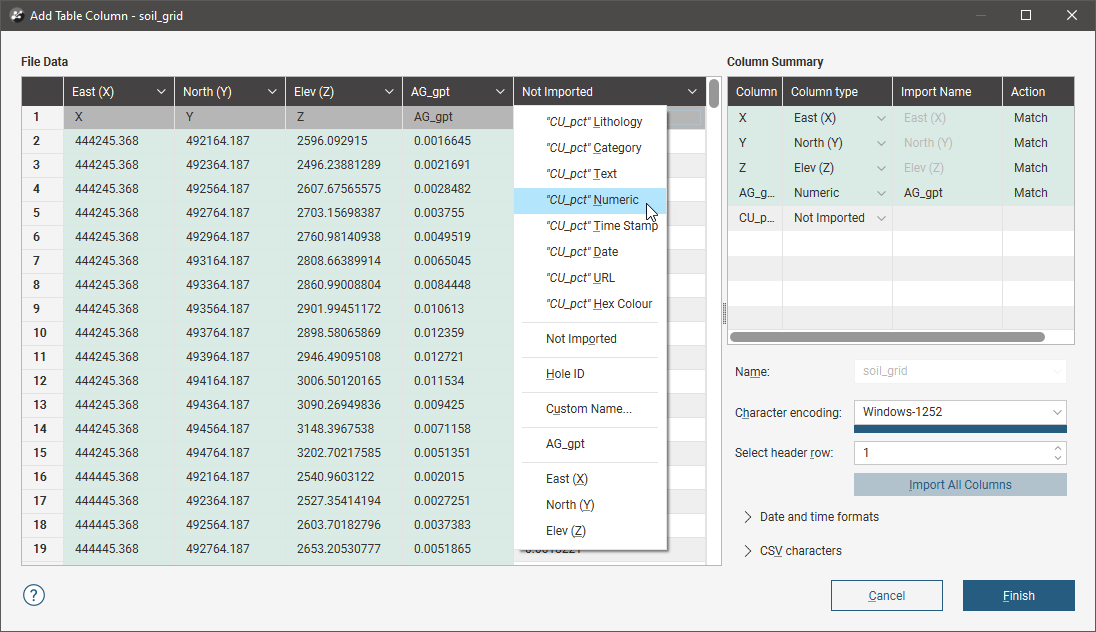
It is not necessary to re-import any columns that are already part of the project.
Click Finish to import the new column.
Adding New Rows to Existing Data Tables
If new data rows are available for a table you have already imported into Leapfrog Geo, you can add the new data by appending it to the existing table.
Append data when you wish to add extra data to existing columns.
- If you wish to add new data columns to the table, use the Import Column option, which is described in Importing Additional Columns to a Data Table above.
- If you wish to refresh the entire table, overwriting all existing data, use the Reload Data option, which is described in Reloading Data Tables below.
To append new data rows to an existing table, right-click on the table in the project tree and select Append Data. The Import Data For Appending window will be displayed. Check that the columns that will be appended have been correctly mapped, then click Finish.
Reloading Data Tables
When data in a table has been updated outside of Leapfrog Geo and you wish to refresh the data, use the Reload Data option. With the Reload option, you cannot add or remove data columns from the import; this option simply refreshes the data in the project from the source files.
Reloading a data table overwrites all existing data. If you have data you wish to add to the project without overwriting existing data, use the Append Data or Import Column options.
To reload a data table, right-click on it in the project tree and select Reload Data. The Reload Table window will be displayed. Check that the data has been correctly mapped, then click Finish.
Mapping to a Different Data Source
You can change the data source for imported drilling data, points data and structural data tables. You can remap to a local file, a file from Central or an ODBC database. With drilling data, you can remap individual tables, but not a drilling data set.
Remapping a table does not reload data, it simply changes the table’s source. This is because you may need to remap multiple tables and to reload each table as it is remapped could require considerable processing time for dependent data objects. Once you have finished remapping all the tables you wish to remap, you can then reload the data and the tables and all dependent objects will be reprocessed.
To remap to a different data source, right-click on a table and select one of the Map to Source options:
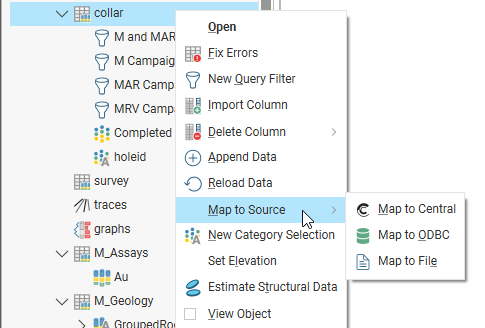
Whatever option you choose, the process is to select the new source, then check that the source content matches that already stored in the Leapfrog Geo project. You cannot add or remove data columns from the import, you are simply mapping the columns from the new source to the data already in the project.
Mapping to Central
The Map to Central option is only available when you are working in a Central-connected project.
For Map to Central, you can choose from the files that have been stored in a Central project’s Data Room. Select from the Central projects available, then select from the files available for that project. Here, a project’s collar file is being remapped and the M-Collar.csv file has been selected:
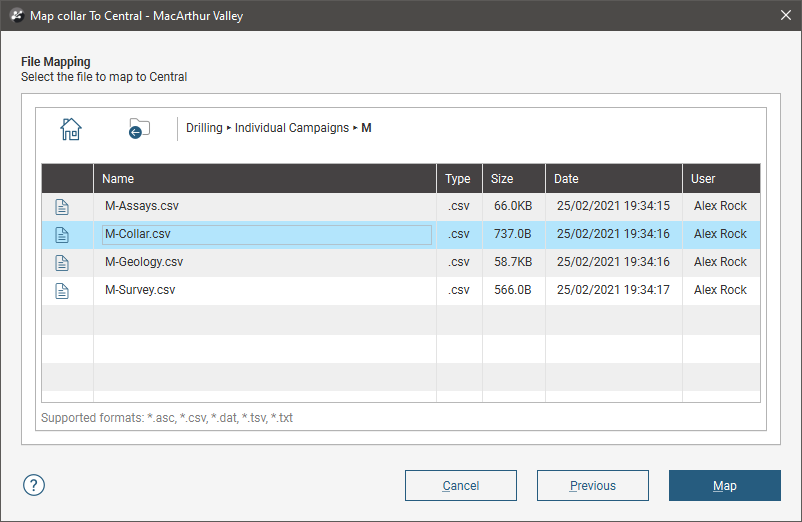
Click Map to display the file and check that the columns in the file match those already in the project, then Finish to complete the remapping of the data source. You can then reload the table using one of the Reload From Central options.
See Importing Data From Central for more information on importing and working with data from Central.
Mapping to a Local File
For Map to File Source, navigate to the file on your local hard drive you wish to use, then click Open.
Check that the columns in the selected file match those that Leapfrog Geo expects, then click Finish. You can then reload the file when required.
Mapping to ODBC
For Map to ODBC, enter the information supplied by your database administrator and click OK. If you are importing from a local database file, click the Database file option and then browse to locate the file.
Next, the tables in the database will be displayed. Select the table you wish to map to, then click OK. Once you have confirmed the column mappings, click OK. You can then reload the file when required.
Reload and Append Options for a Mixed Table Drilling Data Set
When a drilling data set has a mixture of file sources, the Reload and Append options for the data set as a whole will match the mapping of the collar table. For example, if the collar table is mapped to a local file, reloading the drilling data set will only reload tables that are mapped to local files. For example, here the collar and survey files are mapped to local files, whereas the assays and geology tables are mapped to Central files:

The Central-mapped files will need to be reloaded on a one-by-one basis.
Here the Reload and Append options available for the drilling data set are those of the collar file, and the drilling data set is marked with the Central symbol:
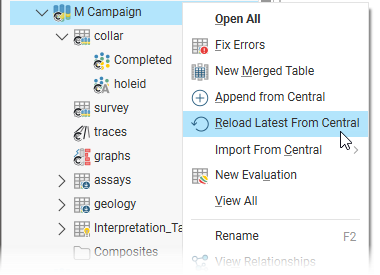
In this example, reloading from Central will update the tables with the latest version available on Central, and the local-mapped files will need to be reloaded on a one-by-one basis.
Got a question? Visit the Seequent forums or Seequent support